Forensic Soil Science Final Exam
1/132
There's no tags or description
Looks like no tags are added yet.
Name | Mastery | Learn | Test | Matching | Spaced | Call with Kai |
|---|
No analytics yet
Send a link to your students to track their progress
133 Terms
Soil Forensics
study of physical, chemical, and biological composition of soil as a part of criminal investigations
Soil microbial forensics
The study of how microbes in soil are used to forensic investigations
1 tbsp soil contains 109 microbes
vast majority microbes nonculturable
Makes soil one of most complex ecosystems on earth
Microbiome
totality of microbes in a defined environment, especially their genomes and interactions with each other and surrounding environment
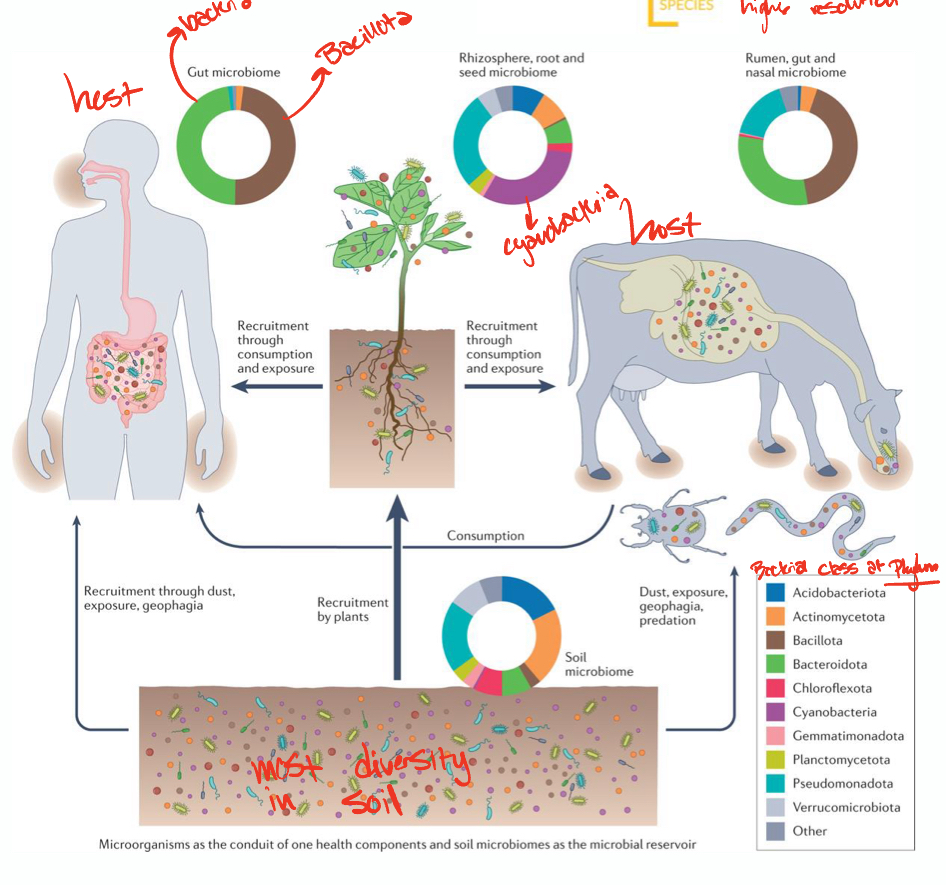
Soil microbiome
soils harbor the highest abundance and diversity of microorganisms
bacterial, archaeal, fungal species
bacteria dominate (mainly actinomycetota and pseudomonadota)
Why microbiome research is recently new
There was bias for culturable microbes, especially pathogens
Technology and tool availability has increased (PCR, sequencing, culture independent techniques)
Prokaryotes
contain no nucleus, no membrane bound organelles, single celled, single-circular chromosome for DNA, peptidoglycan cell walls, one origin of replication, coiled circular chromosomal DNA
Ex: bacteria and archaea
Eukarytoes
have true nucleus, linear DNA in rod shaped chromosomes, membrane bound organelles, single cellular or multicellular
Ex: fungi, protozoa, algae
Light microscopy vs Electron microscopy
Light: can visualize most plant and animal cells and mitochondria (100-1 micrometer)
Electron: visualize smallest bacteria, ribosomes, atoms (less than 1 micrometer)
Bacteria shapes
coccus= spherical
bacillus= rod-shaped
vibrio = curved
Types of bacterial classification
Phenetic —> physiology/morphology (under microscope and colonization)
Genotypic —> DNA composition
Phylogenetic —> evolutionary comparisons
Cell morphology
size (bacteria around 1 micrometer)
shape
arrangement
motility
Three cell wall features
Gram-negative (pink)
Gram-positive (purple)
Bacteria without cell walls
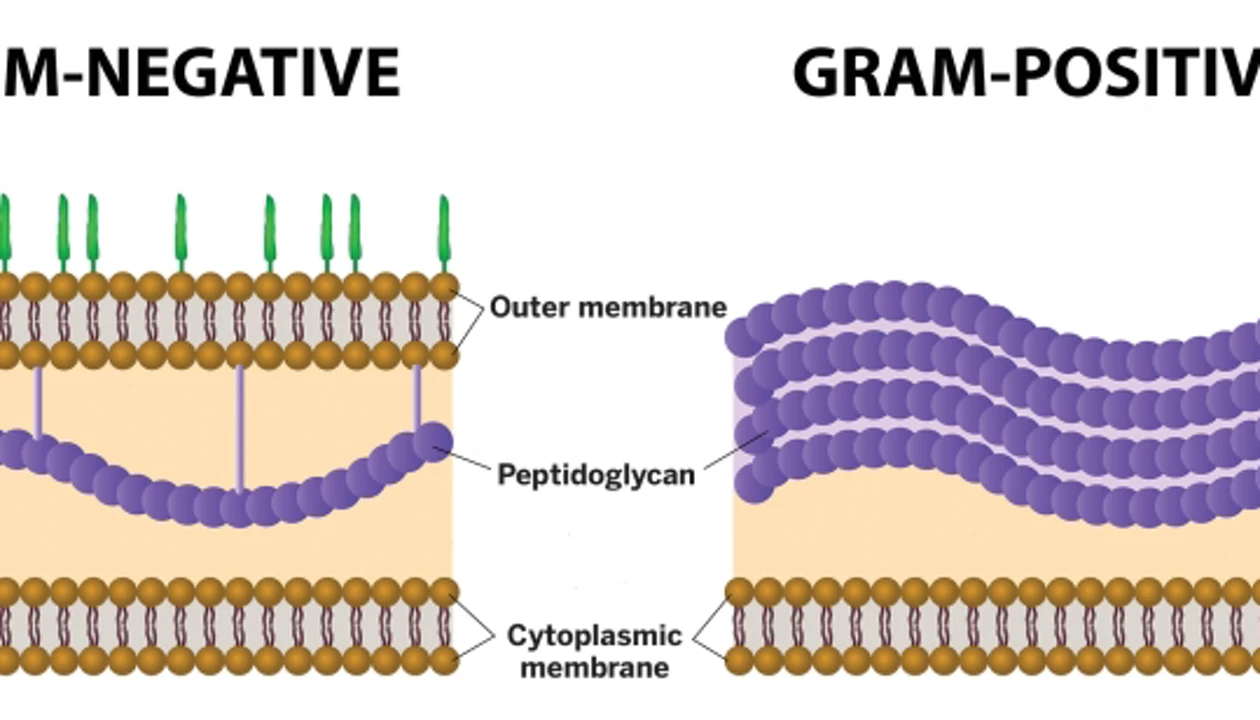
Gram-negative bacteria
contain one layer of peptidoglycan underneath outer membrane
stain PINK because outer membrane is destroyed
lack glycine peptide interbridge

Gram-positive bacteria
Thick peptidoglycan outer layer, then periplasmic space
stain PURPLE because peptidoglycan maintained
contain glycine peptide interbridge
Peptidoglycan features
glycan backbone and amino acid side chain
NAG and NAM
d form amino acids (unusuallll)
diamino acids
Gram staining method
application of crystal violet (purple)
application of iodine
alcohol wash (decolorization)
Application of safranin (pink counterstain)
Biochemical properties observable in culture/colonies
metabolism and enzymatic activity
nutrient utilization
DNA-DNA hybridization assay
extent of hybridization indicates degree of similarity between samples
more mismatches, more different organisms are from each other
GC content
G to C and A to T ratios are fixed in specific organisms
these ratios can vary, indicating uniqueness
increased GC content = increased withstanding of heat (curve shifted right)
DNA sequencing includes
sanger sequencing and whole genome sequencing
Average Amino Acid Identify (AAI) and Average Nucleotide Identity (ANI)
pairwise comparison between the whole or partial genome sequences of two microorganisms expressed as a percent identity
96% and up is good
Phylogeny
based on degree of DNA nucleotide similarity
mutations can occur however
high similarity = recent common ancestry w/ few mutations
low similarity = distant common ancestry w/ more mutations
16S ribosomal RNA (or 18S in eukaryotes)
commonly used for measuring homology
universally conserved
suitable for identifying relationships (ideal length of 1.5 kb)
conserved and variable regions (V4)
515F and 801R flanking V4
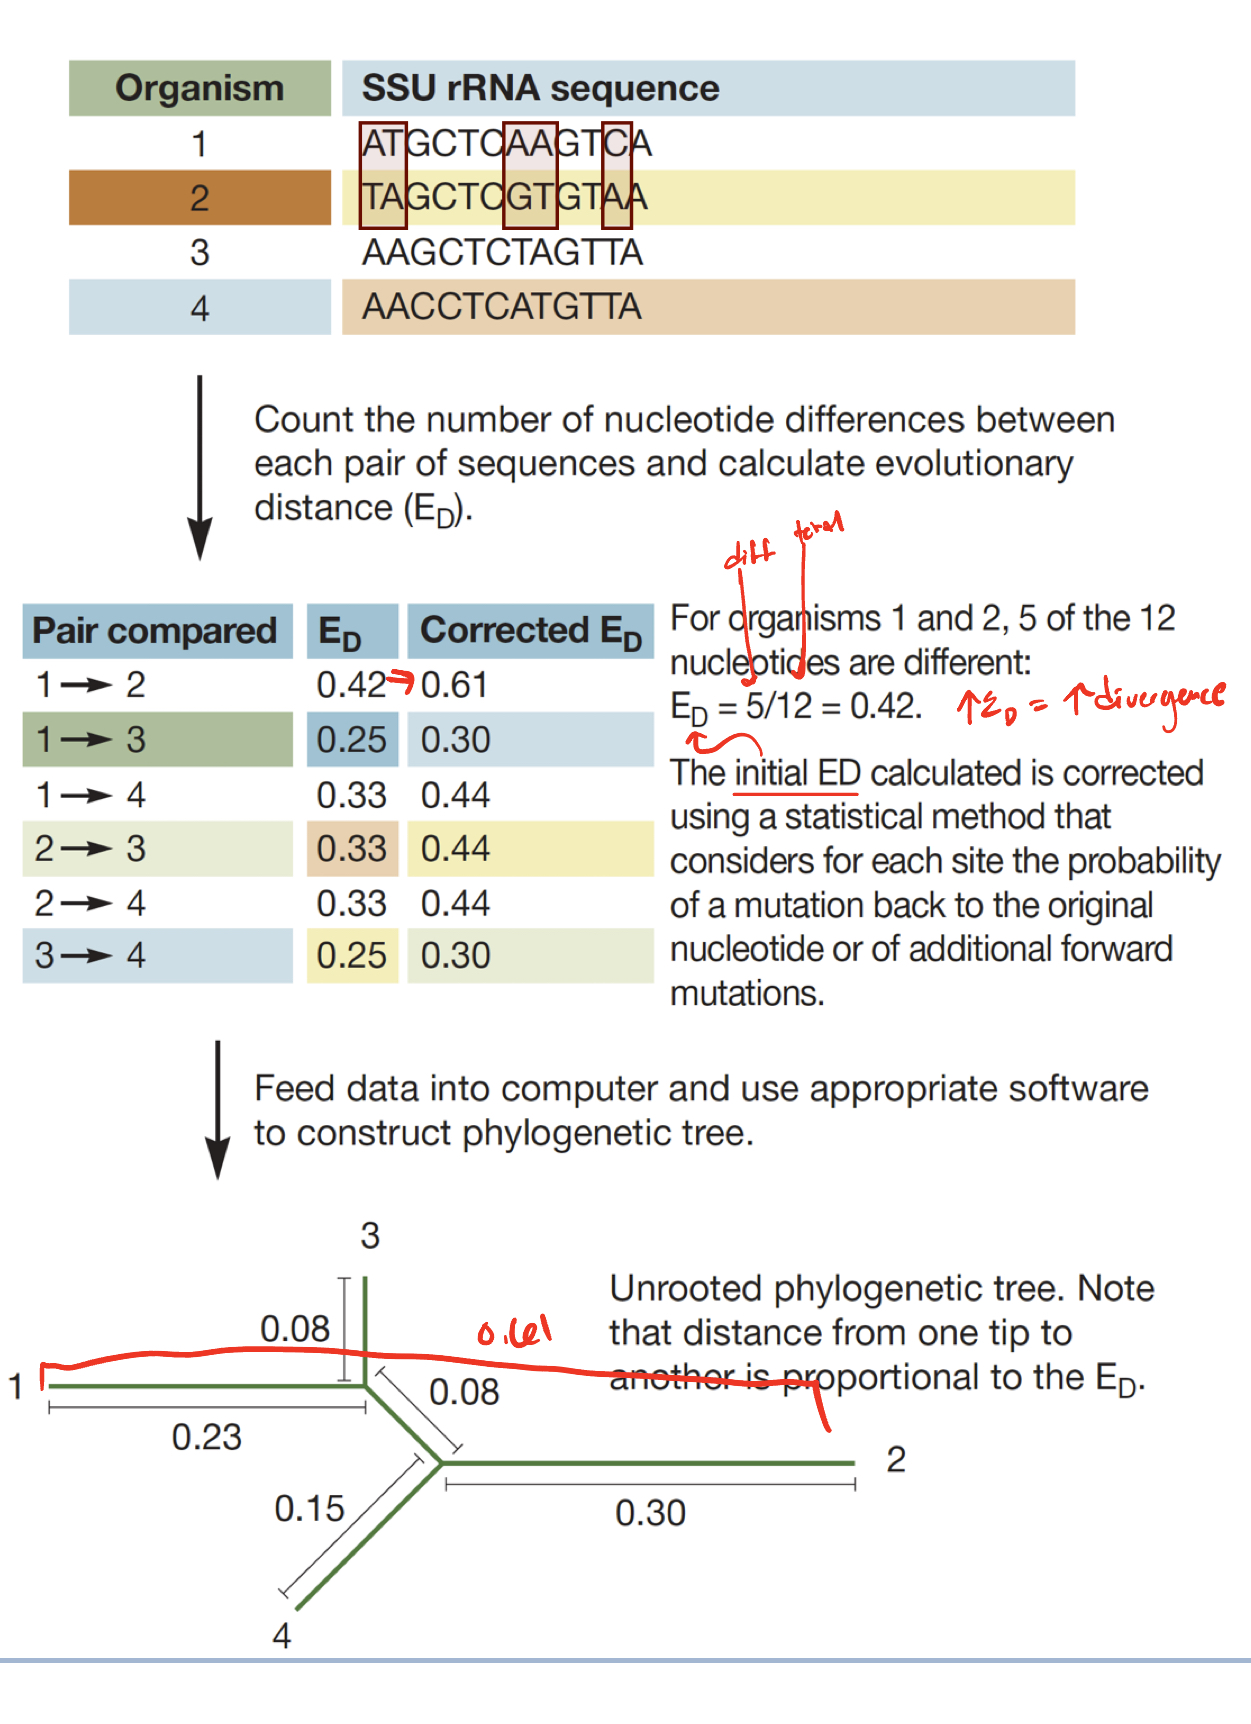
Evolutionary distance (ED)
number of nucleotide differences between sequences
UNDERESTIMATES true genetic divergence
Corrected ED
Adjusts for back and multiple mutations at the same site
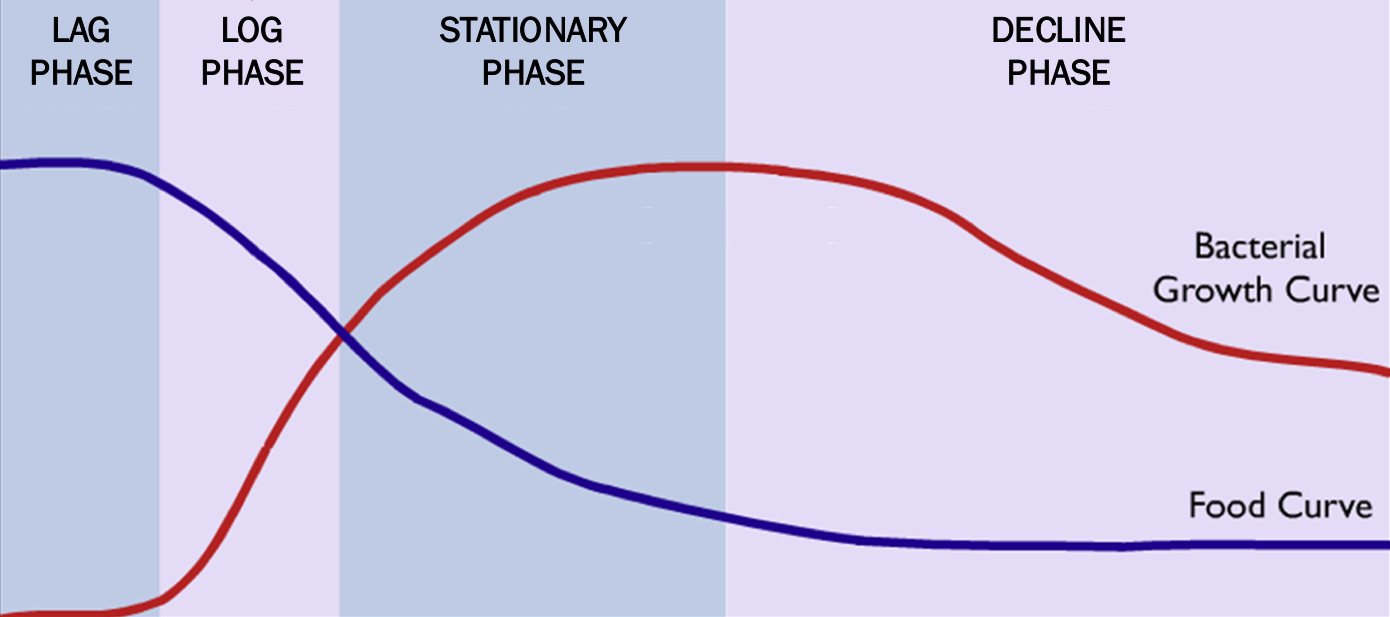
Bacterial growth
Binary Fission
grow exponentially
Growth characteristics
Lag phase = acquiring nutrients
Log phase = exponential growth (ONLY with resources)
Stationary phase = same amount replicating and dying
Decline phase = more death than growth
Chemotrophs
obtain energy through oxidation of chemical compounds
Chemoautotrophs or Chemoheterotrophs
Chemoheterotrophs
use ORGANIC compounds for BOTH energy and carbon
carbon source = organic compounds
ex: Escherichia coli
Chemoautotrophs
Use chemical energy from INORGANIC compounds to FIX CO2 into organic molecules
carbon source = CO2
ex: nitrosomonas
Phototrophs
Obtain energy from light
Photoheterotrophs
use light for energy but require ORANIC CARBON
carbon source= organic compounds
ex: Rhodospirillum
Photoautotrophs
use sunlight energy to FIX CO2 into organic molecules
carbon source= CO2
ex: Cyanobacteria
Oligotrophs
thrive in LOW nutrient environments
ex: Acidobacteria (low pH)
Copiotrophs
prefer nutrient rich environments
ex: Pseudomonadota
Three physical factors that affect bacterial growth
Oxygen
Temperature
pH
Obligate aerobes
Lots of Oxygen required!
Catalase, superoxide dismutase stops ROS species
Obligate Anaerobes
NO oxygen!
has no antioxidants to fight ROS species
Facultative Anaerobes
both oxygen and no oxygen! (prefers oxygen)
contains catalase and SOD for ROS species
Aerotolerant Anaerobes
No oxygen preferred (can still persist with O2, she dont care)
ONLY SOD, not catalase
Micro aerophiles
need LOW oxygen concentration
too much ROS bad
Psychrophiles
thrive in cold environments!
<15 C
ex: psychrobacter, Flavobacterium
Mesophiles
moderate temperatures
20-45 C
most soil bacteria
ex: Pseudomonas fluorescens, Bacillus subtilis
Thermophiles
Hot environments
45-80 C
hot springs with high organic matter
ex: Thermus aquaticus (Taq Polymerase!!!)
Hyperthermophiles
extreme heat
above 80 C
geothermal or deep sea vents
ex: pyolobus fumarii, Thermococcus gammatolerans
pH naming systems for bacteria
range from:
extreme acidophiles (pH=1) to extreme alkalophiles (pH=14)
Agar
remains solid at incubation temperatures and indigestible to most microbes
stable growth environment
Complex vs Defined Media
Complex: provides more than necessary nutrients
Defined: provide ONLY building blocks needed for growth
Three culture based techniques
Spread plate
Pour plate
Streak plate
Two culture independent techniques
Amplicon based —> 16S rRNA, 1 specific region
Shotgun metagenomic —> sequences all genes
PCR steps
Denaturation (95 C)
Annealing (60 C)
Extension (72 C)
PCR components
dNTP’s, Taq Polymerase, buffer solution, Mg2+, primers
Gel Electrophoresis
loading dye is added to the DNA, placed in wells, run from a negative to positive current, separating DNA by size and charge
smaller DNA moves further
UV visualization= based on fluorescence from dyes bound to aromatic nucleotides
qualitative —> position + presence and absence
Prokaryotic ribosomes
50S (Large): contains peptidyl transferase center
30S (small): associates with mRNA during translation, mRNA decoding
How soils bacteria can be used in forensics
traced back to objects related to a crime
can estimate PMI
3 steps for investigating microbial communities
sample collection and storage
DNA extraction, purification, and quality control
16S rRNA amplicon sequencing and analysis
Sample collection
use sterile tools, gloves, screw-top tubes
Sample storage
store samples at a low temperature (-20 to -80 C) to preserve DNA quality
Why is bead beating used?
to avoid biases in soil extraction so that gram negative and gram positive bacteria can both be lysed
Three steps for obtaining DNA samples
Lysis (extraction) [mechanical and non mechanical]
Isolation (purification)
Resuspension
Types of Lysis
Physical —> efficient, time consuming, costly
Chemical —> easy, fast, low cost, can cause disruption in sample
Enzymatic —> no equipment required, selective, expensive, time consuming
Three types DNA extraction
Phenol-Chloroform Extraction
Silica-Phase Extraction
Magnetic Bead Extraction
Phenol-Chloroform Extraction
uses 1. cell lysis, 2. phase separation (H2O= top, chloroform=bottom), 3. transference, 4. precipitation (ethanol), 5. resuspension
more DNA obtained, collecting aqueous phase takes practice
Silica-Phase Extraction
uses 1. cell lysis, 2. DNA binding to column (high salt), 3. washing (ethanol), 4. elution (low salt aka water)
fast and selective, amount DNA limited
Magnetic Bead extraction
uses 1. cell lysing 2. mix with beads, 3. put into separator, 4. wash, 5. DNA elution
moneyyyy
Nucleic acid absorption values
around 260 nm
proteins: 280
salts and organic: 230
INCREASE TEMP INCREASE ABSORPTION
Qubit Flex (Fluorometry)
fluorescent dyes bind selectively to either DNA or RNA (specific)
CANT see contaminants with this method
Three ways to assess DNA purity
Absorbance
Electrophoresis
Bioanalyzer
Absorbance (DNA purity)
A260/A280 = 1.9-2.1
less than 1.9 —> protein contamination
Greater than 2.1 —> wrong blank
A260/230 = 1.5-1.8
less than 1.5 —> contamination with phenol, organic material, salts
Gel electrophoresis (DNA purity)
visualize DNA bands
All at the top = larger DNA materials w/o contaminants
Most in middle or bottom = contamination with fragments, RNA, etc.
Bioanalyzer (DNA purity)
electrophoretic separation on microchips!
smaller molecular weights measured first, larger later
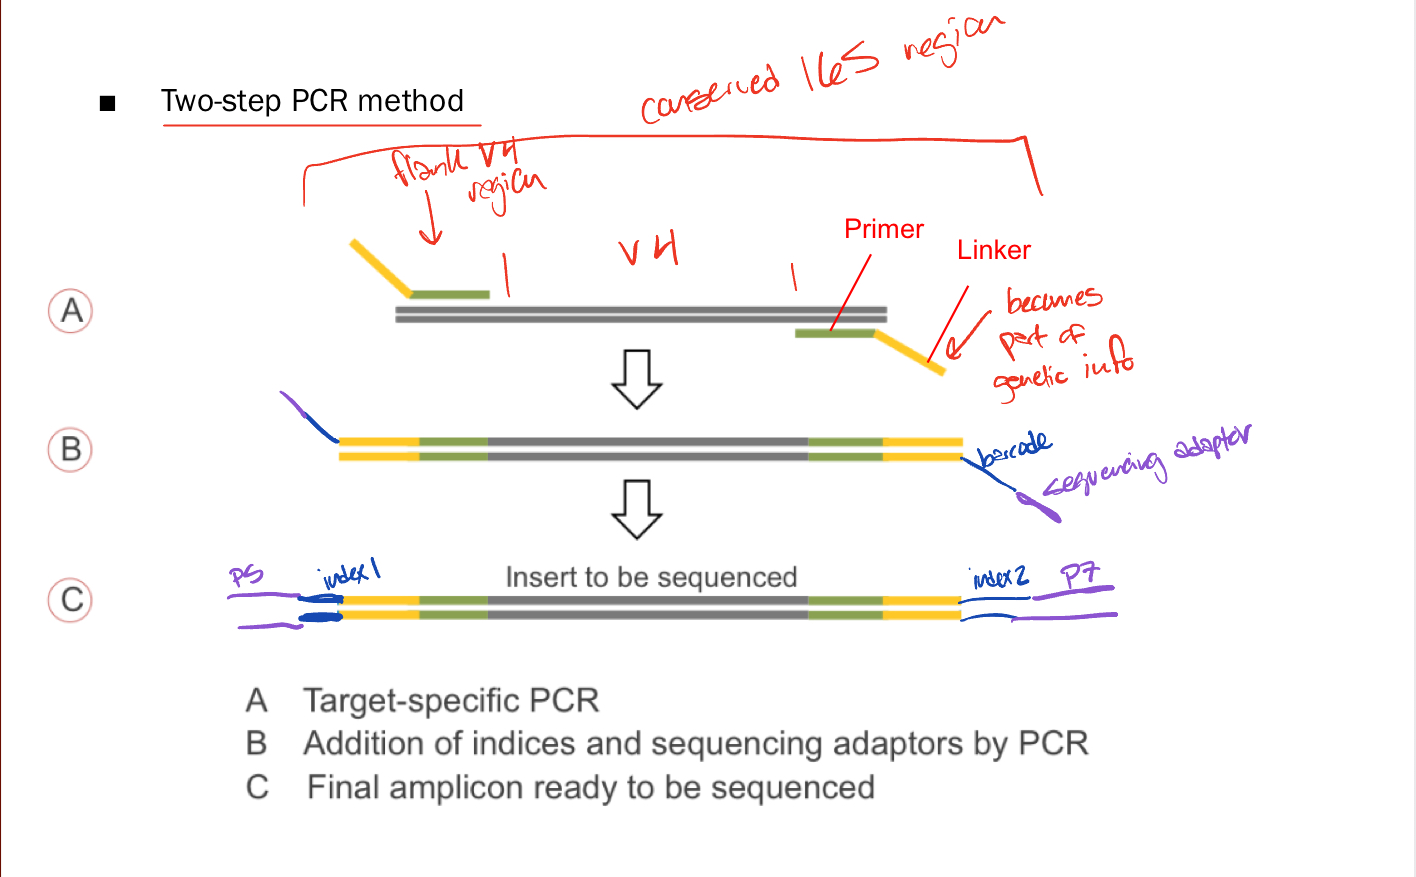
Library Preparation
two step PCR method in which
A. target specific PCR occurs
B. Addition of barcodes and sequencing adaptors by 2nd PCR
C. Final amplicon ready to be sequenced

Parts of Library Preparation
Primer —> bind to conserved regions around variable regions
Linker —> overhang that barcodes bind to
Barcodes —> specific DNA tags to identify DNA after multiplexing
Sequencing adaptors —> bind fragments to flow cells
Specific variable amino acids
Y or W
include many specific primers to account for that
PCR product sizes
V4 region = 252 bp
PCR 1 product = 319 bp
PCR 2 product = 388 bp
Multiplexing
Samples are sequenced together for efficiency, barcodes identify specific samples
Normalization
make libraries equally represented in concentration
First vs Second vs Third Generation sequencing
1st - Sanger (dNTP’s and electrophoresis, 500-1000 bp fragments)
2nd - Illumina (each nucleotide fluorescing, 50-500 bp fragments)
3rd - Nanopore (tens of kb fragments)
Cluster generation
amplification of library with primers fixed to flow cell surface
each unique baterial 16S V4 sequence forms its own cluster
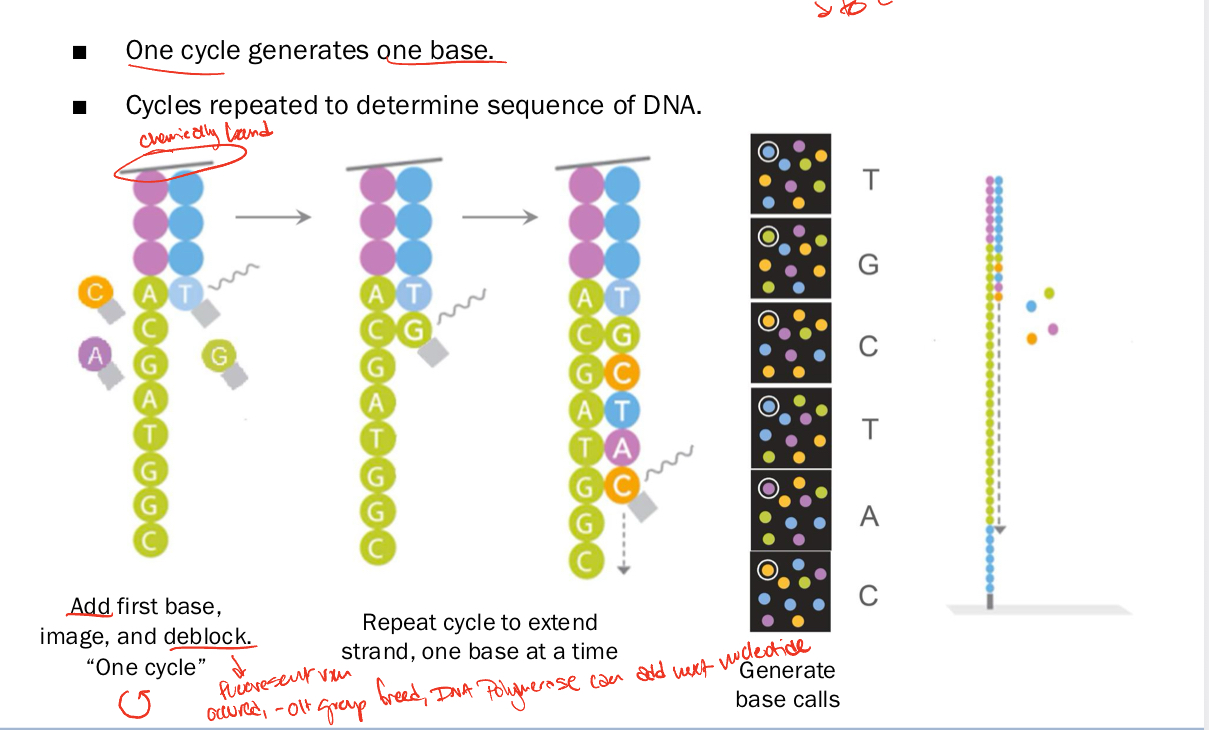
Illumina sequencing by synthesis
one cycle generates one base
add first base, image, deblock
fluorescent dye added to 3’ -OH, Polymerase cant add next nucleotide till this is removed
Steps of bioinformatic analysis
Demultiplexing
Quality Control
Denoising reads
Taxonomy assignment
Microbial diversity analysis
1st : Demultiplexing
assigning reads to corresponding sample based on barcodes
we only used forward reads because our sample was too long
2nd : Quality Control
FastQC —> forward and reverse reads separated, quality decrease towards end of sample
MultiQC —> Overall reads together, gives PHRED score
PHRED greater than 20 is good
PHRED less than 20 is bad
PHRED scores
corresponds to probability P for nucleotide to be wrong
Q = -10log10 x P
P = 10-Q/10
Q= 20 means P=0.01, meaning probability of 1% to be incorrect
3rd : Denoising reads
DADA2 = Divisive Amplicon Denoising Algorithm
uses abundance data and error model to remove sequencing errors and detect ASV’s
ASV’s = Amplicon Sequence Variants
highly resolved DNA sequences that represent distinct biological entities in microbiome studies
Operational Taxonomic Units (OTU’s)
Before DADA2
comparison of divergence
94% = genus , 97% = species
4th : Taxonomy assignment
comparison of sequences against database
be careful with dominating taxas that require deep sequencing
universal primers might not amplify all taxa evenly
5th : Microbial diversity analysis
Rarefaction = standardize unequal sampling sizes
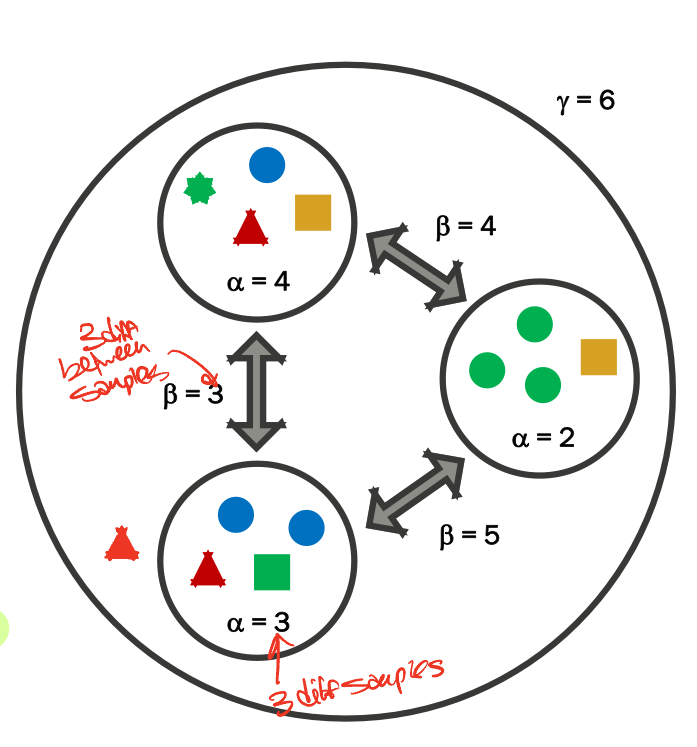
Measuring Diversity
gamma diversity = TOTAL species diversity
alpha diversity = the mean species diversity at sites (higher = more diverse, lower = less)
beta diversity = differentiation among those habitats (higher = less diverse, lower = more)
Qualitative
presence/absence of taxa in samples
Quantitative
considers presence/absence and relative abundance
Non-phylogenetic diversity metrics
Observed features: calculates # ASV’s (qualitative)
Chao1: measures richness based on rare classes (qualitative)
Chao1= N + S2/(2D)
S= singletons, D=doubletons
Shannons H: Measures based on richness AND evenness (quantitative)
0 = 1 species, 1.5-3.5= normal range, 5= very diverse
Phylogenetic diversity metrics
Faiths phylogeneti diversity (PD): measures diversity by incorporating phylogenetic difference between species (qualitative)
greater PD = greater branch length = more divergent
Rarefaction
standardizes sample sizes by randomly subsampling data
multiple rarefactions give curves that show where to subsample
Plateaus = # observed species dont change (SAMPLE HERE)
Jaccard (dis)similarity
quantifies based on presence/absence
J(A,B) = shared taxa/total unique taxa
Similarity of 1 = perfectly similar
Dissimilarity of 0 = no dissimilarity
Bray Curtis dissimilarity
presence and abundance of taxa
BC (A,B) = sum of subtracted similar samples / sum of added similar samples
BC = 0, identical
BC = 1, no species in common
Unifrac (Phylogenetic)
Unweighted: abundance not taken into account
Weighted: abundance taken into account
Unifrac = 0, identical
Unifrac = 0.5, half shared
Unifrac = 1, no overlap
Principal coordinate analysis (PCoA)
uses disssimilarity matrices and creates plot
dots closer = more similar
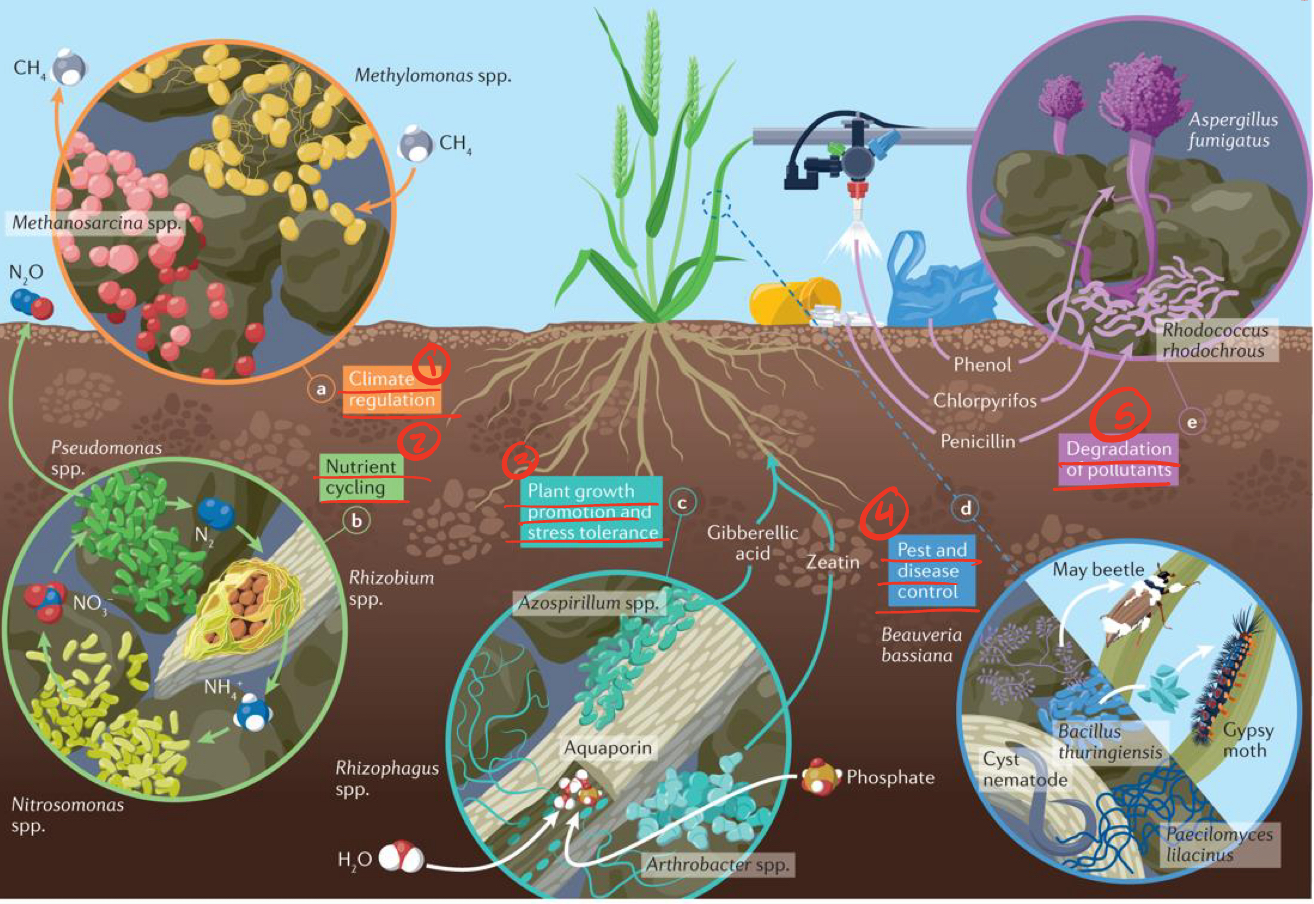
Key functions of soil microbiomes
a. climate regulation —> methylomonas take in CH4, methanosarcina release CH4
b. nutrient cycling —> Rhizobium take in N2, Nitrosomonas take in NH4 and release NO3, pseudomonas take in NO3, release N2O
c. plant growth promotion and stress tolerance —> Rhizophagus take in H2O, arthrobacter release phosphate
d. pest and disease control
e. degradation of pollutants
Soil structure drives the microbiome
clay, silt, and sand have different pores and aggregates
Root influenced soil - Rhizosphere
most organic matter
higher microbial biomass an activity
lower diversity
high rates of organic matter flow