2.2 Elasticities
1/55
There's no tags or description
Looks like no tags are added yet.
Name | Mastery | Learn | Test | Matching | Spaced | Call with Kai |
|---|
No analytics yet
Send a link to your students to track their progress
56 Terms
What is elasticity
Elasticity measures how responsive one variable is to a change in another
- A measure of how responsive one variable is to a change in another, expressed as a coefficient using percentage changes.
Why do we use percentage changes for elasticity
They show relative responsiveness and allow comparisons across products and price levels.
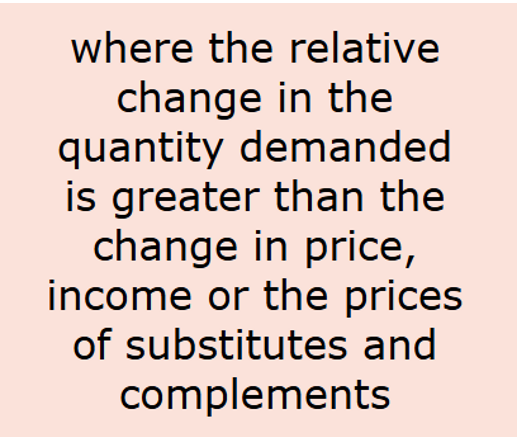
What makes a good elastic
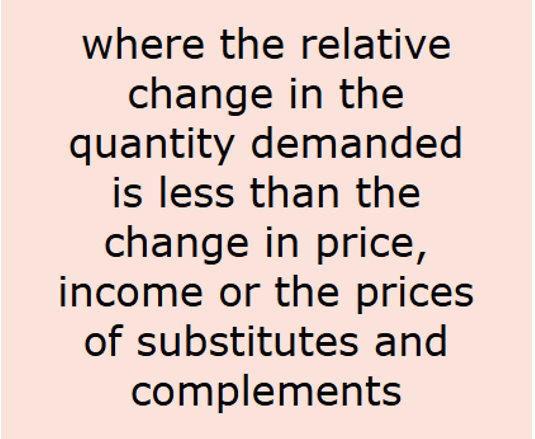
What makes a good inelastic
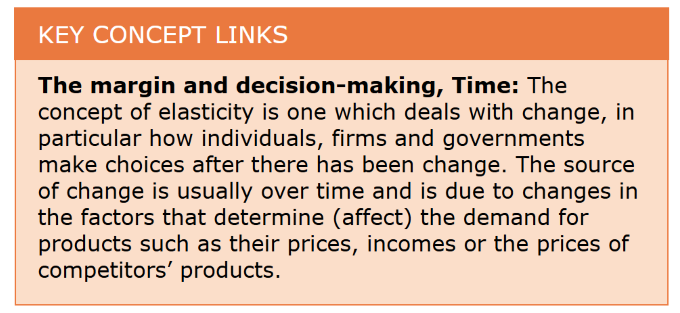
Key concept link
What is price elasticity of demand (PED)
The responsiveness of quantity demanded to a change in the product’s own price, ceteris paribus.
What does it mean if a product is price elastic
What does it mean if a product is price inelastic
What is the formula for PED
PED = % change in quantity demanded ÷ % change in price.
Why is PED usually reported as an absolute value
Because the law of demand makes the coefficient negative, but we usually focus on magnitude, not sign.

What do PED values mean?
> 1 elastic (responsive)
= 1 unitary
< 1 inelastic (unresponsive)
= 0 perfectly inelastic
→ ∞ perfectly elastic.
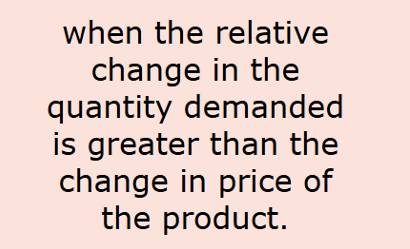
What does PED > 1 mean + diagram
Demand is elastic — quantity demanded is very responsive to price changes.
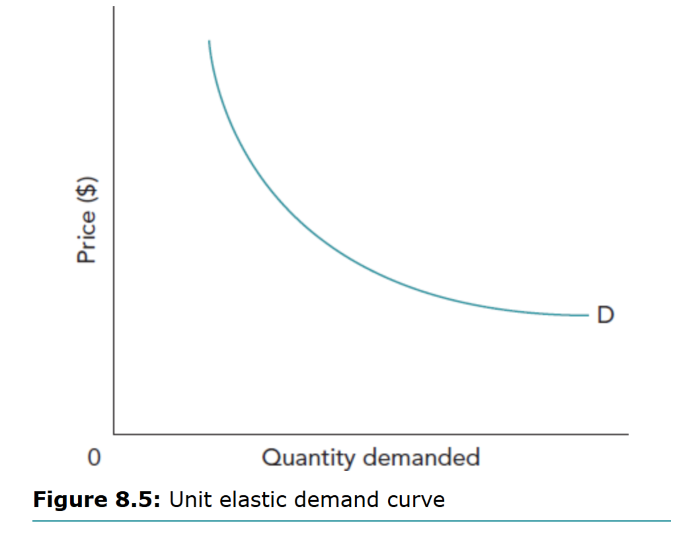
What does PED = 1 mean + diagram
Demand is unitary elastic — % change in quantity demanded equals % change in price.
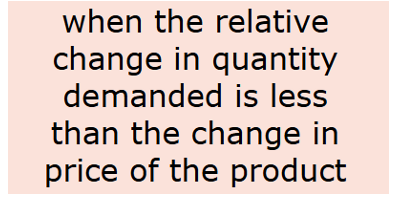
What does PED < 1 mean + diagram
Demand is inelastic — quantity demanded is not very responsive to price changes.

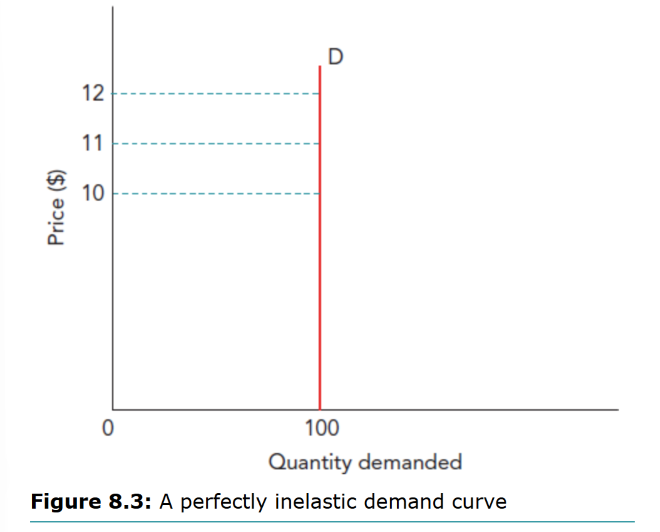
What does PED = 0 mean + diagram
Demand is perfectly inelastic — quantity demanded does not change with price (a change in price has no effect n the quantity demanded)
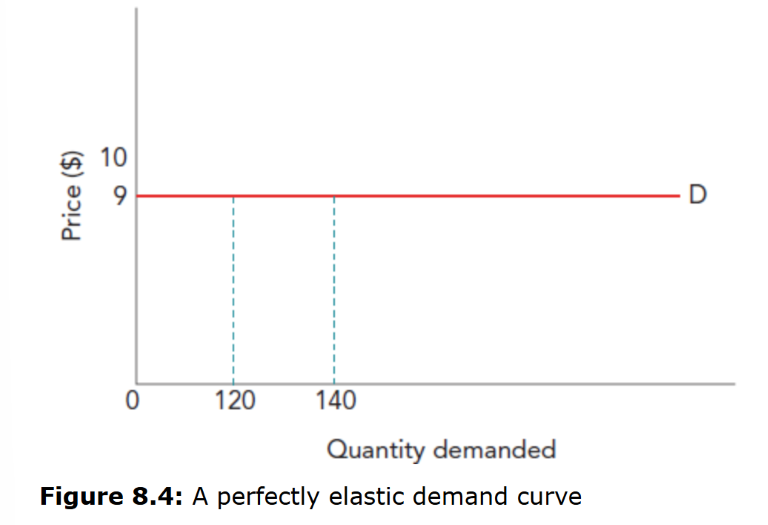
What does PED → ∞ mean + diagram
Demand is perfectly elastic — any price increase causes quantity demanded to drop to zero.
- Where all that is produced is sold at a given price
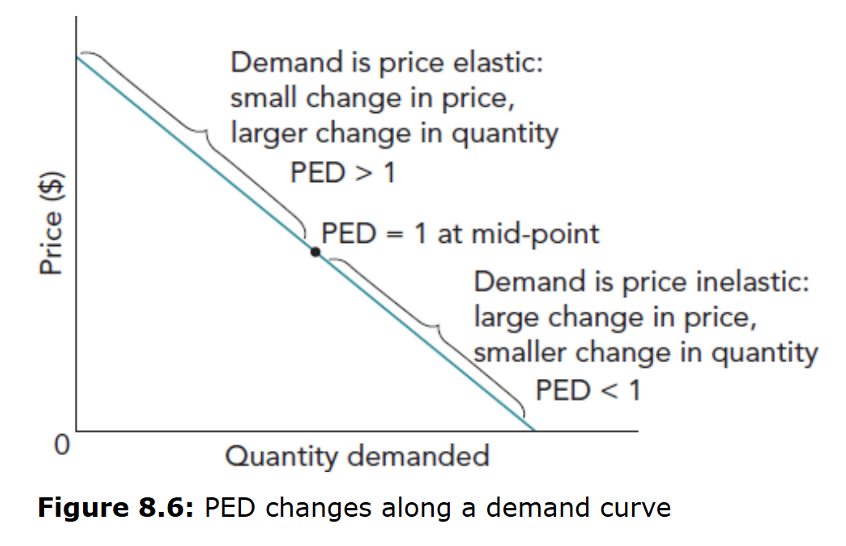
How does PED vary along a straight-line demand curve (diagram)
• Top (high price, low quantity) → elastic (PED > 1)
• Middle → unitary (PED = 1)
• Bottom (low price, high quantity) → inelastic (PED < 1)
Name 7 factors affecting PED (3 main + 4 under 1).
Availability and attractiveness of substitutes → more/close substitutes = more elastic
- Quality & extent of available information
- Necessity vs luxury → luxury = elastic, necessity = inelastic
- Brand loyalty → strong loyalty = inelastic
- Addictive propertiesRelative expense of the product / proportion of income spent → larger proportion = elastic
Time period (short or long run)→ short run = hard to change spending patterns, long-run demand = more elastic
What can PED be used to explain (3)
How does price elasticity of demand (PED) explain price variations in a market + examples
Firms charge higher prices when demand is price inelastic and lower prices when demand is price elastic.
- For example, tickets for “must‑see” events (e.g. major sports finals) are expensive because consumers are less sensitive to price.
- Similar pricing occurs with peak vs off‑peak travel, last‑minute airline tickets, and restaurant meals during festivals.
Businesses use differences in PED to vary prices and maximise revenue.
How does PED affect total revenue (TR)
• Elastic (PED>1): P↑ → TR↓, P↓ → TR↑
• Inelastic (PED<1): P↑ → TR↑, P↓ → TR↓
• Unitary (PED=1): TR unchanged with price changes
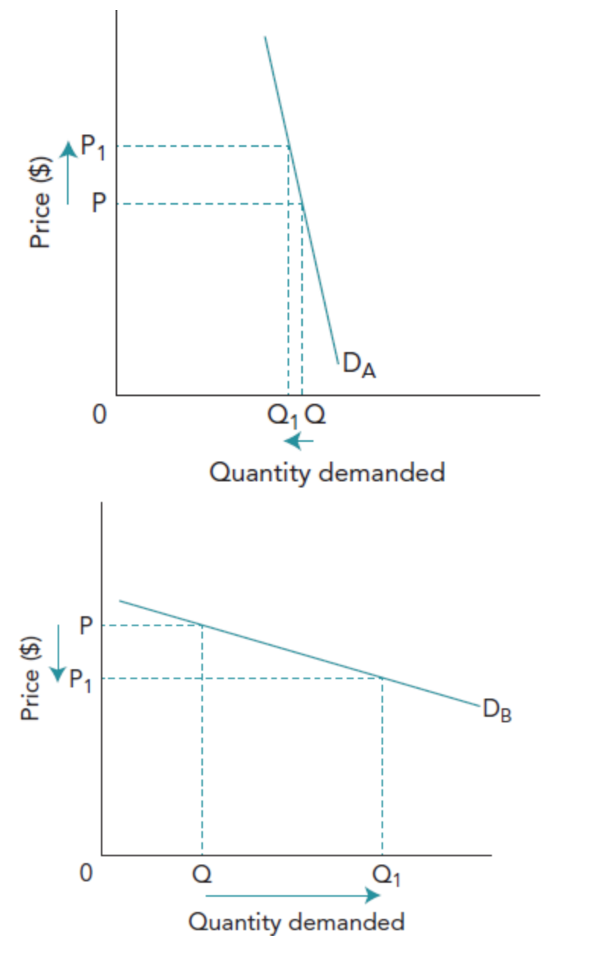
How can PED inform pricing decisions + diagrams
• Elastic demand → lowering price increases revenue
• Inelastic demand → raising price increases revenue
How can firms make demand more price inelastic in order to increase revenue (4)
Persuasive advertising/branding - highlights benefits compared to substitutes
Product differentiation - to make products seem superior
Mergers -> increase market share/power
Patents/regulations/unique products (shifts demand and weakens substitution). -> firm creates monopoly
Why is PED important for government policy
It helps predict effects of indirect taxes/subsidies on consumer spending and tax revenue, and how prices influence market outcomes.
Reality check on estimates.
All elasticity values are approximations—data and measurement issues mean results are estimates, not exact constants.
What is the typical sign of PED
Negative, due to the law of demand, but reported as positive in absolute terms.
What does a high PED imply about substitutes
Many close substitutes exist — consumers can easily switch if price changes.
What does a low PED imply about necessity
The good is a necessity or has few substitutes — consumers continue buying even if price rises.
What is income elasticity of demand (YED)
The responsiveness of quantity demanded of a good to a change in consumer income, ceteris paribus.
What is the formula for YED
YED = % change in quantity demanded ÷ % change in income.
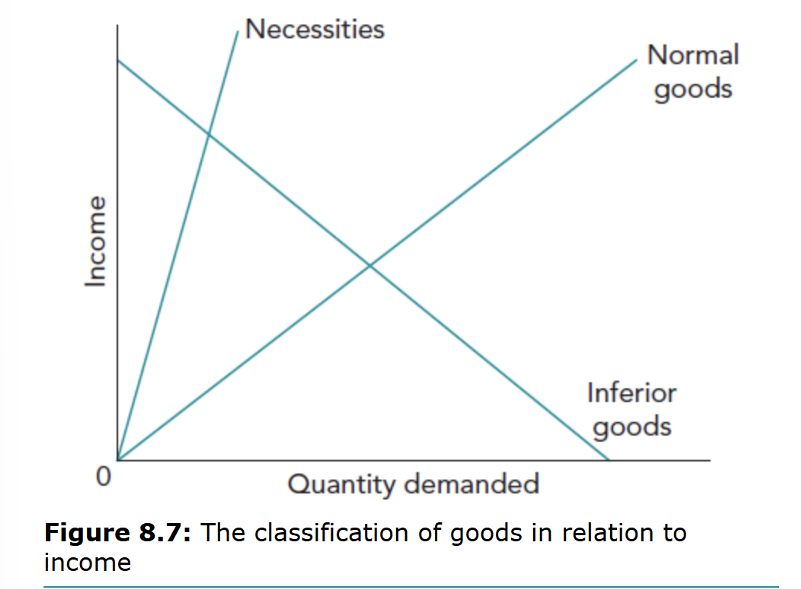
How does YED sign and size classify goods
YED > 1 luxury/superior
0 < YED < 1 necessity (normal)
YED < 0 inferior.
(Exam tip: state both sign and size, not just the sign.)
What is a normal good
Most common/most products - as income increases, quantity demanded increases
- YED is positive & expected to be between 0 and 1
What is an inferior good + examples
One where the quantity demanded decreases as income rises e.g. poor quality rice & packet noodles
- YED is negative
What is a necessity good + examples
A type of normal good with a YED that is positive but close to zero
- Quantity demanded is unlikely to change much when income changes
- e.g. rice, flour, pulses
What is a superior/luxury good
A good with a YED greater than 1
- Quantity demanded is very responsive to changes in income
- e.g. designer clothes, jewellery, the latest electronics
What does YED > 1 indicate
The good is a luxury/superior — demand is very responsive to income changes.
What does 0 < YED < 1 indicate
The good is a necessity — demand increases with income, but less proportionately.
What does YED < 0 indicate
The good is inferior — demand decreases as income rises.
Show on a diagram the relationships between a change in income and the quantity demanded for the necessities, normal goods & inferior goods.
Tip - income elasticity of demand, what is it important to know
Name 3 factors affecting YED.
1. Nature of the good (luxury = high YED vs necessity = low YED)
2. Income level of consumers (more income = more desirable goods)
3. Proportion of income spent on the good:
→ Goods taking a larger share of income (e.g. cars) see bigger changes in demand when income changes → higher YED
How can YED inform government & business decisions
It helps governments predicts how future demand changes with income (can help decide allocation of gov. spending), also helping firms plan production or target markets
- Plan output/markets for booms vs recessions (luxuries volatile; necessities stable).
What is cross elasticity of demand (XED)
The responsiveness of quantity demanded of one good to a change in the price of another good, ceteris paribus.
What is the formula for XED
XED = % change in quantity demanded of Good A ÷ % change in price of Good B.
(Exam tip: Numerator is always %ΔQd of the named good.)
What do XED signs and sizes show
XED > 0 - positive XED = substitutes (larger value ⇒ closer substitutes).
XED < 0 - negative XED = complements (larger magnitude ⇒ tighter complementarity).
XED = 0 = unrelated goods.
What does a positive XED indicate (XED > 0 )
The goods are substitutes - an increase in the price of one will cause an increase in the quantity demanded of the other
What does a negative XED indicate (XED < 0)
The goods are complements - an increase in the price of one will cause an decrease in the quantity demanded of the other
What does XED = 0 indicate
The goods are unrelated/have no relationship
Tip for calculating XED
Name 2 factor affecting XED.
- Degree of closeness (strong or weak) of substitutes or complements.
- Whether consumers act rationally or not
Why is XED important to firms
Firms monitor XED because high positive XED indicates close substitutes, meaning competitor price cuts can significantly reduce their own demand.
How do substitutes and complements affect firms’ pricing decisions using XED
• Positive XED (substitutes): A competitor price cut can strongly reduce demand for a firm’s product.
• Negative XED (complements): Firms can use joint pricing strategies (e.g. meals and drinks) to increase total revenue, even if demand for one product is price inelastic.
How does the size of the XED coefficient affect revenue and pricing strategies
The larger the XED, the stronger the response of demand. A high XED (e.g. 1.5) means a small price change in a related product causes a large change in demand, helping firms design pricing structures that maximise total revenue.
What is the main difference between PED, YED, and XED
• PED: response to own price changes
• YED: response to income changes
• XED: response to price changes of another good
Why must elasticity always be calculated using percentage changes
Because elasticity measures relative responsiveness, not absolute change.
Why are elasticity values often only rough estimates in practice (3)
Elasticity values are difficult to measure because:
- data may be unreliable over time
- products and technology change rapidly
- many non‑price factors affect demand
As a result, firms often rely on approximate estimates rather than precise calculations.
3 tips for calculations
(Exam tip: Numerator is always %ΔQd of the named good.)
• For PED/YED/XED, always use percentage changes (not absolute units).
• For XED, do not put %ΔQ of B in the denominator—use %ΔP of B.