Lecture 14: One-way ANOVA
1/24
There's no tags or description
Looks like no tags are added yet.
Name | Mastery | Learn | Test | Matching | Spaced | Call with Kai |
|---|
No analytics yet
Send a link to your students to track their progress
25 Terms
Family-Wise Error Rate (FWER)
the probability of making at least one Type I error (false positive) across a set of statistical tests
Protects against false discoveries
w/o controlling FWER, you might conclude there’s an effect when there isn’t
Esp important in studies with multiple concerns (ex: post hoc)
What increases FWER?
Number of tests: more tests → higher chance of at least one false positive
What can we do to control FWER?
By making it harder to declare significance across multiple tests: Bonferroni correction, Tukey’s HSD, limit # of tests
What is ANOVA? What kinds of questions can we answer with ANOVA?
Used to test where there are mean differences across 3 or more groups
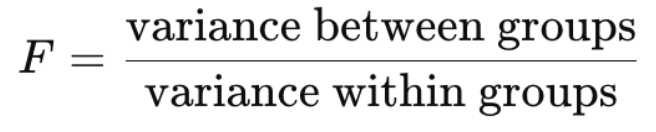
Compares between and within-group variability
Can an ANOVA test be one-sided and/or two-sided?
Always one-sided
What does it mean when we say that ANOVA is an omnibus test?
Tests for overall difference among groups, but doesn’t tell you where the difference is
What is the F distribution and how does it differ from the normal distribution?
the probability distribution of the F statistic, which is a ratio of two variances
Measures how large a variance ratio is
Always non-negative (ranges from 0 to infinity)
Right-skewed
Defined by 2 df: df1 (numerator; between-groups), df2 (denominator; within-groups)
How does the F distribution change as a function of degrees of freedom / sample size? How does it change as a function of levels within a factor?
As df increases (larger n):
Distribution becomes less skewed
It becomes more peaked and concentrated near 1
The right tail becomes shorter
Df1 = k - 1
K = # of groups (levels)
one-way ANOVA - what type of question does it test?
tests whether there are mean differences across 3 or more groups defined by one IV (factor)
One-way: one IV
That variable has multiple levels (groups)
How does one-way ANOVA differ from a t-test?
T-test: compares means between 2 groups only
One-way ANOVA: compares means across 3+ groups
If I ran a one-way ANOVA on a variable with 2 groups, how would that compare to the t-test results?
They give the same results (same p-value and conclusion)
What do the null and alternative hypotheses look like for a one-way ANOVA?
Ho: all group means are equal and any observed differences are due to chance
Ha: not all group means are equal and at least one mean is different
What is the sum of squares (SS)? Conceptually, what do these numbers quantify?
SS: measures variability - the total amount of deviation in the data
TSS: total variability in the data - how far each observation is from the grand mean
SSW (aka SS Error/SS Residual): variability within each group - how far each observations is from its own group mean
SSB: variability between group means - how far each group mean is from the grand mean
What values are being compared in each of the SS equations?
SST: each score vs grand mean
SSW: each score vs its group mean
SSB: each group mean vs grand mean
What is the relationship between Total SS, SSW, and SSB?
SST = SSB + SSW
Explained variance (between groups)
Unexplained variance (within groups)
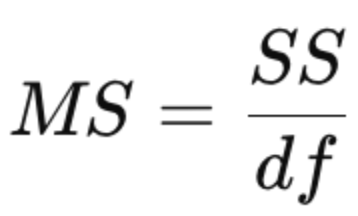
What is the mean squares (MS) value and how does that differ from SS?
MS = SS divided by df
SS: total variability
MS: average variability per degree of freedom
What is the F-statistic (F-ratio/F-value)?
it compares signal (between-group differences) to noise (within-group variability)
bigger vs smaller vs F-ratio equals 1
The F ratio gets bigger? i.e., beyond 1
Strong evidence of real group differences
Between-group variability is much larger than within-group variability
The F ratio gets smaller? i.e., closer to 0
Little to no evidence of differences
Between-group variability is very small relative to within-group variability
The F ratio equals 1?
Differences are what we’d expect by chance → fail to reject Ho
Between-group ≈ within-group variability
What impacts the number of degrees of freedom between that we have?
df_between = k -1
Higher k → higher df_between
What impacts the number of degrees of freedom within that we have?
df_within = N - k
N = total sample size
Larger n → higher df_within
More groups → lower df_within (since data are split across groups)
What are the assumptions of ANOVA?
1. Normality: the sampling distribution of the mean must be normal
2. Independence: the observations in the data are not correlated with each other
3. Homogeneity of the variances: the population sds are the same for all groups
How can we test these assumptions?
1. Normality: visual methods: QQ plot, histograms, statistical test: shapiro-wilk test
2. Independence: based on study design
3. Homoscedasticity: levene’s test or brown-forsythe test. Look at group sds
What test can we run if the assumption of homogeneity of the variances isn’t met?
Welch’s ANOVA
Doesn’t assume equal variances, more reliable when group variances differ
Adjusts df
What test can we use if the assumption of normality is not met?
Kruskal-Wallis test
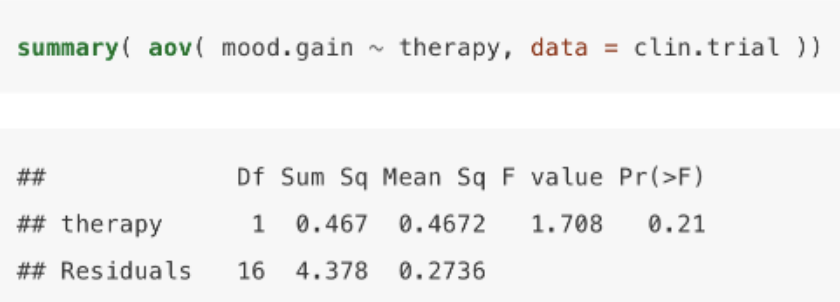
output of a one-way ANOVA in R
DV: mood.gain, IV: therapy
Therapy row: between-groups variation
# of groups - 1 → 2 therapy groups
SS = 0.467 → SSB (variation due to group differences)
Mean sq: 0.4672 → SSB / df → average between-group variability
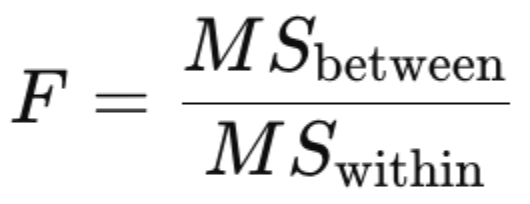
F-value = 1.708 = MSB/MSW
Close to 1 → between-group variance ≈ within-group variance
Residuals row: within-groups variation
df = 16 → total sample size (18) - # of groups (2)
SS = 4.378 → SSW (random variability)
Mean sq = 0.2736 → average within-group variability