PSYC 344 Exam 3
1/103
There's no tags or description
Looks like no tags are added yet.
Name | Mastery | Learn | Test | Matching | Spaced | Call with Kai |
|---|
No analytics yet
Send a link to your students to track their progress
104 Terms
Bivariate Correlations
Associations that involve exactly 2 variables
ex: levels of happiness vs. days spent on vacation (quantitative)
Describing Associations between 2 Quantitative Variables
Cohen’s Guidelines for Evaluating Strength of Association (based on r)
r=
.10 (or -.10) = small or weak
.30 (or -.30) = medium or moderate
.50 (or -.50) = large, or strong
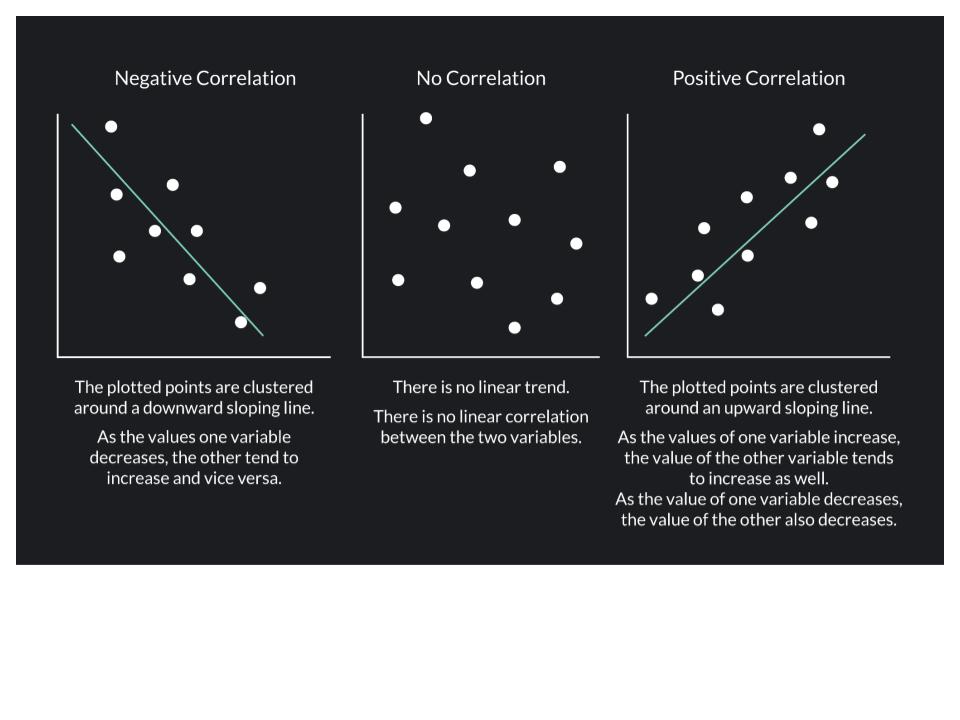
Describe the Correlation
-.10 = a weak negative correlation
Describing Associations with Categorical Data:
Marital status (categorical) is associated with the number of pets (quantitative) people have
Marital Satisfaction (quantitative) and if you met you spouse online or offline (categorical)
Describing Associations with Categorical Data Cont.
mean= arithmetic average
t test= a statistic to test the difference between 2 group averages
Interrogating Association Claims: Construct Validity
How well was each variable measured?
“Trust in social media is linked to heightened susceptibility to COVID 19 conspiracy theories”
Ask about the construct validity of EACH variable
How well was each of the variables measured? - was it self-report (how much do you trust social media), or some other method
Does the measure have good reliability? Internal reliability (Cronbach’s alpha tells us the reliability)
Is it measuring what it's intended to measure? Are they measuring actual susceptibility to conspiracy theories, or one’s awareness?
Interrogating Association Claims: Statistical Validity
How well does the data support the conclusion?
How strong is the relationship?
How reliable is the estimate?
Has it been replicated?
Could outliers be affecting the association?
Is there a restriction of range?
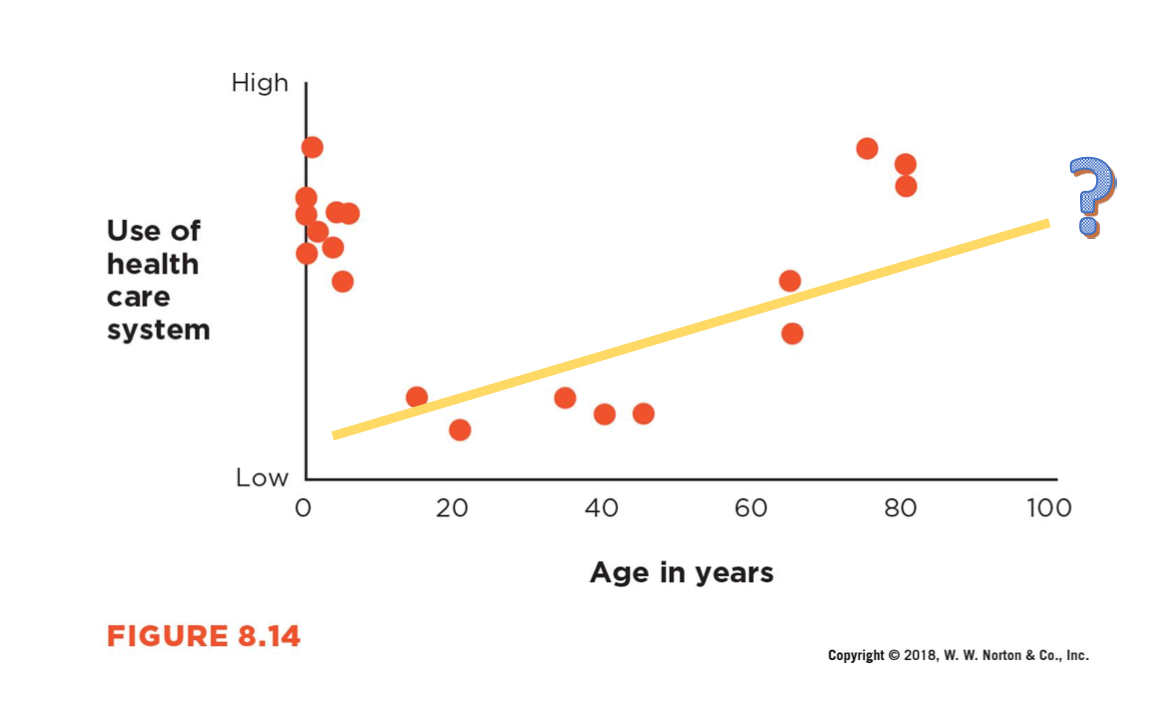
Is the association curvilinear?
Interrogating Association Claims: Interval Validity
Can we make a causal inference from association?
Interrogating Association Claims: External Validity
To whom can the association be generalized?
How Strong is the Relationship?
effect size: describes the strength of an association
Evaluating Effect Size
All else being equal(same sample size, same reliability etc..):
larger effect sizes = more important
Larger Effect Sizes = More Accurate Predictions
Figure A: height at age 18 and height at age 2 (positive correlation)
Figure B: mothers height and son’s adult height (positive correlation but not as strong as Figure A)
More successful at predicting someone’s height as an adult if you know their height at age 2 vs. their mothers height
When everything else is equal, a larger effect size is usually considered more important than a small one. But there are some exceptions…
Clinical study on heart attacks and aspirin:
there is a negative correlation between a heart attack and consumption of aspirin (small effect size): but, the study is still valuable because it is saving lives
Small effect size is not very important unless you are dealing with extreme situations
How Reliable is the Estimate? 2 methods
Confidence Intervals
P-values
Confidence Interval
An interval which is expected to typically contain the parameter being estimated; a range of plausible values for the population mean
often used to predict the mean of a population using a sample of the population
95% Confidence Interval
95% CI= 95% of the CIs would contain the true population mean (if the experiment were repeated many times)
CI cont.
Using samples in studies to make an educated guess about the population of interest
***Main goal of CI is to see where the true population mean lies based on your sample data
***95% CI is a widely used practice → saying that if you were to repeat the study many times, 95% of the range of the CI would include the true population mean
95% CI [.05,.07]
does not contain zero
association has statistical significance
P-value
P-value (probability level): the likelihood that the observed result would have been obtained if the null hypothesis of no real effect were true
We want our p-values as ___ as possible
SMALL
P < .05
p value predicts how likely you would find that result in your sample when it DOESN'T exist in your population (.05% chance that it would be found by chance)
Larger effect size ____ (more/less) likely to be statistically significant
MORE
Small effect size
can be found to be statistically significant!!!
Sample size and statistical significance
With a very large sample (10,000), even a weak correlation (r = .10) between GPA and SAT can be statistically significant.
With a small sample, the same weak correlation (r=.10) is less likely to be significant because each data point has more influence and outliers can distort the results (skew data).
Significance in journal articles…
table in results section
shows means, standard deviations and correlations
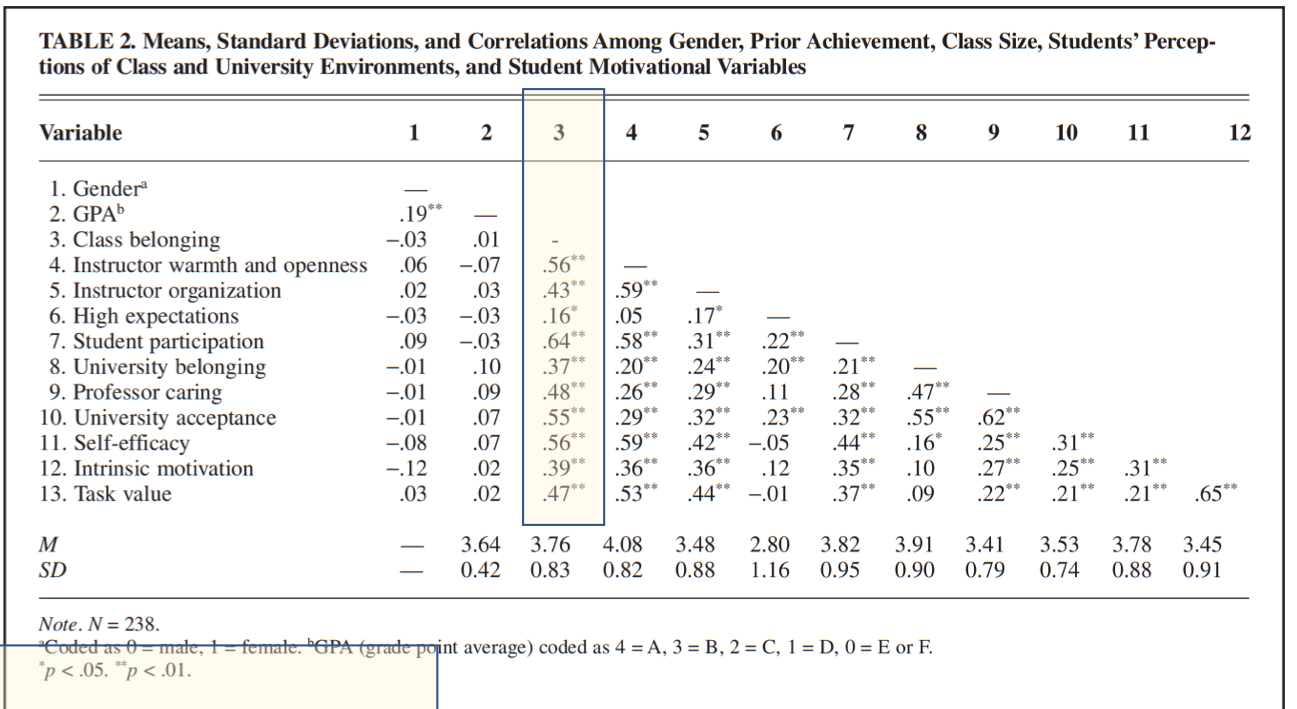
Highlighted
.56= association between class belonging and instructor warmth and openness, p value =.01
Pay attention to * to see what the p-value is (see notes at the bottom of the table)
Likely on exam
other notes:
Apa→ state exact p-value
P-value less than .05 is statistically significant (she might not always put .05 on the exam)
Never say p-value is 0
Outliers
a data point that significantly deviated from other observations within a dataset
small sample size = data MORE influenced by outliers
Outliers Affect Association
Figure A: has an outlier
FIgure B: no outlier
Can influence results since it is a small sample size
Changes the pattern + strength of the correlation
With the outlier it looks like a strong correlation, when outlier is removed the correlation is not as strong
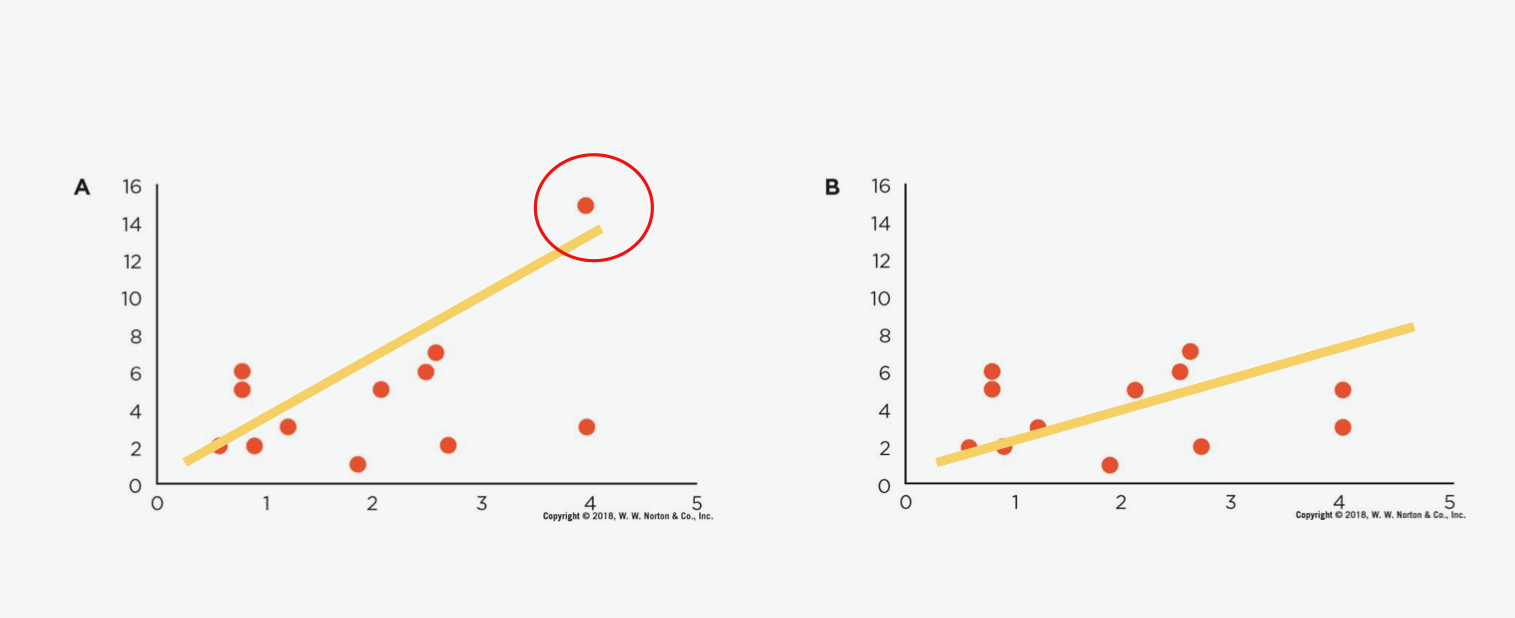
smaller sample size = the outlier has more of an impact!!!!
Calculate the means:
First group: 93.4 (no outlier), 5 scores
Second group: 81.1 (outlier), 6 scores
Third group: 90.29 (outlier), 14 scores
Average without outlier
Second group: 93.4
Third group: 95.69
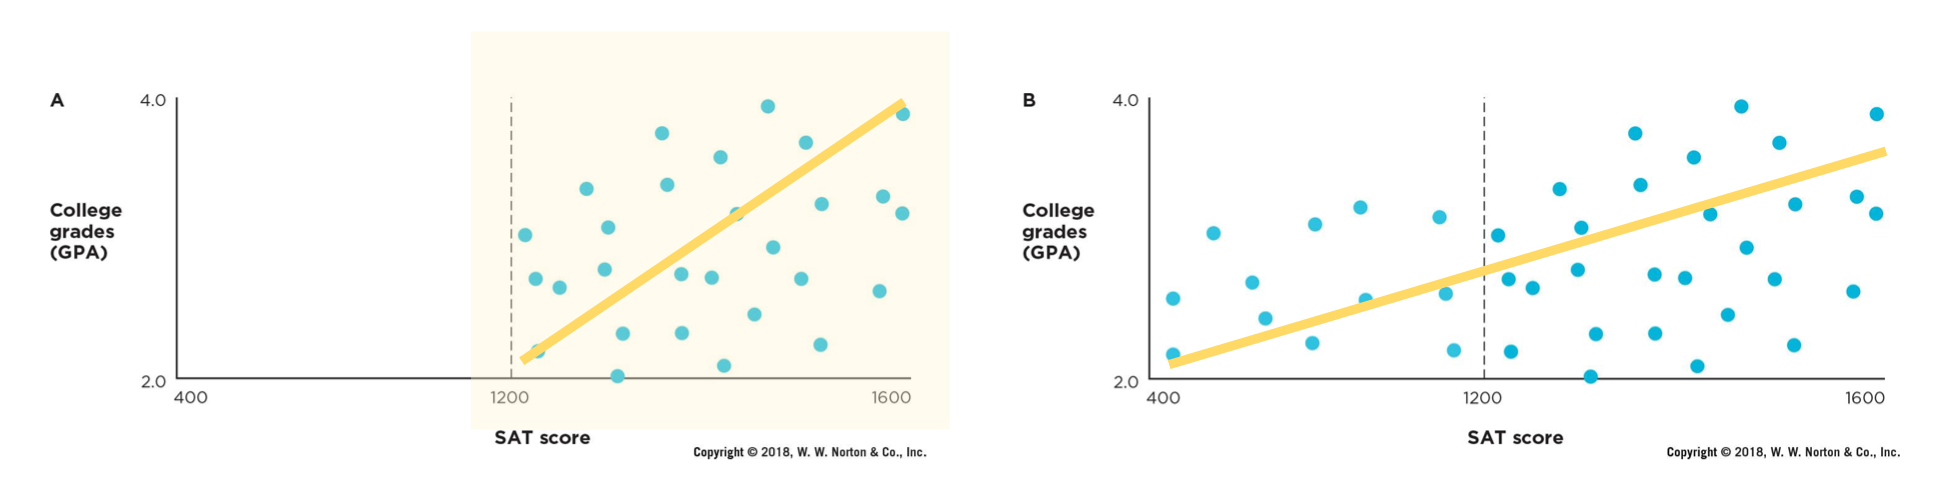
Restriction of Range
issue that occurs when the values collected do not represent the entire possible range for a variable
Restriction of Range Example
SAT score:
Range of 1200-1600 (stronger correlation, but not accurately showing the relationship between the two variables)
vs.
400-1600 (weaker correlation, broader range of scores + more accurately showing the relationship between the 2 variable)
Pearson correlation coefficient is used to measure the strength of a ___ association between 2 variables
LINEAR
Linear vs. Curvilinear Association
curvilinear: a relationship between 2 variables where the association does not follow a straight line
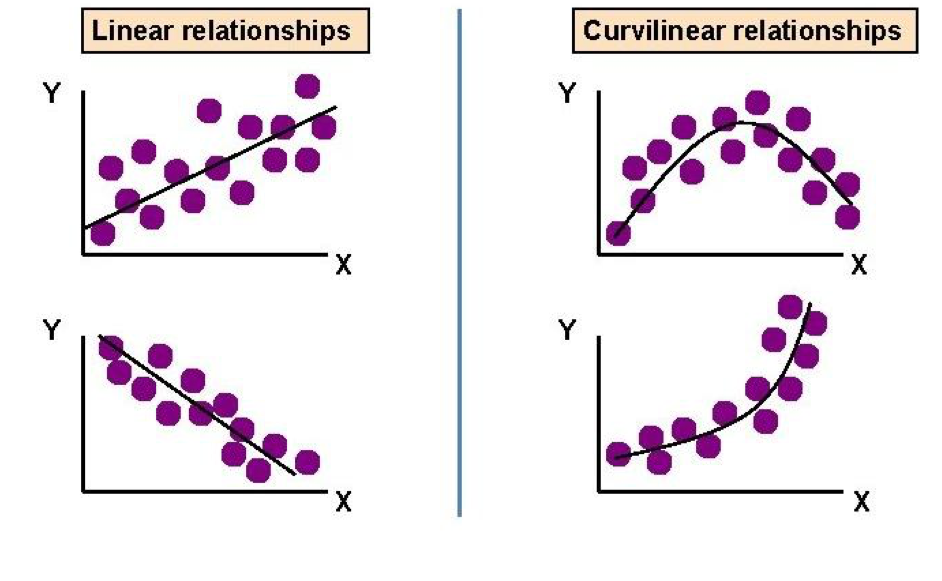
Issues with using Pearson’s r in a curvilinear association
Curvilinear using Pearson’s R= might underestimate the relationship between the variables or show there is no relationship when there is one (meaning it is curvilinear as opposed to linear)
in this example… using Pearsons r will give you a strong positive correlation which does not accurately represent the relationship
Types of Non-Linear relationships
friendliness of a server + customer satisfaction
being nice can cause greater customer satisfaction
being overly friendly can make you uncomfortable
Money + Happiness:
more money= higher levels of happines
BUT, only to a certain point
Applying the three causal criteria:
Applying the three causal criteria:
covariance
temporal precedence
internal validity
Cannot draw causal conclusions from bivariate research (only matches first criteria of covariance )- does not establish causation because it doesn’t rule out other explanations or show which variable comes first.
Covariance
There must be an association between the cause variable (A) and the effect variable (B)
ex: people who put up christmas decorations earlier are happier
Putting up decorations may not lead to happiness, happy people might put the decorations up early
Temporal Precedence
the causal variable (A) must come before the effect variable (B) (directionality problem)
in bivariate studies we do not know what variable comes first
in the christmas light study we do not know if decorations lead to happiness, or happy people put up decorations earlier
Internal Validity
Is there a third variable (C) that is associated with variables A and B independently? (third-variable problem)
if so, we cannot infer causation
other variables affecting the claim that “people who put up christmas decorations early are happier”
spending time with family makes you happier
more free time
more money
the decorations to put up
Identify the third variable: The number of fire hydrants and the number of dogs in a city are positively correlated
dogs pee on them
External Validity
Do the findings generalize to other people, places and times?
Multitasking performance vs. amount of time spent multitasking (External Validity)
Initial study was with a younger sample, replicated with older sample
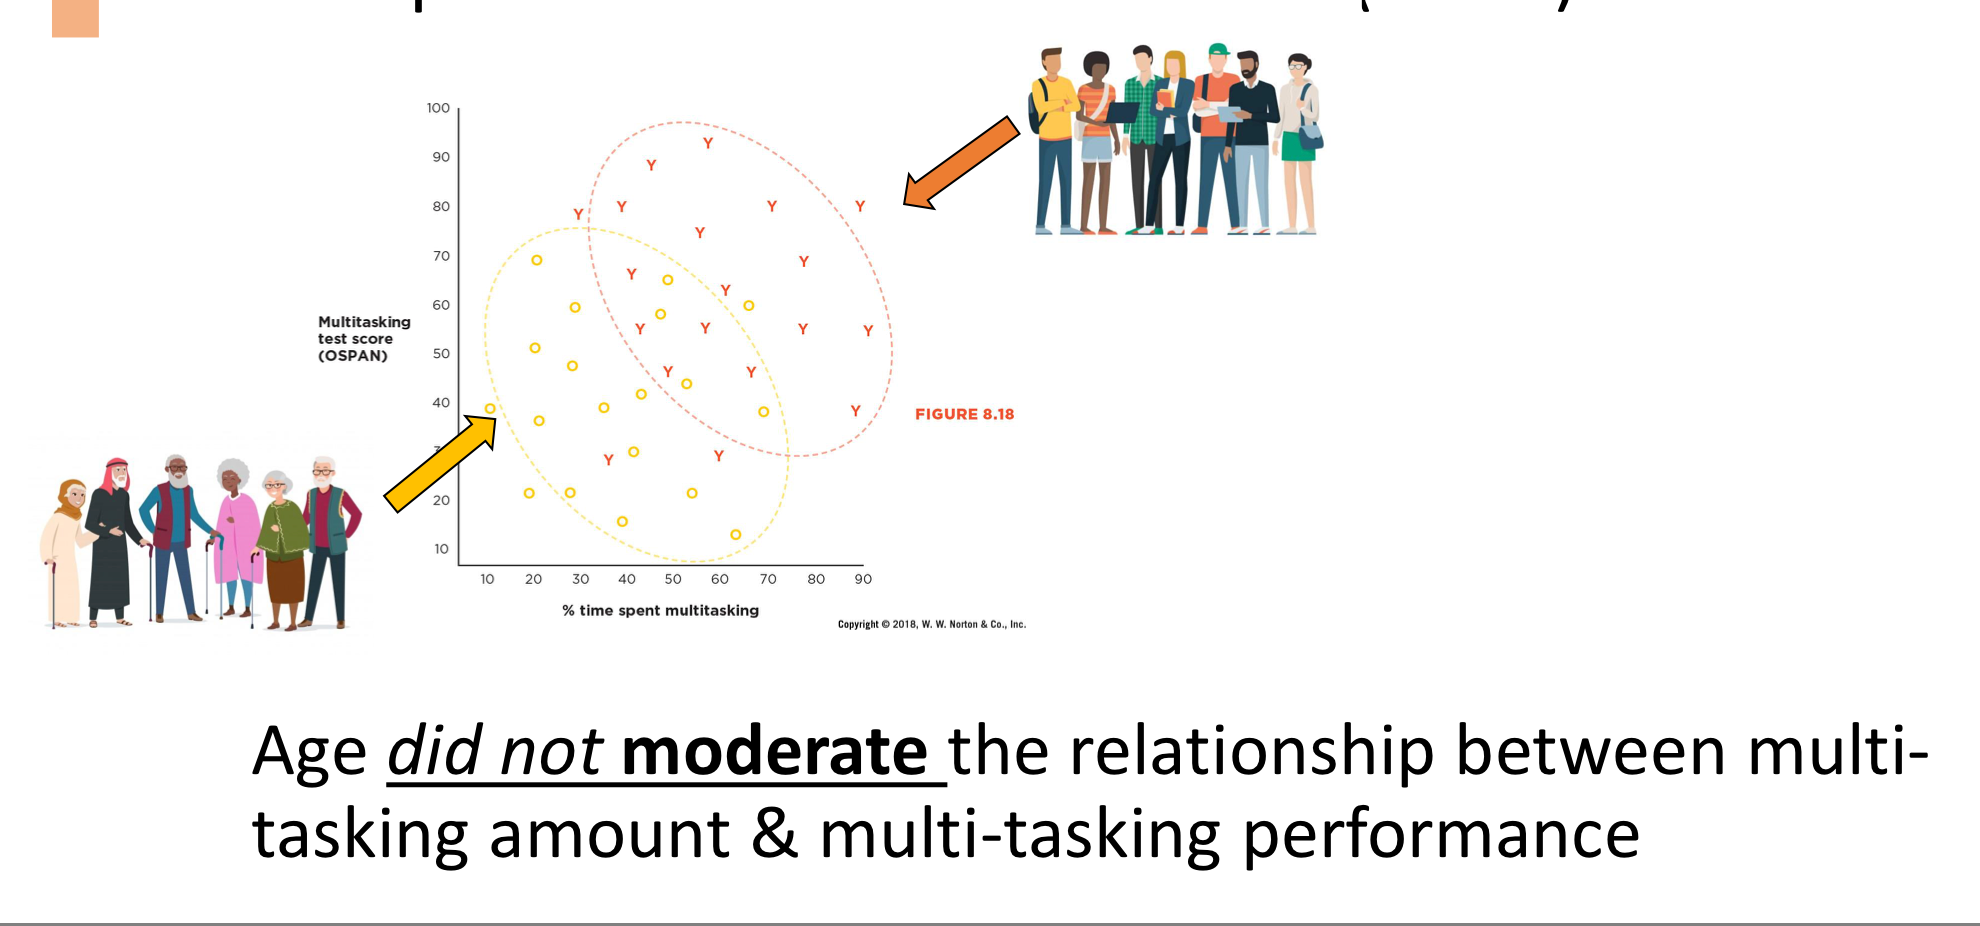
Moderator
A variable that changes the strength and direction fo the relationship
Example:
the relationship between X and Y depends on a third variable. For example, the correlation between study time and GPA might be stronger for highly motivated students and weaker for less motivated students—so motivation is the moderator.
Identify Moderator: Recent research shows that growing up in stressful economic conditions can disrupt brain development, alter behavior and challenge emotions. But for boys the outcome is worse
GENDER
Identify the Moderator Research shows that the number of classes college students take is strongly correlated with higher levels of stress. However. The relationship between the number of classes and stress is weak for upper-level students.
AGE/YEAR IN COLLEGE
RQ: relationship r= -.40, 95% CI [-.14,-.61]
The relationship is negative
The correlation is statistically significant
We can probably rule out that the relationship is zero
The relationship is negative
The correlation is statistically significant
We can probably rule out that the relationship is zero
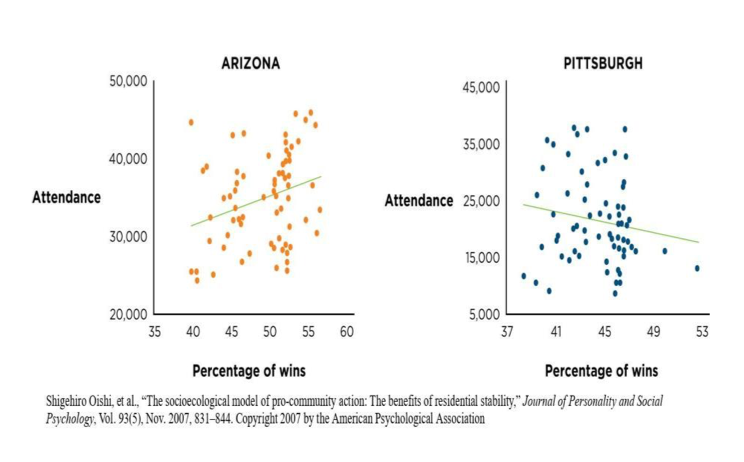
What makes this pattern a moderator?
a. the fact that Arizona has more winning seasons than Pittsburgh
b. the fact that Arizona games attract more fans than Pittsburgh games
c. the fact that the relationship between winning and attendance is stronger in Arizona
a. the fact that Arizona has more winning seasons than Pittsburgh
b. the fact that Arizona games attract more fans than Pittsburgh games
c. the fact that the relationship between winning and attendance is stronger in Arizona
RQ3: Which of the following will probably be plotted as a bar graph rather than a scatterplot?
a. The more conscientious people are, the more likely they get health check ups
b. The level of depression is linked to the amount of chocolate people eat
c. Students in private colleges earn higher GPAs than students in public colleges
c. Students in private colleges earn higher GPAs than students in public colleges
Multivariate Designs
Involve more than two measured variables
longitudinal designs
multiple regression designs
Criteria for Causal Claims
Covariance
Temporal precedence
Internal validity
We can approximate temporal precedence and internal validity
Longitudinal Design
Collecting data from the same group of people over 3 different time periods
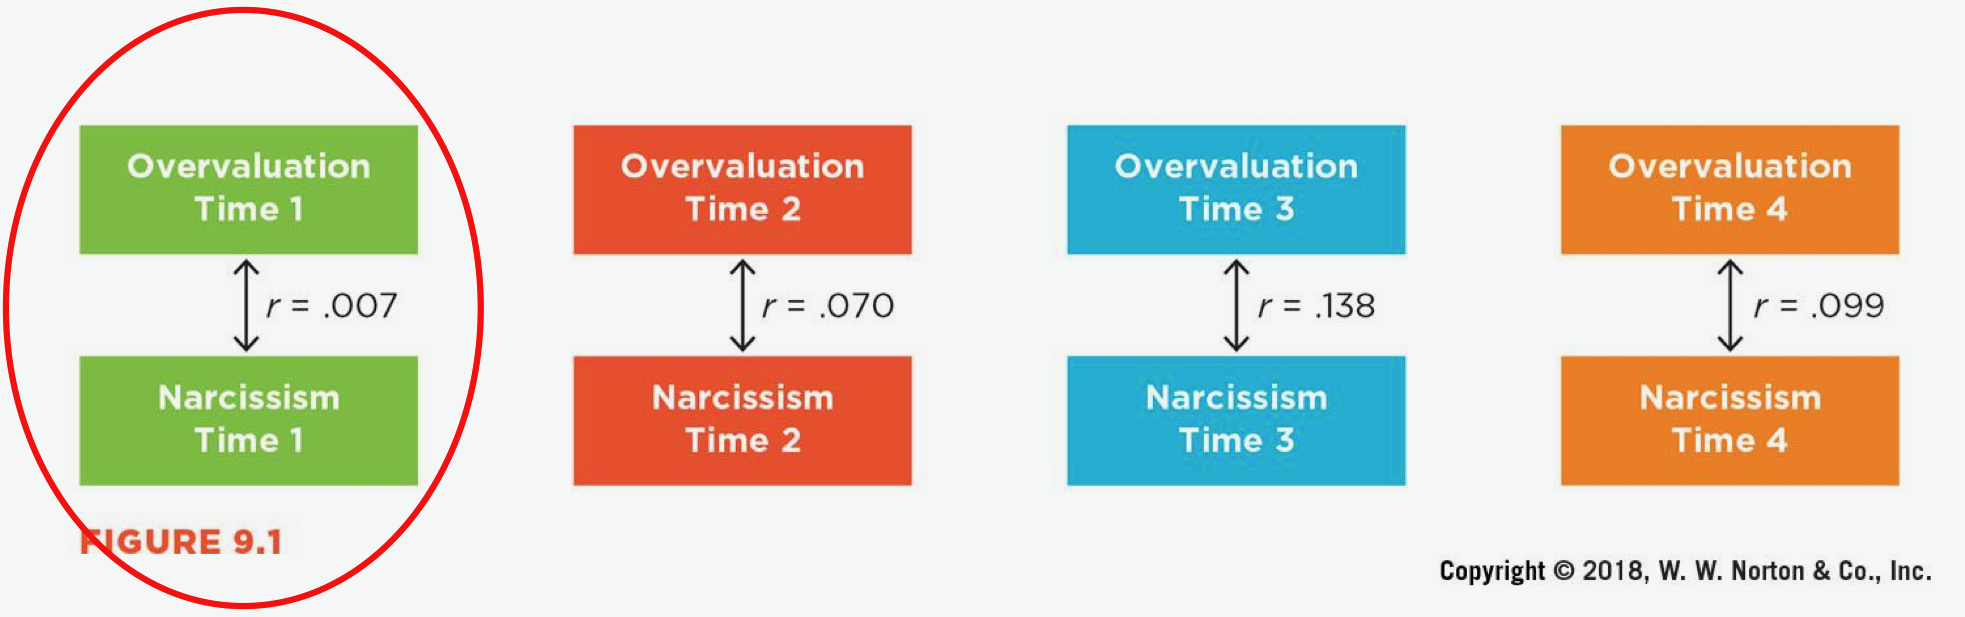
Cross Sectional Correlations
one variable —> other variable at the same “Time” (ex: over-evaluation and narcissism both at Time 1)
CANNOT ESTABLISH TEMPORAL PRECEDENCE
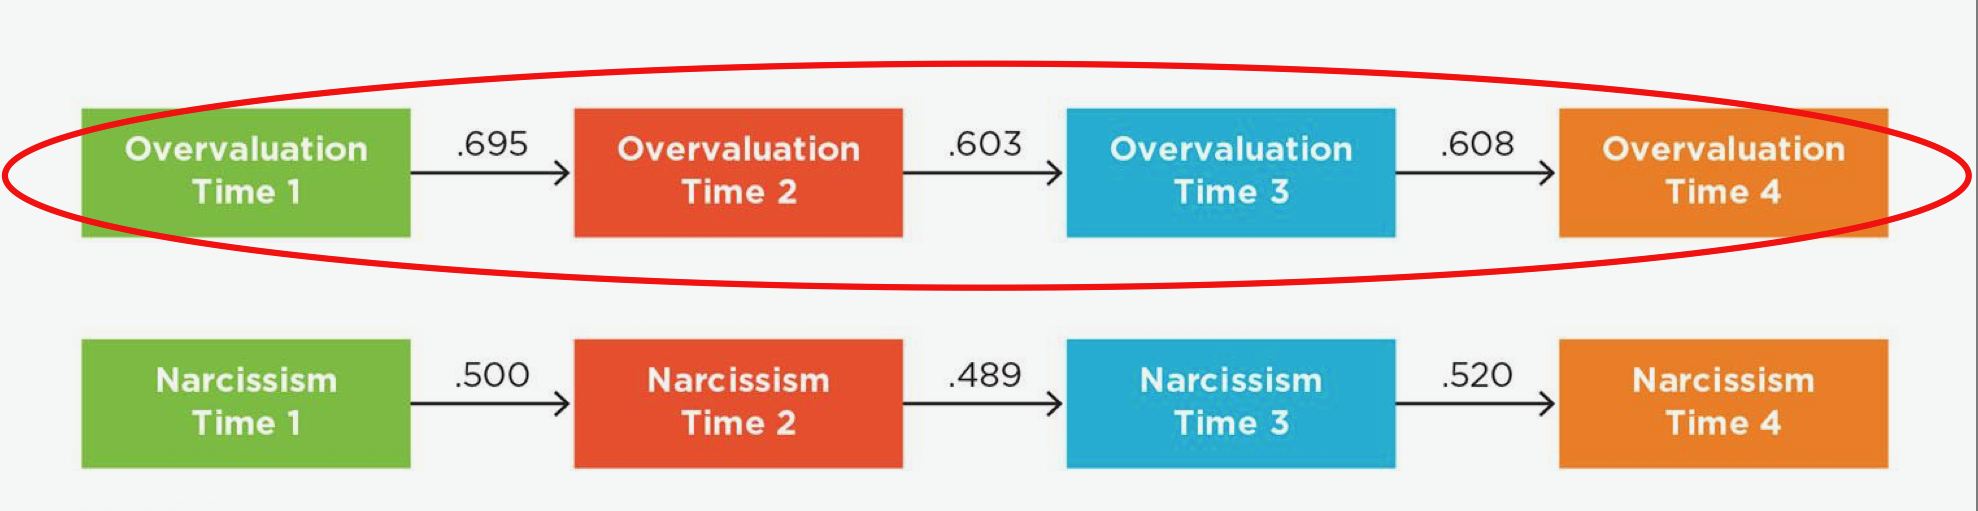
Autocorrelations
Same variable over time (overvaluation at Time 1 —> Time 2 —> Time 3)
CANNOT ESTABLISH TEMPORAL PRECEDENCE
Cross-Lag Correlation
one variable —> another variable later (Overvaluation Time 1 —> Narcissism Time 2)
CLOSER TO ESTABLISHING TEMPORAL PRECEDENCE
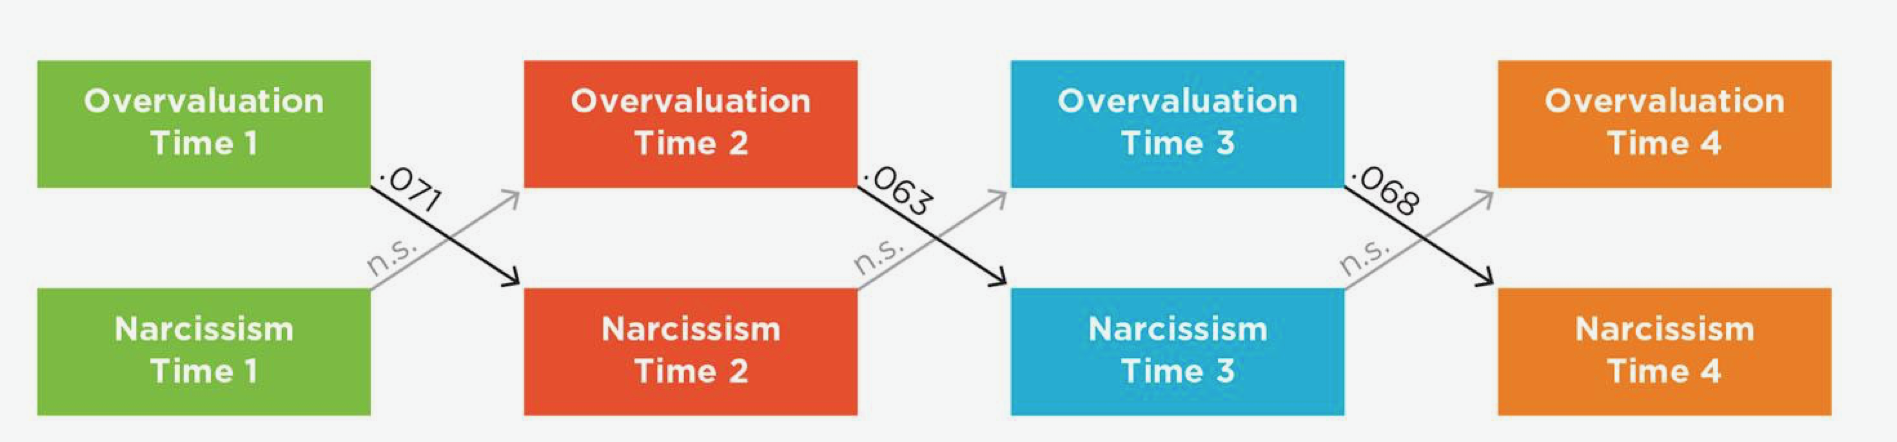
CANNOT MAKE CAUSAL CLAIM
We are not measuring other variables so we cannot be 100% certain overvaluation is responsible for the changes in narcissism (can only be done when conducting an experiment)
What if the Cross-lag of Narcissism Time 1 → Overvaluation Time 2 AND Overvaluation Time 1 —> Narcissism Time 2 was significant?
There would be a feedback loop between the two variables
Overvaluation and narcissism would be enforcing each other
Longitudinal Studies and 3 Criteria for Causation:
Longitudinal designs can provide SOME evidence for causation by fulfilling 3 criteria
Covariance
Temporal precedence
Internal validity
Why not just do an experiment?
In many cases participants cannot be randomly assigned to a variable
Can be unethical
How can we rule out third variables?
with MULTIPLE REGRESSION ANALYSES
Multiple Regression
A statistical method that examines the relationship between 1IV and multiple DVs
allows researchers to:
asses unique contribution of each predictor
WHILE… controlling for others
controls for confounding variables
Confounding vs. Moderating Variable
Both third variable
Confounding (threaten internal validity): external variables that influence both the study variables
makes it hard to understand the true relationship
Moderating: included intentionally because we want to see if it affects the relationship BETWEEN study variables
Possible variables for exposure to sexxual TV content being associated with greater risk of pregnancy
lack of adult supervision
age
“Control for” third variables
“Control for”: to account for other variables effects to isolate the unique impact of the main variable of interest on the outcome
for TV/Pregnancy Risk ex:
look at relationship with a certain age and compare it to others
Regression Results Indicate if a ____ affects the relationship
THIRD VARIABLE
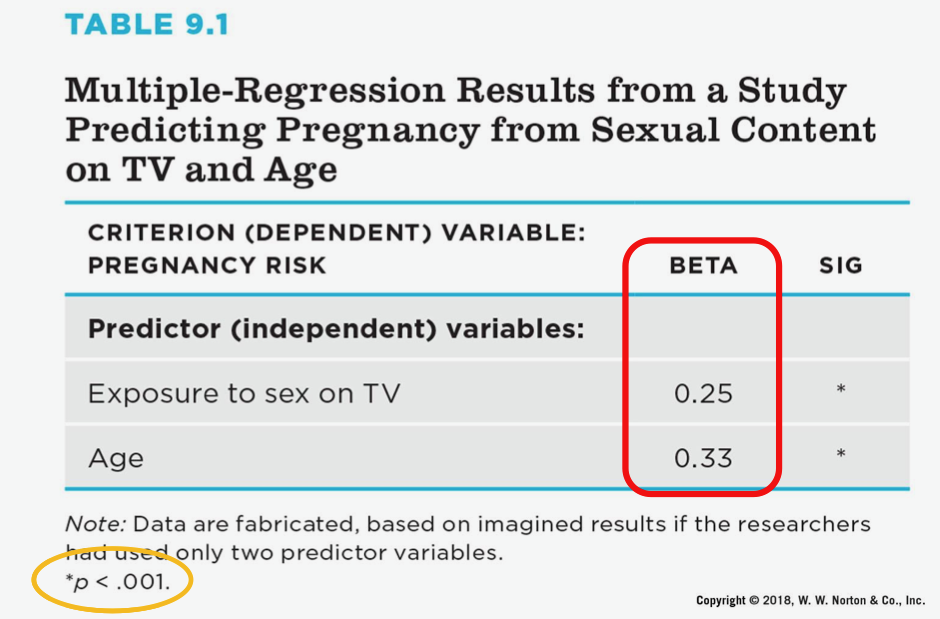
Regression Results
Criterion variables (pregnancy risk)
Predictor variable (sexual TV content)
Use beta to test for third variables
Beta
Represents the standardized coefficient in a regression analysis; it indicated the direction and strength of the relationship
Using Beta to test for Third Variables
Interpreting beta (both p-value and CI are used to determine statistical significance)
can use beta to see what variable is the strongest predictor
Using Beta to test for Third Variables: P-Value
Using Beta to test for Third Variables: Confidence Interval
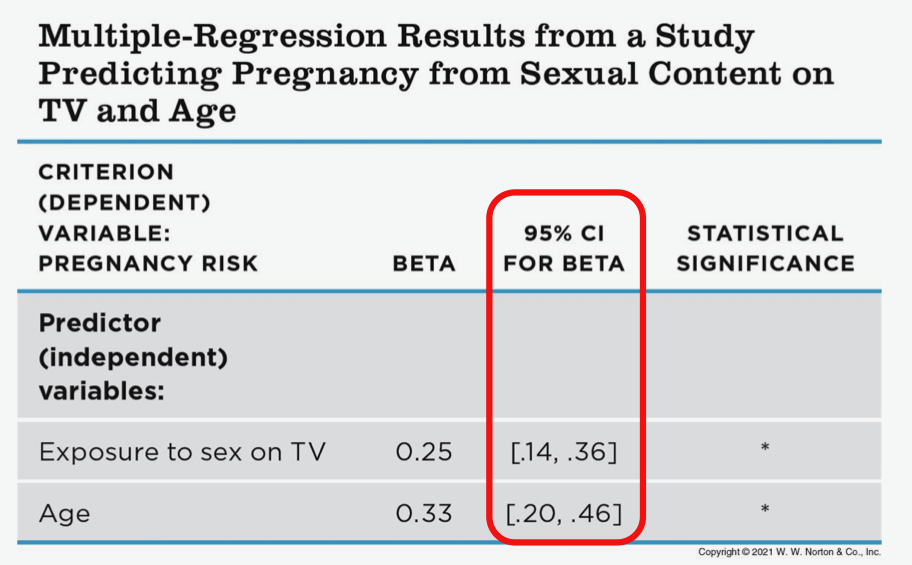
Can only compare beta strengths within a ___ regression table
SINGLE
ex:
on a smaller table —> age is a stronger predictor
on a bigger table —> exposure to sex on TV is a stronger predictor
Using Beta to test for a third variable
what if beta is not significant?
ex:
Predictor variable: family meal frequency
Criterion variable: academic success
Describing the Nonsignificant Beta of -0.01
the relationship between family meal frequency and child academic success…
is not significant when controlling for parental involvement
can be explained by the third variable of parental involvement
goes away when parental involvement is held constant
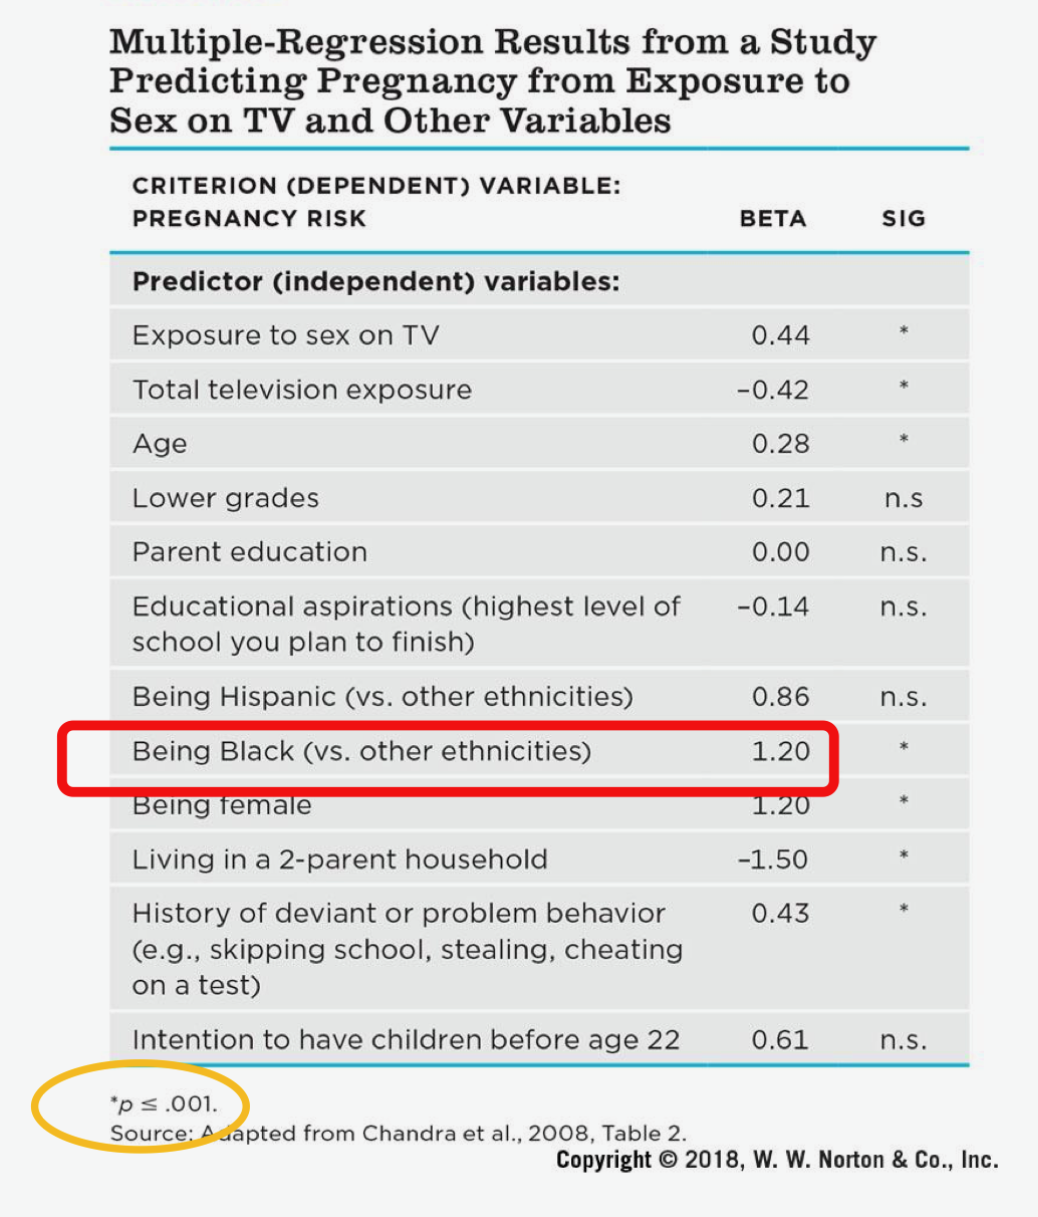
Beta of being black vs. other ethnicities, beta = 1.20 and p <.001 so it is significant
Being a black teen is highly correlated with pregnancy risk even when the other variables are controlled for

Cognitive skills at 54 months, beta = -.05
What does this mean?
Cognitive skills at 54 months, beta = -.05
What does this mean?
Better cognitive skills at 54 months is not associated with political conservatism at age 18 when controlling for gender, ethnicity, SES and parenting qualities
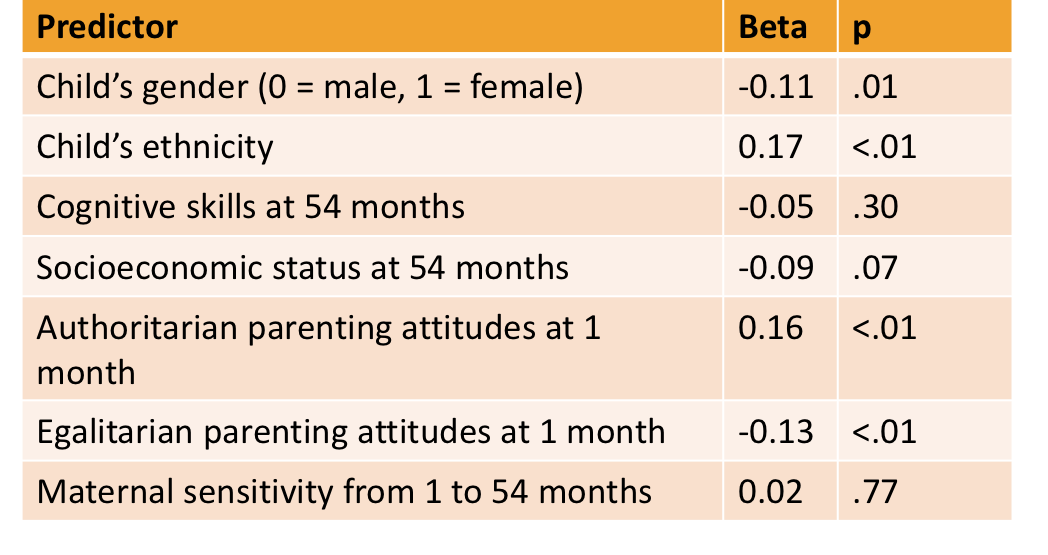
Egalitarian parenting, beta = -.13
What does this mean?
Egalitarian parenting, beta = -.13
What does this mean?
Egalitarian parenting predicts lower levels of political conservatism at age 18 when controlling for gender, ethnicity SES, authoritarian parenting and maternal sensitivity
When interpreting Regression tables you must include:
ALL the other variables you are controlling for
Cross-Sectional Correlations
CANNOT establish temporal precedence
Autocorrelations
CANNOT establish temporal precedence
Cross-Lag Correlations
CLOSER to establishing temporal precedence
Another Multivariate EX:
Variables:
Impostorism
Sense of Belonging
Data collection time points:
January 2023
March 2023
May 2023
Cross-sectional correlations: Impostorism Time 1 → Belonging Time 1
Autocorrelations: same variable over time
Cross-lag correlation: one variable → other variable later
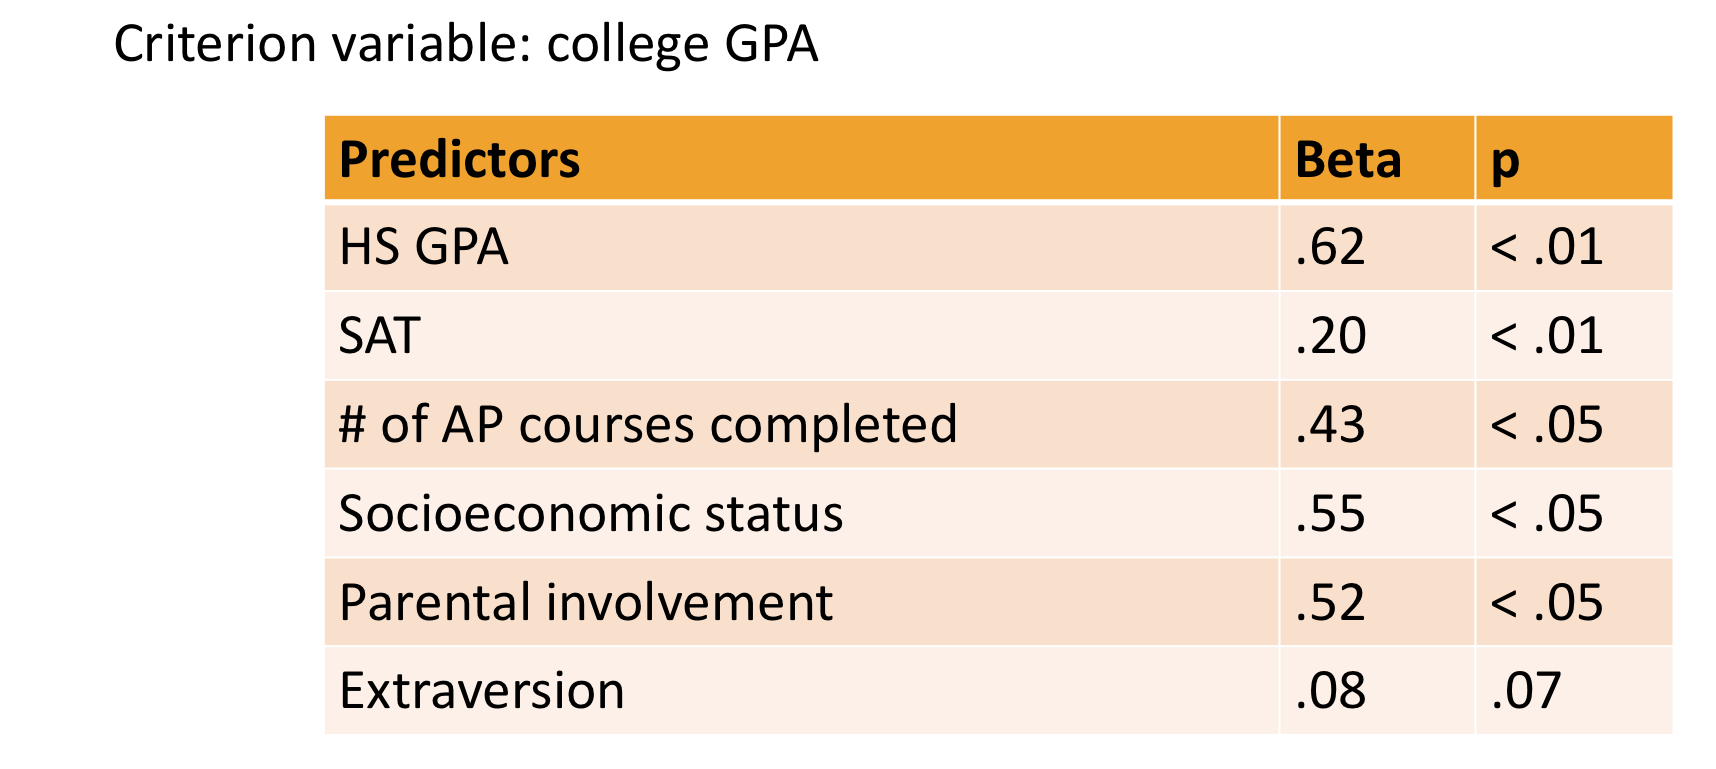
Why do we have so many predictors?
To control for as many variables that could potentially explain or predict college GPA
Hypothesis: Extraversion predicts college GPA
It DOES NOT:
P is more than .05
All the other variables are predictive of college gpa (p is less than .05)
You can only compare betas within a single table
Pearson’s r
bivariate
does not control other variables
correlation
simple association
no multiple predictors can be included
Beta
multivariate
controls for other variables
regression
unique predictive effect
multiple predictors CAN be included
How to look for regression in Popular Press Articles
“Controlled for”
“Taking into account”
“Adjusting for”
“Considering”
Regression ______ causation
DOES NOT ESTABLISH:
Multiple regression is not a foolproof way to rule out all kinds of third variables
Predicting pregnancy on exposure to sex on tv example
Can be other variables the researchers did not include!!!!!
Getting at Causality with Pattern and Parsimony
Look for the same pattern or results in multiple studies !!! (can be more confident in our findings)
We want simple explanations
Pattern + Parsimony
The longer a person has smoked cigarettes, the greater at the chances of getting cancer (parsimony)
People who stop smoking have lower cancer rates than people who continue smoking
Smokers cancers tend to be in the lungs and of a particular type
Smokers who use filtered cigarettes have a somewhat lower rate of cancer than smokers of unfiltered cigarettes
People who live with smokers would have higher rates of cancer too because of their passive exposure to the same chemicals
Why correlational study instead of an experiement?
some variables cannot be assigned
it can be unethical
Issue with Pattern + Parsimony in the Press
Journalists do not always fairly represent pattern and parsimony
When journalists report only one study at a time, they are selectively presenting only part of the scientific process
Journalists want to write a story to capture people’s attention
Mediators
variables that explain the process of mechanism through which an independent predictor/variable influences a dependent/criterion variable
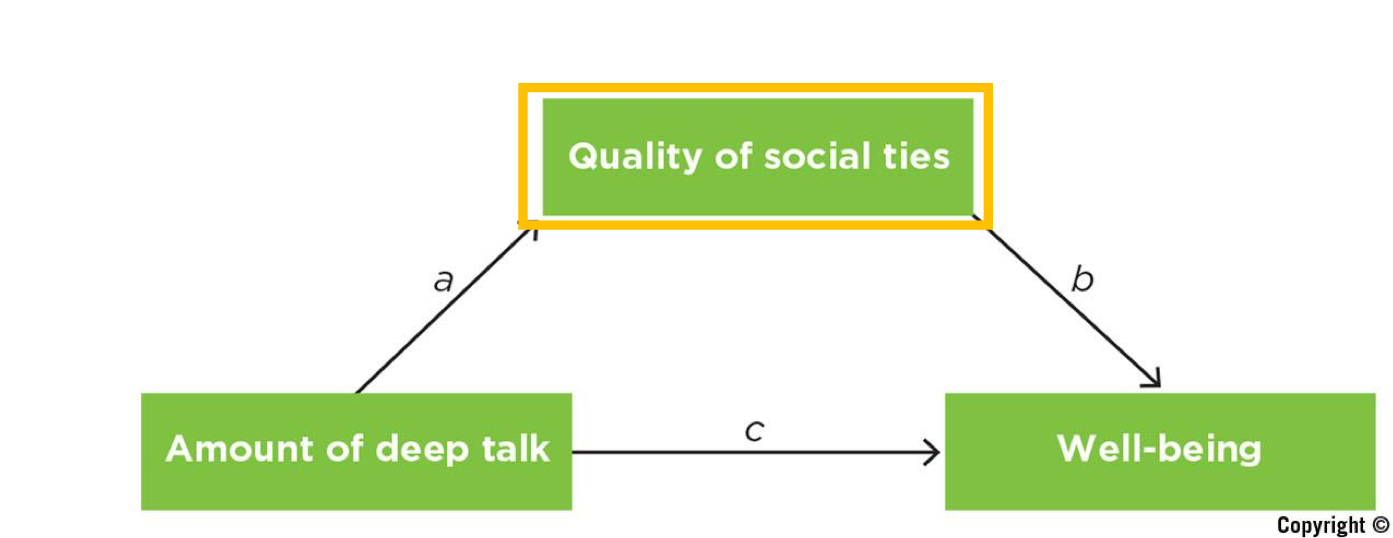
Mediator Ex:
Quality of social ties explains why or how the amount of deep talk is linked to well being
Another Mediator Ex
Studying → Exam performance
Independent variable (IV): Hours spent studying
Mediator: Understanding of the material
Dependent variable (DV): Exam score
Explanation:
Studying more → increases understanding → which leads to better exam performance
So, understanding explains how or why studying improves exam scores.
Mediators vs. Third Variables
Similarities:
Both involve multivariate research designs
Both can be detected using multiple regression
Differences:
Third variables are external to the bivariate correlation (problematic)
Mediators are internal to the causal variable (not problematic)
Mediators vs. Moderators
Mediator : WHY or HOW (how/why something happens)
Moderators: FOR WHOM or WHEN (true for everyone/not or a certain context)
Multivariate Designs and the 4 Validities
Internal validity
Construct validity: do variables measure what they are supposed to measure?
External validity: can findings be generalized to another population/group?
Statistical validity: p values and CI to see if findings are significant, beta for regression and r for correlation
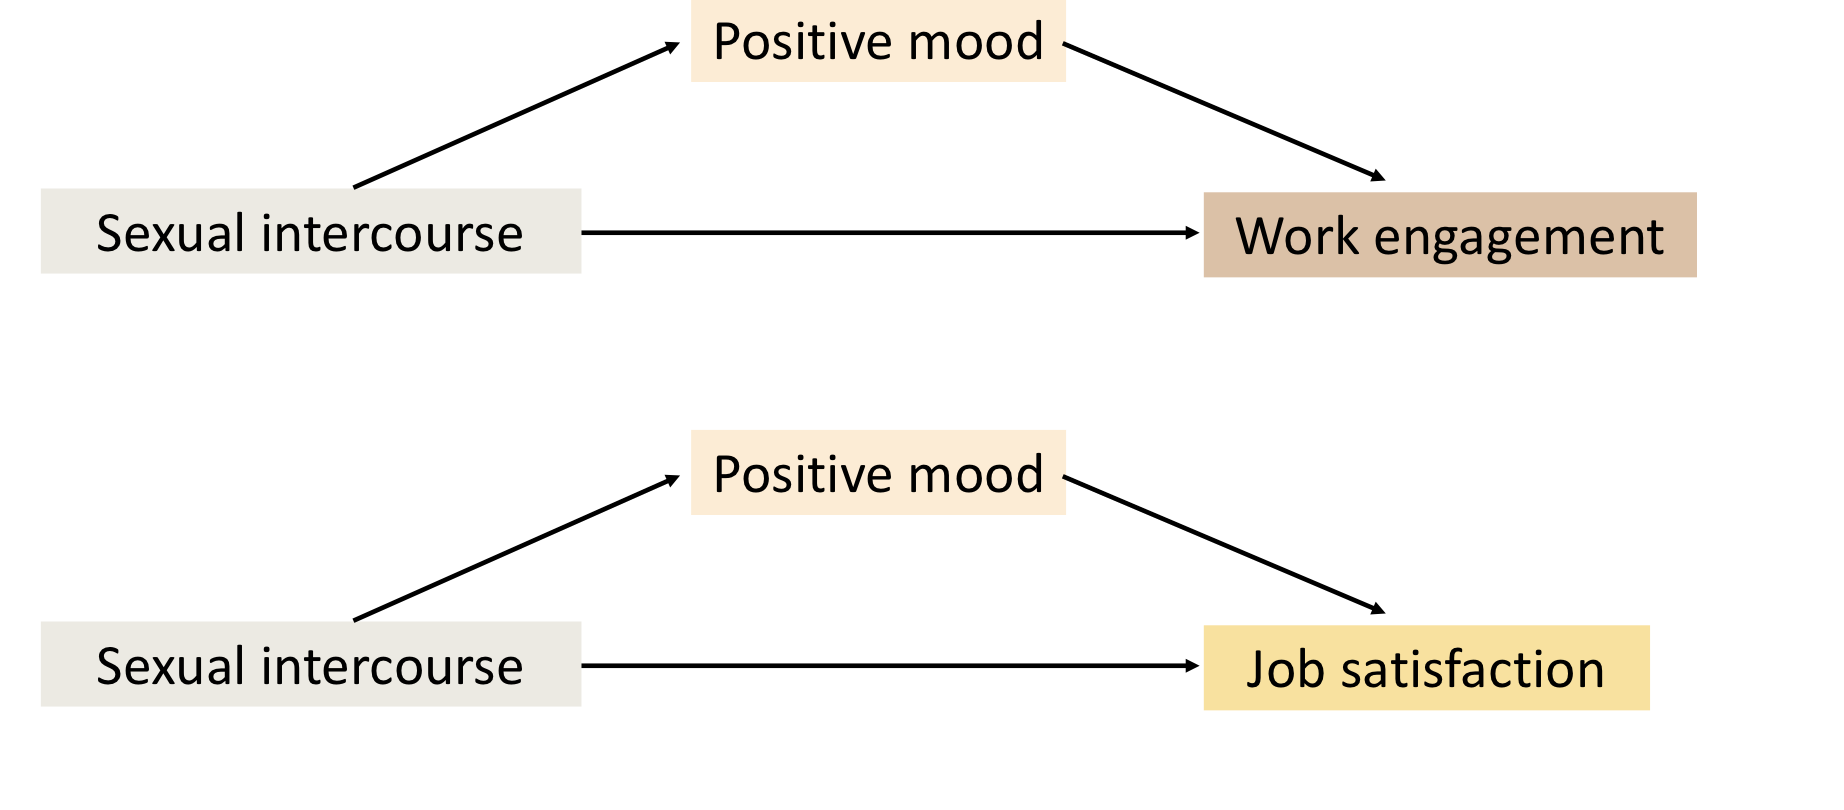
Claim 1: “Active sex life may lead to improved job satisfaction and engagement in work”
To understand the impact of sex on work, the researchers followed 159 married employees over the course of 2 weeks, asking them to complete two brief surveys each day. They found the employees who engaged in sex reported more positive moods the next day, and the elevated mood levels in the morning led to more sustained work engagement and job satisfaction throughout the workday
Claim 2: “people with higher incomes spent less time socializing overall”
“People in households with higher incomes spent significantly less time with relatives and neighbors and significantly more time with friends”
Multiple Regression study
controlled for: (to isolate the effect of money on relationships)
age
race
gender
marital status
household size
city size
hours worked
Claim 3: “amount of TV people watched in their your-adult years was linked to lower cognitive abilities in middle age”
Longitudinal Study
Criterion:
3 cognitive tests
Predictor variables:
Amount of TV
Age
Race
Education
Alcohol use
BMI
1. Why aren’t simple bivariate correlations enough to establish causation?
Simple bivariate correlations only show that two variables are related, not that one causes the other. There could be a third variable influencing both, or the direction of causation could be reversed. Because of this, correlations alone cannot establish cause-and-effect relationships.