lecture 17 -- effect size, power, and confidence intervals
1/11
There's no tags or description
Looks like no tags are added yet.
Name | Mastery | Learn | Test | Matching | Spaced | Call with Kai |
|---|
No analytics yet
Send a link to your students to track their progress
12 Terms
p-value and what does it represent?
The probability of rejecting the null when it is true
Level of risk, generally 5%
P = Probability
P-value, alpha
p < 0.05 is saying that you are accepting a 5% risk in committing a type I error
stat sign of P
= probability
level of risk of committing Type I error
probability that your results would occur by chance if null were true
innocent until innocence is disproven
no such thing as “more significant”
just that your result is less likely due to chance
what affects significance?
variability (SD, SEM)
sample size
difference between sample means
how much variability is caused by your manipulation?
is it a real difference?
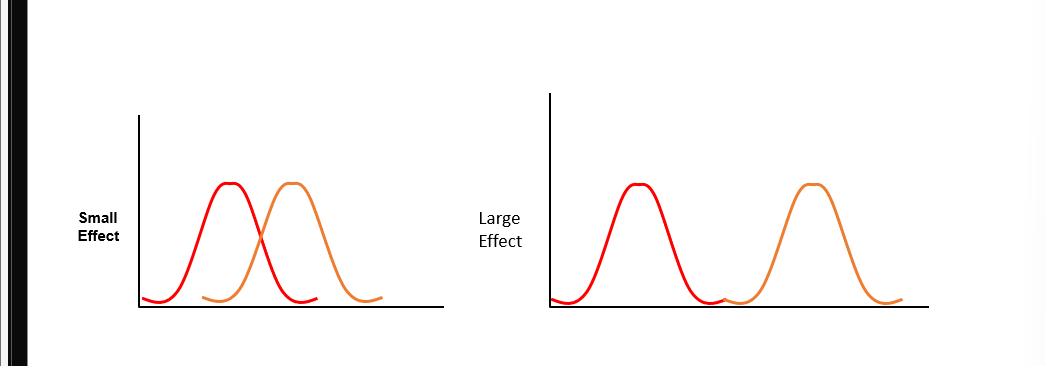
effect size — Cohen’s d
give more info ab the p-value
takes all variability together
measures how big the effect is relative to variability that is not affected by N
effect size
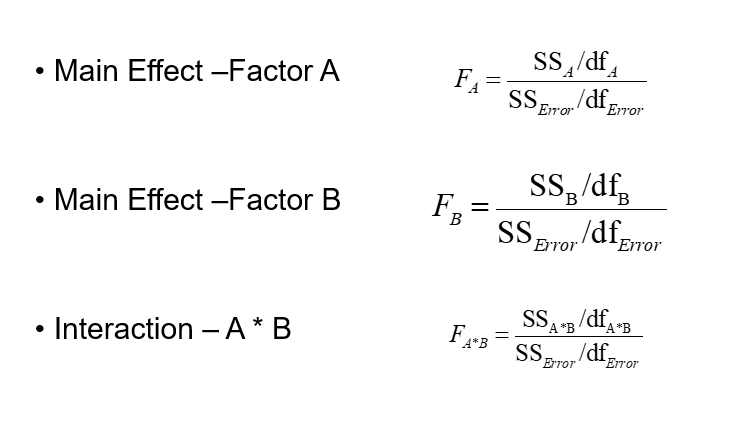
factorial ANOVA equations
effect size — eta squared
used for complex experimental designs
total variability - unexplained variability
/
total variability
n² = SS treatment/SS total
how much var is due to your mani
0.25 means that 25% of the total variability was due to the treatment
effect size - cohen’s d and eta-squared
Cohen’s d
an inferential statistic for measuring the standardized difference between two means
d² = 0.54 means that the avg data point in the experimental group is 50% dif from the avg data point in the control group
eta-squared
an inferential statistic for measuring effect size with an ANOVA
n² = 0.25 means that 25% of total variability is related to our treatment
power — avoiding type II error
concluding there is not an effect when there is
beta risk
power is affected by
sample size
larger sample = more power
effect size
the larger the effect, the smaller sample you need to find it
beta risk
cohen though that making a type I error was 4x more serious than a type II error
so 20%
power is inversely related (1-beta)
so 80%
confidence intervals
estimates a range of values that include the unknown population mean
depends on, and compliments, your alpha level
alpha = 0.05, conf int = 95%
alpha = 0.01, conf int = 99%
you can be 95% confident that the range of values contains the true population mean
why do we care?
P-values simply compare our result to the null hypothesis
only tell us if it is likely an effect exists or not in the pop
effect size gives up a measure of how big an effect is
power estimates the # of participants we need to fin that effect
confidence intervals provide an estimate of the true population value in understandable terms