UVA Psych 2005 Research Methods and Data Analysis I
1/185
There's no tags or description
Looks like no tags are added yet.
Name | Mastery | Learn | Test | Matching | Spaced | Call with Kai |
|---|
No analytics yet
Send a link to your students to track their progress
186 Terms
Statistics
branch of mathematics that focuses on the organization, analysis, and interpretation of a group of numbers
Descriptive Statistics
procedures for summarizing a group of scores or otherwise making them more understandable
Inferential Statistics
procedures for drawing conclusions based on the scores collected in a research study but going beyond them
Variable
characteristic that can have different values
Values
possible number or category that a score can have
Score
particular person's value on a variable
Numeric variable
variable whose values are numbers
Equal-interval variable
variable in which the numbers stand for approximately equal amounts of what is being measured
Ratio Scale
an equal-interval variable is measured on a ratio scale if it has an absolute zero point, meaning that the value of zero on the variable indicates a complete absence of the variable (distance, time, weight)
Rank-Order Variable
numeric variable in which the values are ranks, such as class standing or place finished in a race
Nominal Variable
variable with values that are categories (names rather than #s)
Levels of Measurement
types of underlying numerical information provided by a measure, such as equal-interval, rank-order, and nominal
Discrete Variable
variable that has specific values and that cannot have values between these specific values (# of times you went to the dentist)
Continuous Variable
variable for which, in theory, there are an infinite number of values between any two values (age, height, weight, time)
Frequency table
ordered listing of number of individuals having each of the different values for a particular variable
Interval
range of values in a grouped frequency table that are grouped together
Grouped Frequency Table
frequency table in which the number of individuals (frequency) is given for each interval of values
Histogram
barlike graph of a frequency distribution in which the values are plotted along the horizontal axis and the height of each bar is the frequency of that value; the bars are usually placed next to each other without spaces, giving the appearance of a city skyline
Frequency Distribution
pattern of frequencies over the various values; what a frequency table, histogram, or frequency polygon describes
Unimodal Distribution
frequency distribution with one value clearly having a larger frequency than any other
Bimodal Distribution
frequency distribution with two approximately equal frequencies, each clearly larger than any of the others
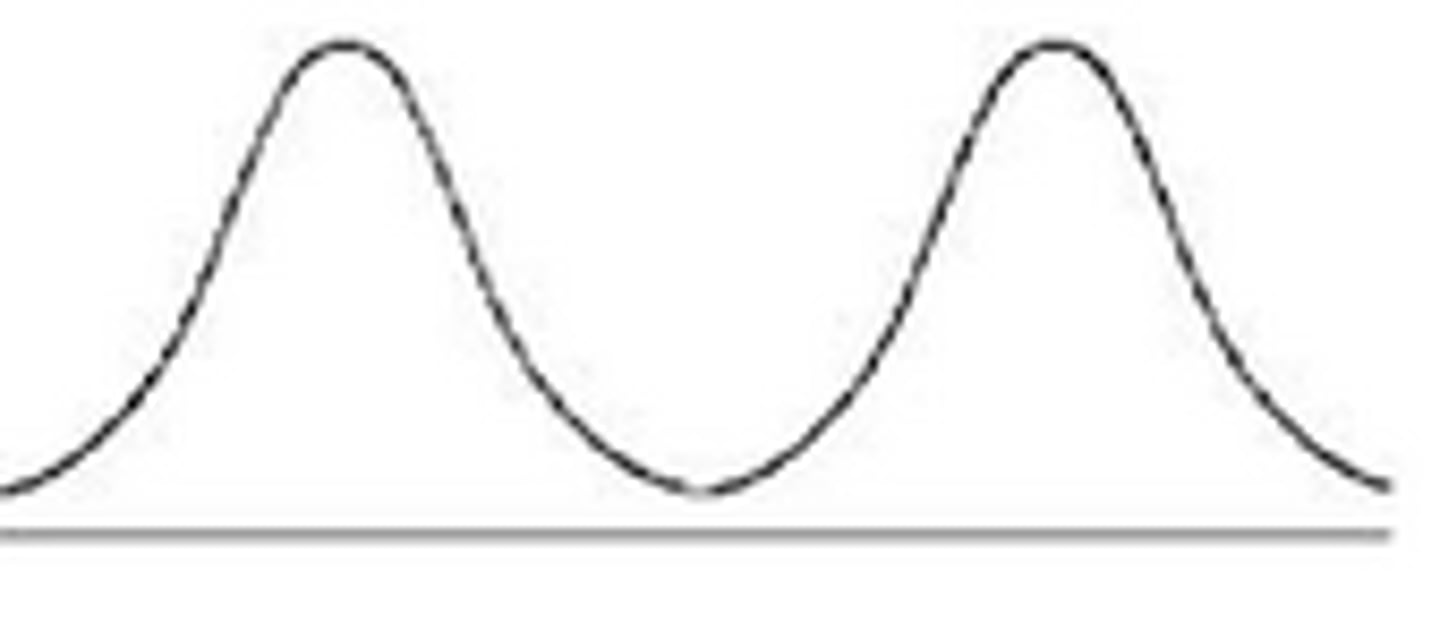
Multimodal Distribution
frequency distribution with two or more high frequencies separated by a lower frequency; a bimodal distribution is the special case of two high frequencies

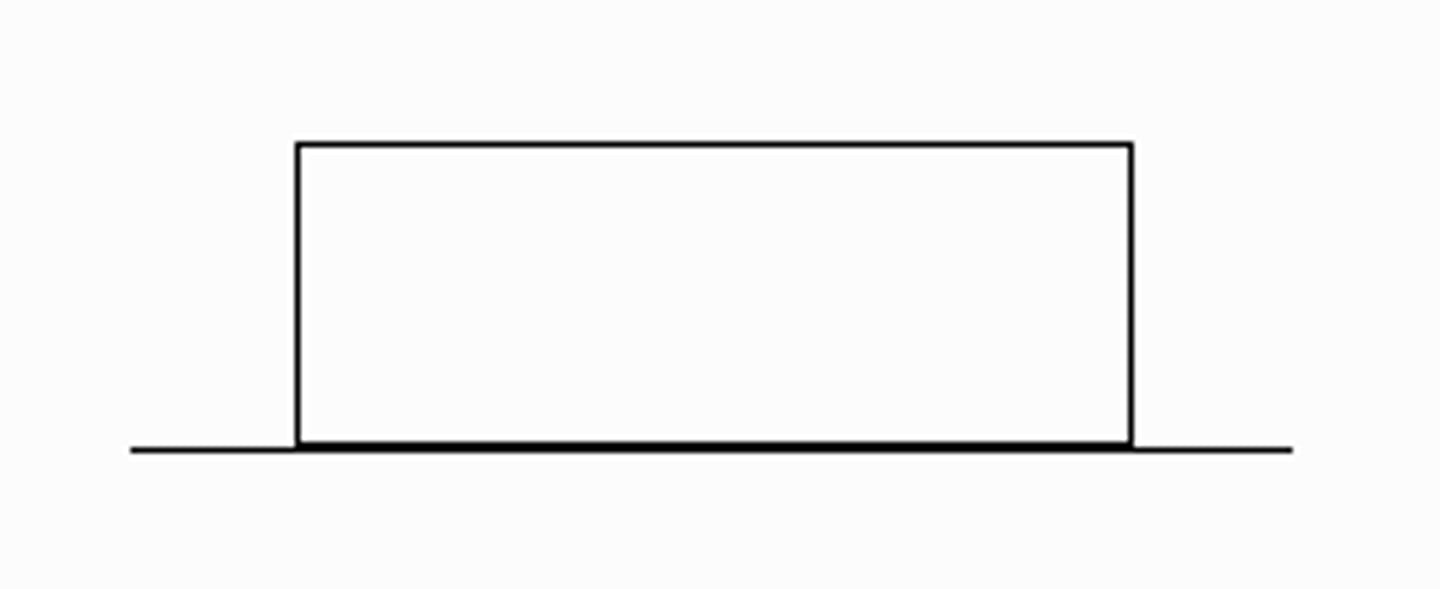
Rectangular Distribution
frequency distribution in which all values have approximately the same frequency
Symmetrical Distribution
distribution in which the pattern of frequencies on the left and right side are mirror images of each other
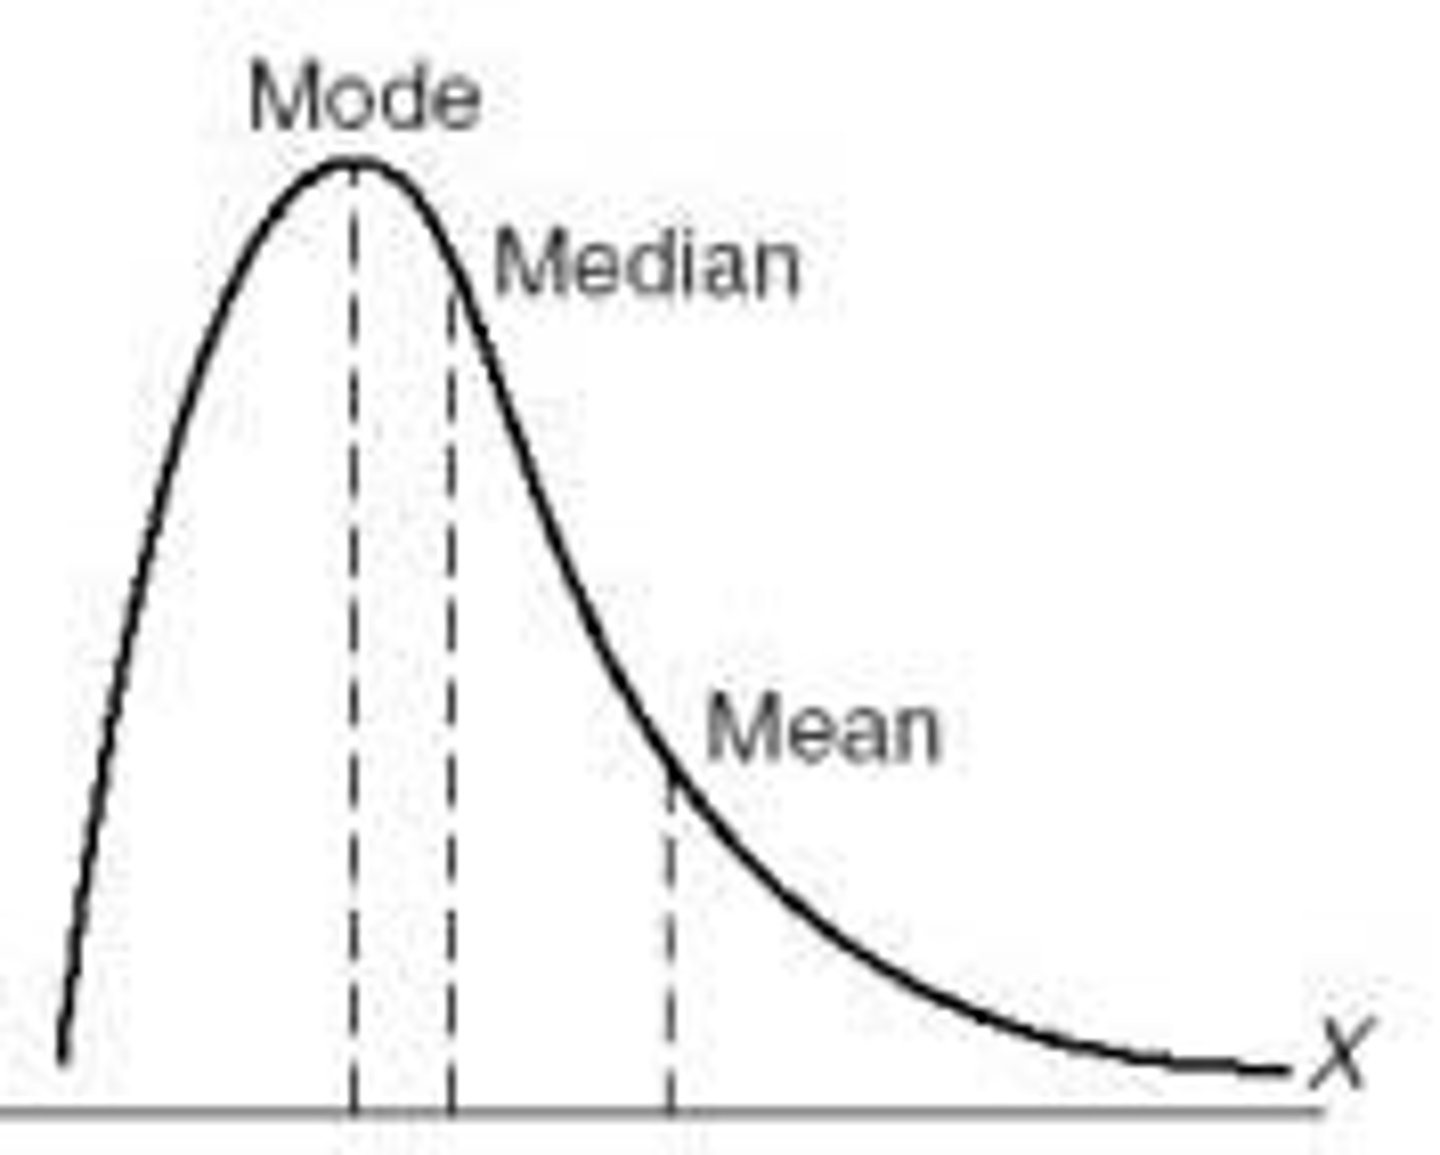
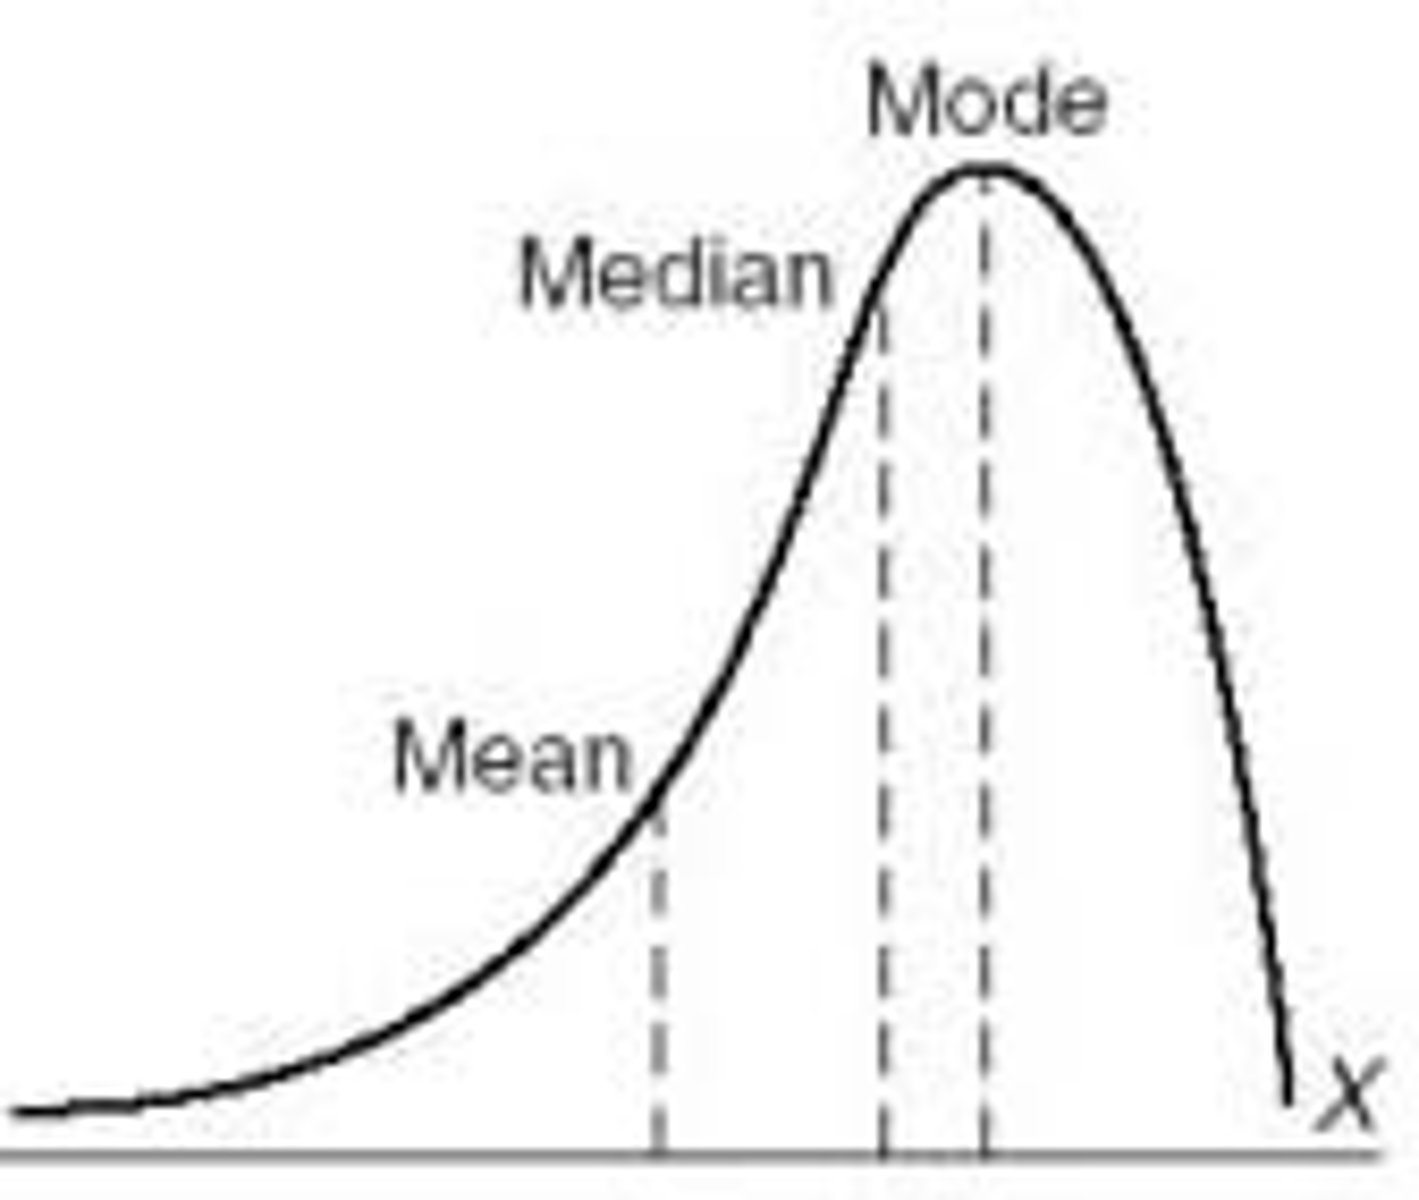
Skewed Distribution
distribution in which the scores pile up on one side of the middle and are spread out on the other side; distribution that is not symmetrical
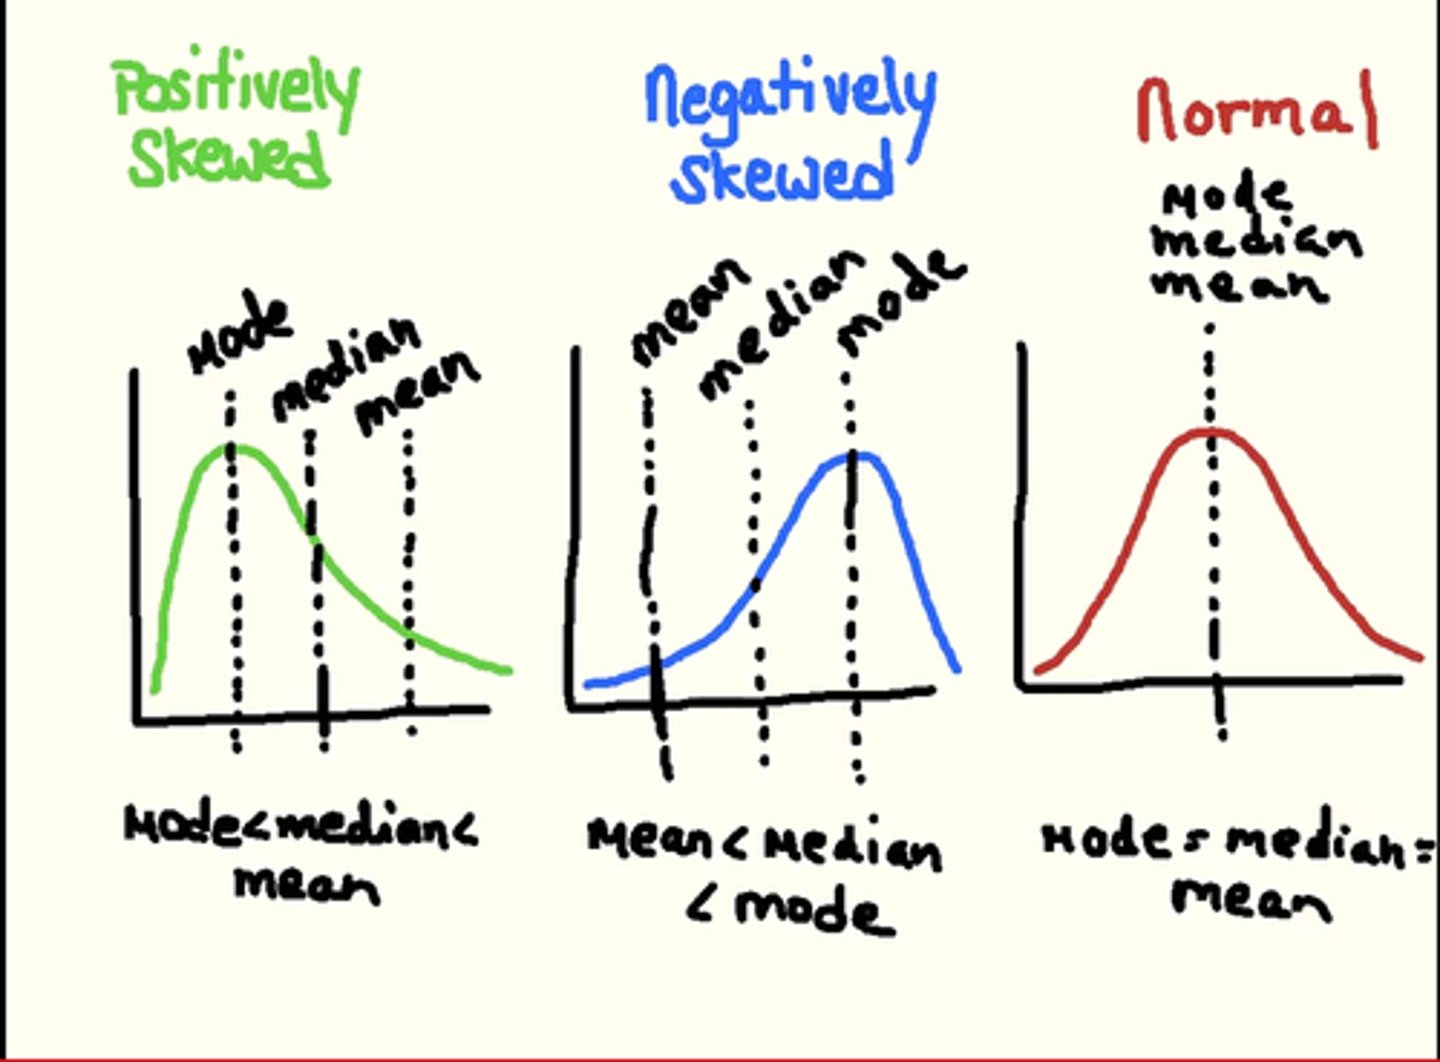
Floor Effect
situation in which many scores pile up at the low end of a distribution (creating skewness to the right) because it is not possible to have any lower score
Ceiling Effect
situation in which many scores pile up at the high end of a distribution (creating skewness to the left) because it is not possible to have a higher score
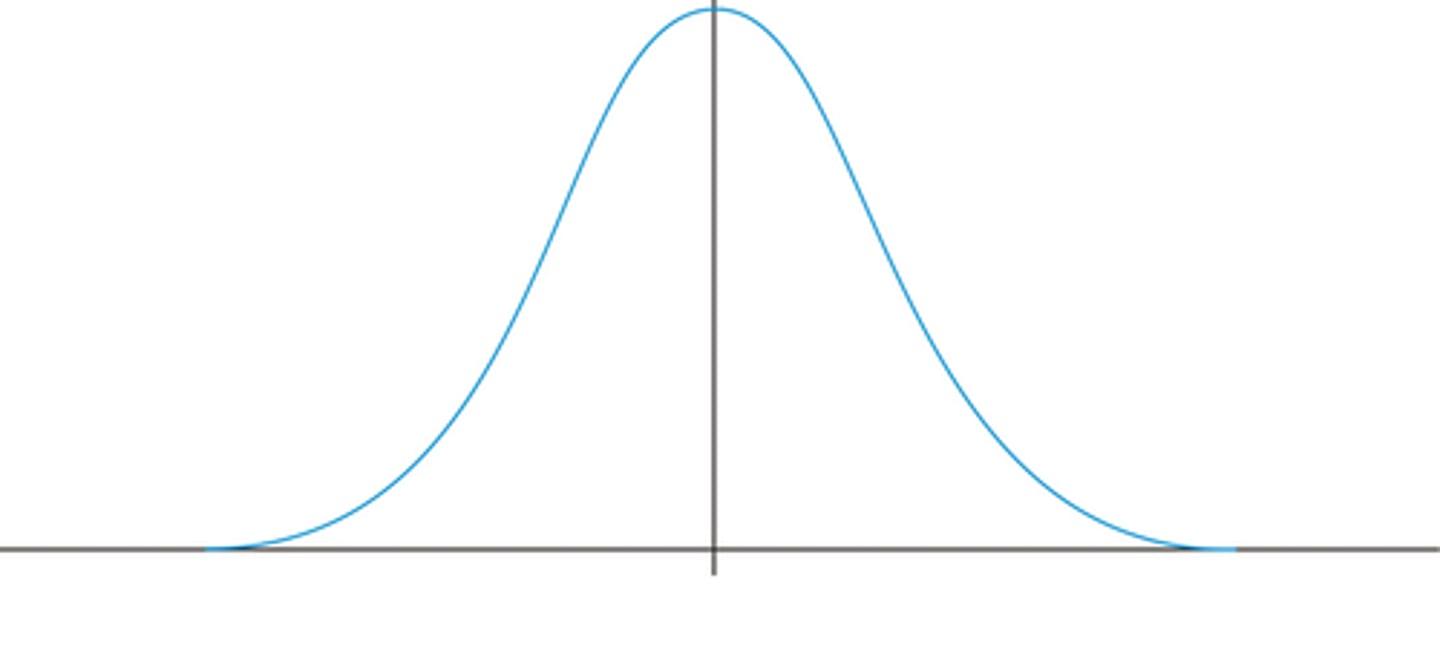
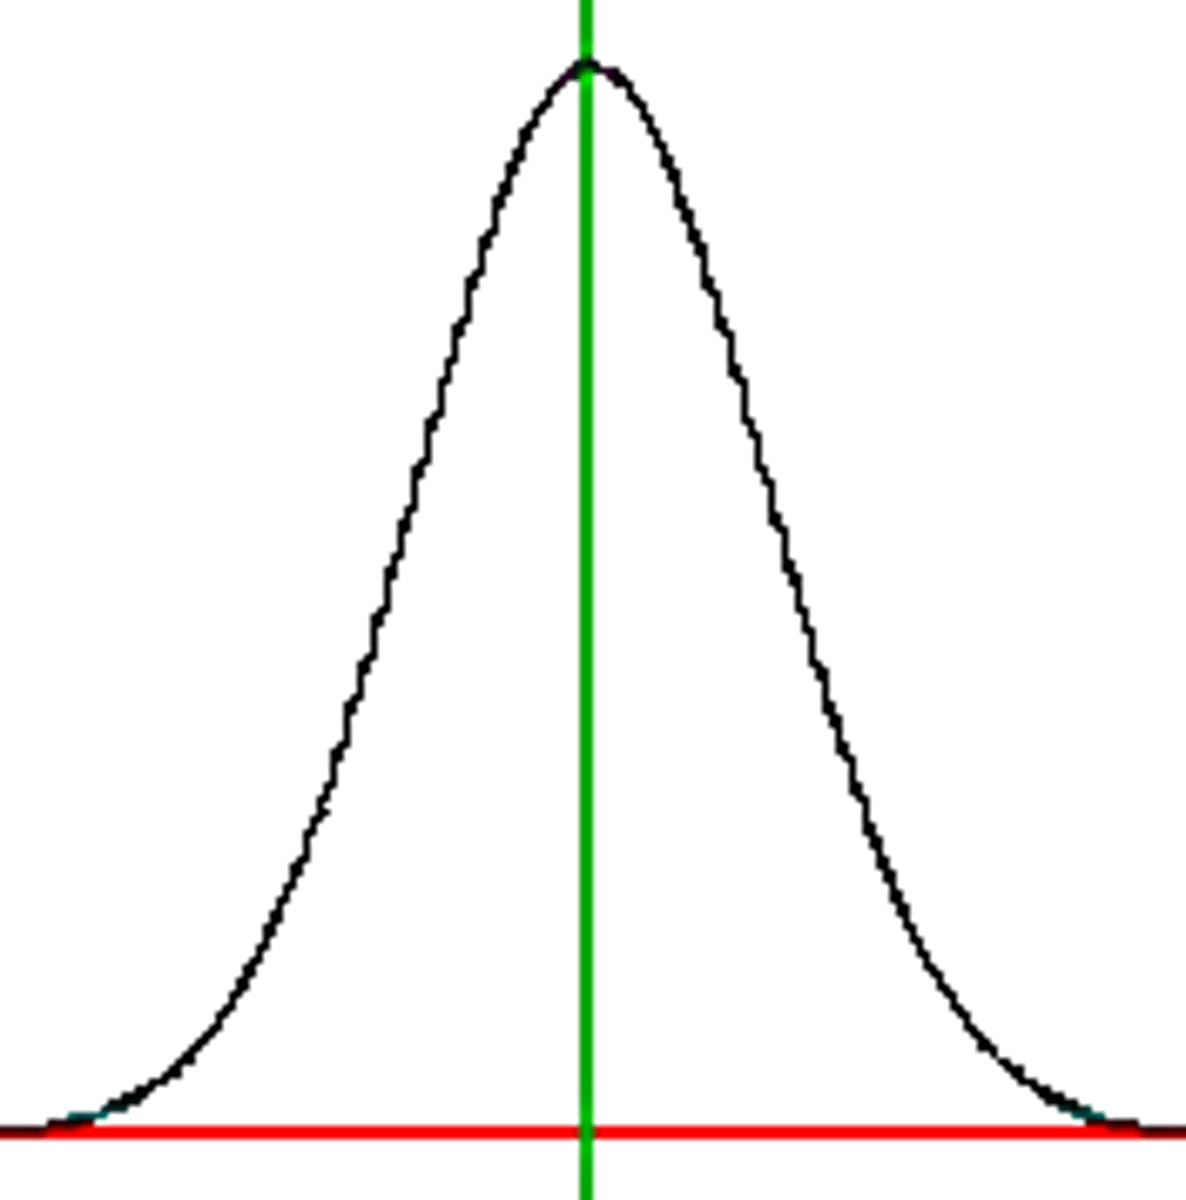
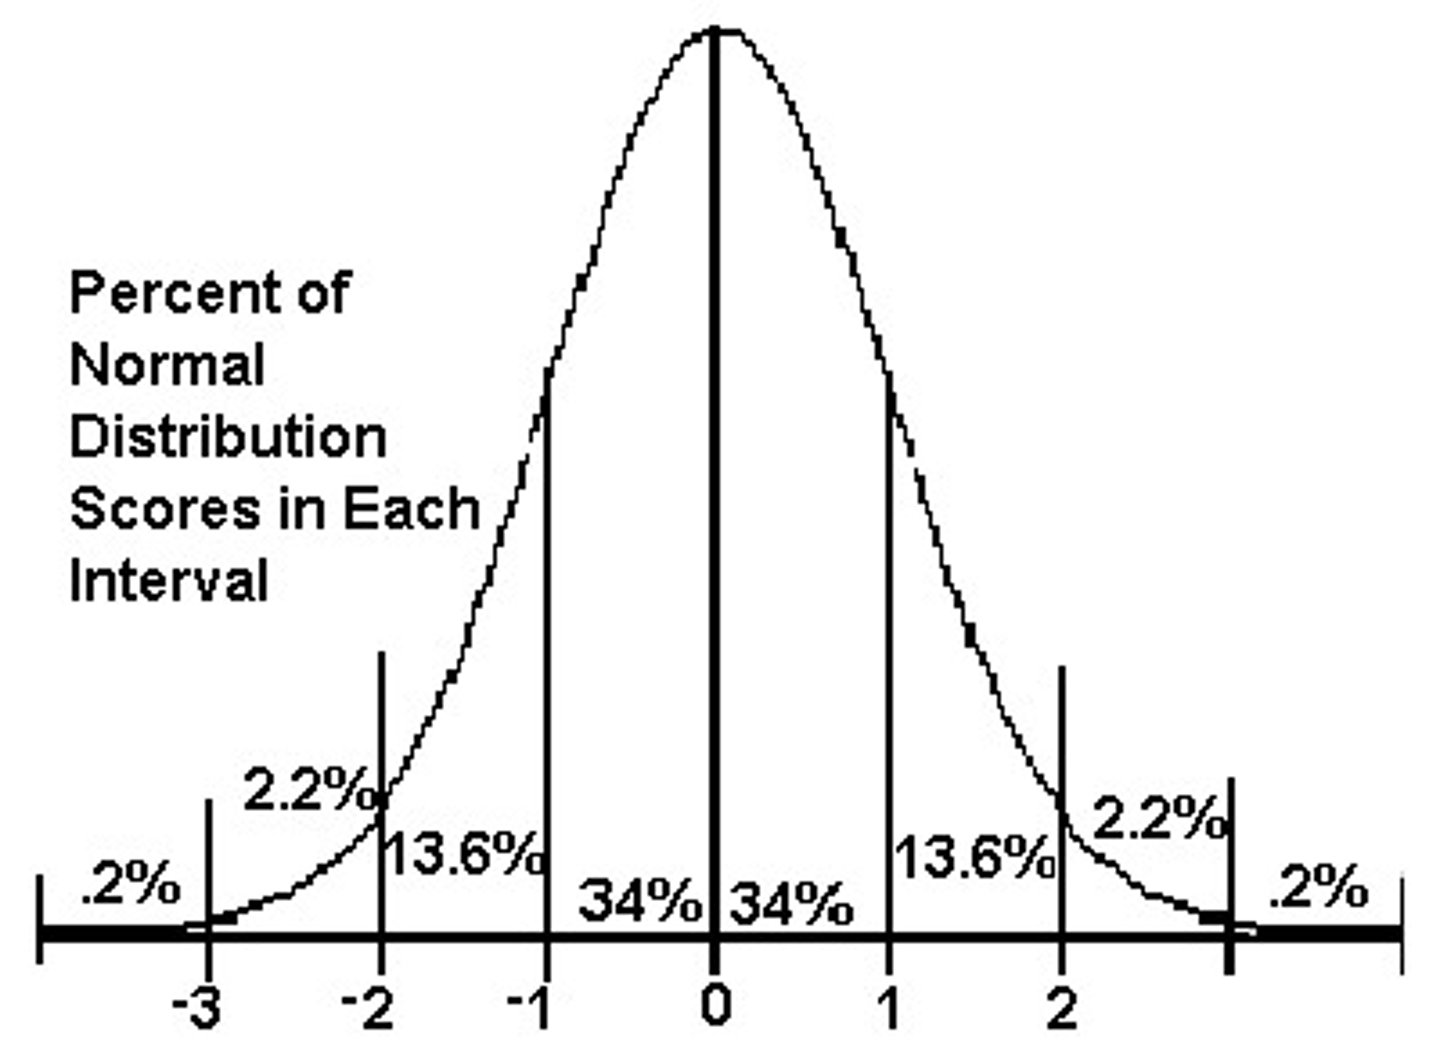
Normal Curve
bell-shaped frequency distribution that is symmetrical and unimodal; distributions in nature and in research commonly approximate it
Kurtosis
extent to which a frequency distribution deviates from a normal curve in terms of whether its curve in the middle is more peaked or flat than the normal curve
Assumptions
ideas that are tentatively accepted as being true without further examination
Data
information gathered during research
Facts
empirically observed events
Behaviors
any observable act from an organism
Observation
collecting data about a phenomenon
Inference
any conclusion drawn on the basis of empirical data and/or theories
Inductive Reasoning
reasoning from the particular to the general; used to generate theories based on observations
Deductive reasoning
reasoning from the general to the particular, such as when one makes specific predictions about future events based on theories
Theory
collection of ideas about how and why variables are related
Parsimonious Theory
suggests that a simple theory is preferred over a more complex theory is both theories explain the data equally well
Validity
refers to the methodological and/or conceptual soundness of research
Inductive Theory
built on a strong empirical base and strays little from that base
Intervening variables
Inferred factors hypothesized to operate between observed variables such as a stimulus and response, helping to explain their relationship
Deductive Theory
A theory that emphasizes constructs and the relationship between constructs and seeks to make predictions from the theory that can be tested with empirical research
Functional Theories
emphasize both inductive and deductive elements
Model
a simplified representation of the complex reality of the real world
Phases of Research
the stages of a research project
Idea-Generating Phase
First step in any research project during which the researcher selects a topic to study
Problem-Defining Phase
Research phase in which research ideas are converted into precise questions to be studied, uses deductive reasoning
Procedure-Design Phase
Research phase in which the specific procedures to be used in the gathering and analyzing of data are developed
Observation Phase
research phase in which the data are gathered
Data Analysis Phase
researcher processes the data using statistical procedures
Interpretation Phase
Research phase in which the results are interpreted in light of (1) the adequacy of control procedures, (2) previous research, and (3) existing theories
Communication Phase
research phase in which the rationale, hypotheses, methods, results, and interpretations of the study are presented
Replication
to repeat a study with no changes in the procedure
Levels of constraint
degree of systematic control applied in research
Naturalistic Observation
observing the natural flow of behavior in natural settings
Naturalistic Level of Constraint
research carried out in natural settings, in which the researcher doesn't manipulate the environment
Case Study Research
extensive observations of individuals or small groups, using minimal constraints on behavior
Correlational Research
research that seeks to measure the relationship between variables
Correlational Level of Constraint
Research designed to quantify the relationship between 2 or more variables
Differential Research
Research that involves comparing two or more existing groups
Differential Level of Constraint
Research in which 2 or more groups, defined on the basis of a preexisting variable, are compared on a dependent measure
Preexisting Variable
any characteristic of the individual that existed prior to the research study
Experimental Research
research in which participants are randomly assigned to groups and are compared on at least one dependent measure
Precision-Versus-Relevance Problem
The concern that higher-constraint laboratory research may be less relevant than lower-constraint naturalistic research and, conversely, that lower-constraint research may be unacceptably imprecise.
Central Tendency
typical or most representative value of a group of scores
Mean
arithmetic average of a group of scores
Mode
Value with the greatest frequency in a distribution
Median
Middle score when all the scores in a distribution are arranged from lowest to highest
Outlier
score with an extreme value (very high or very low) in relation to the other scores in the distribution
Variance
measure of how spread out a set of scores are; average of the squared deviations from the mean
Deviation Score
Score minus the mean
Squared Deviation Score
square of the difference between a score and the mean
Sum of Squared Deviations
total of each score's squared difference from the mean
Standard Deviation
square root of the average of the squared deviations from the mean
Computational Formula
equation mathematically equivalent to the definitional formula. Easier to use for figuring by hand, it does not directly show the meaning of the procedure
Definitional Formula
Equation for a statistical procedure directly showing the meaning of the procedure
Independent Variable
Variable that defines groups of participants on the basis of either (1) a preexisting characteristic (non manipulated IV) or (2) random assignment (manipulated IV)
Dependent Variable
variable hypothesized to have a relationship with the IV
Manipulated Independent Variable
Type of IV in which participants are randomly assigned to conditions
Nonmanipulated Independent Variable
the preexisting variable that determines group membership in a differential research study
Causal Relationship
a relationship between variables in which one variable causes a predictable change in the other variable
Extraneous Variables
Any variable, other than the IV, that might affect the dependent measure and thus confound results
Constant
variable that is prevented from varying
Controls
any procedure that reduces confounding
Belmont Report
outlined the basic ethical principles for human research that has been adopted by virtually all research agencies
Deception
procedures used in research to hide the true nature of the study
Concealment
Deliberately misleading participants by withholding some information about the research
Debriefing
disclosing to participants after the study the full nature of a study that used deception
Invasions of privacy
failure of researchers to protect the confidentiality of records
Confidentiality
ethical requirement to protect a participant's sensitive information
Informed Consent
principle that participants have the right to know exactly what they are getting into before they agree to participate in a research study
Institutional Review Board (IRB)
formal body that reviews research proposals to determine if they meet ethical guidelines
Risk/Benefit Analysis
assessing research in terms of the risks it poses to participants, its value to science and society, and whether potential benefits outweigh those risks
Ethical Checks
a series of questions about the research procedures designed to identify and correct potential ethical problems
Diversity
how well various ethnic, cultural, age, and gender groups are represented in a research sample
Laboratory Animal Care Committee
Committee that reviews the ethics of research proposals involving animals
Z Score
number of standard deviations that a score is above (or below, if it is negative) the mean of its distribution; it is thus an ordinary score transformed so that it better describes the score's location in a distribution
Raw Score
ordinary score (or any number in a distribution before it has been made into a Z score or otherwise transformed)
Normal Distribution
frequency distribution that follows a normal curve