Basic Imaging Theory
1/46
There's no tags or description
Looks like no tags are added yet.
Name | Mastery | Learn | Test | Matching | Spaced | Call with Kai |
|---|
No analytics yet
Send a link to your students to track their progress
47 Terms
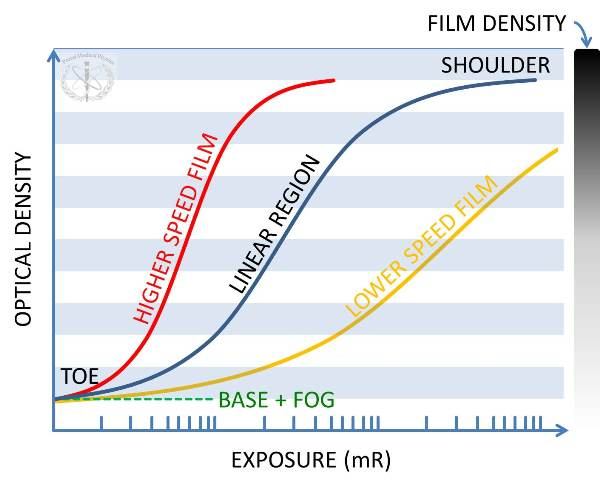
Hurter and Driffield (H & D) Curves
plot of optical density versus log of the exposure
aka characteristic film curve
H & D curves
Optical Density formula
OD = log(I_0 / I )
Fog
Darkening of film due to background radiation
Base
natural attenuation of completely unexposed film
speed
is a term that is related to the amount of radiation required to give an OD of 1 above the base and fog
fast films
require little radiation
diagnostic films are fast
slow films
require a lot of radiation
used in therapy
gradient
slope of the curve in the linear portion and measure of the contrast of the film
high gradient
means strong contrast
linear portion
where you want to be for imaging and dosimetry tests
latitude
refers to range of exposures a film can accept and still produce contrast in the image (darkest to lightest)
Contrast to noise ratio (CNR) Formula
CNR = (A - B) / σ
Contrast
difference in value between two objects on an image
could take the form of OD or HU
A and B in CNR formula
Noise
defined as the amount of fluctuation in an image due to statistical uncertainties and can be measured by looking at the standard deviation in pixel value over a uniform area
May come from photon counting or from electrons
σ
CNR
directly related to being able to see an object
lots of noise = need lots of contrasts to visualize
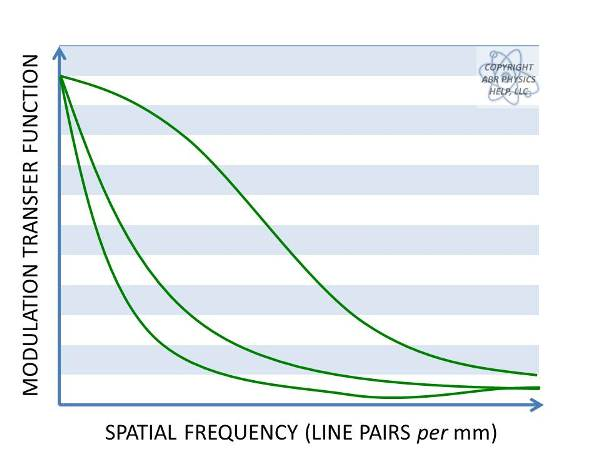
Modulation transfer Function (MTF)
measure of perceived contrast versus object size
as an object becomes smaller (increasing spatial frequency), it becomes harder to visualize (decreasing contrast)
limit of perceivable contrast
MTF of 0.1
MTF
Nyquist Frequency
minimum frequency an object must be sampled to be visualized (needs to be sampled twice to be seen)

aliasing
occurs when a high-frequency signal is sampled at a lower frequency
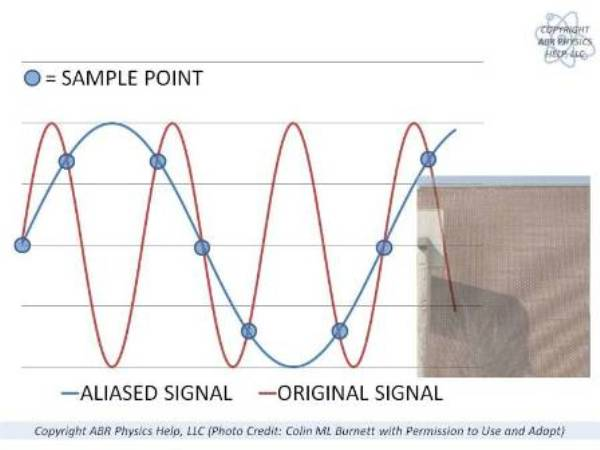
pixel binning (type of aliasing signal)
Quantum Detection Efficiency (QDE)
measure of how efficient your detection system is
defined as the ratio of number of photons detected to the number incident
Goal: as high as possible, to keep patient dose low and achieve low noise
- why we use phosphor screens and build up materials
Detective Quantum Efficiency (DQE)
measure of whole imaging system’s efficiency in forming an image (lumps electronic system noise in with errors from counting photons)
Used to track for QA because its a direct metric for the dose efficiency of the system
SNR
signal to noise ratio
DQE Formula
DQE = (SNR_out)² /(SNR_in)²
Phosphor screens
used in film radiography
Function to amplify the number of photons striking a film
Made of scintillating materials, take energy from x-ray and splits into many photons which strike film
Placed in front and behind films
accounts for 95% of x-rays striking film
Magnification
can be varied on an image by changing the location of source, object or detector
defined as ratio of size of object in image to true size
Magnification formula
M = image size / object size = SID/SOD
SID
source to image distance
SOD
source to object distance
How do you increase magnification
move object closer to source
move detector farther away
Penumbra
increases with magnification
Balance between penumbra blurring and image resolution
Image dose
increases with magnification
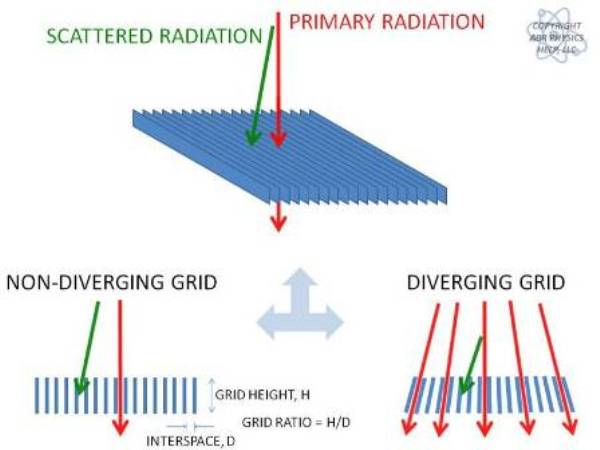
Scatter Grids
used to reduce amount of scatter reaching a detector
in order to remove attenuation from the bars, the grid can be rapidly shifted during acquisition (performed by the Bucky)
Receiver Operating Characteristic Curves (ROC curves)
used to assess usefulness of a test for detecting something
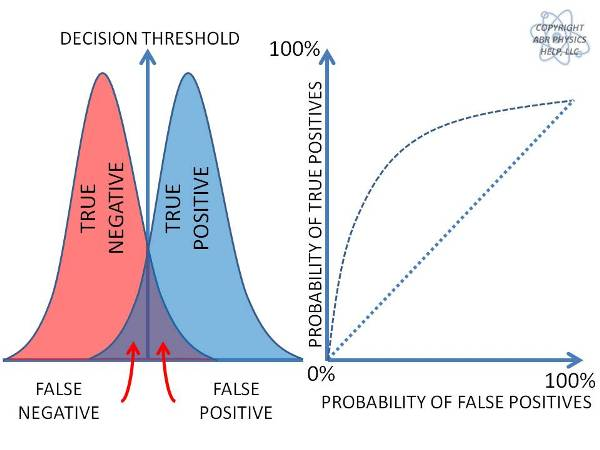
True Positive Fraction (TPF)
TPF = TP / (TP +FN)
Calling something positive when it is
sensitivity of the test
true positive fraction
False Positive Fraction (FPF)
calling something positive when its not
FPF = FP / (FP + TN)
Specificity
calling something normal when it is
Specificity = TN / (TN + FP)
Accuracy
calling something what it truly is
Accuracy = (TP + TN) / (TP + TN + FP + FN)
kV imaging
best contrast between soft tissue and bony anatomy
significant Compton interaction, large proportion of interactions are still photoelectric and the effective Z of bone is nearly 2x that tissue
cannot penetrate thick person’s anatomy
MV imaging
exhibit nearly no photoelectric interactions
only measure attentuation due to compton interactions
MV can penetrate thick
Beam Shape
scatter degrades images (compton scatters will ideally scatter away from detector)
beam geometry changes amount of scatter degrading image
Scatter grid only works for kV imaging
pencil beam
1st gen of Ct
no scatter, any scattering events send photon away from detector
fan beam
scan faster but have scattered components that degrade image
cone beams
scan fastest but have scatter in both dimensions that degrades image quality
- most modern CT machines - size of cone is important