EEMB 148: Midterm 3
1/150
There's no tags or description
Looks like no tags are added yet.
Name | Mastery | Learn | Test | Matching | Spaced | Call with Kai |
|---|
No analytics yet
Send a link to your students to track their progress
151 Terms
what are the two components of movement in a river?
immigration and emigration
what are five reasons rivers are considered disturbed habitats?
floods and droughts are common
unpredictable reductions in biotic abundance
colonization is often rapid
habitat heterogeneity is high
resources are patchy in space and time
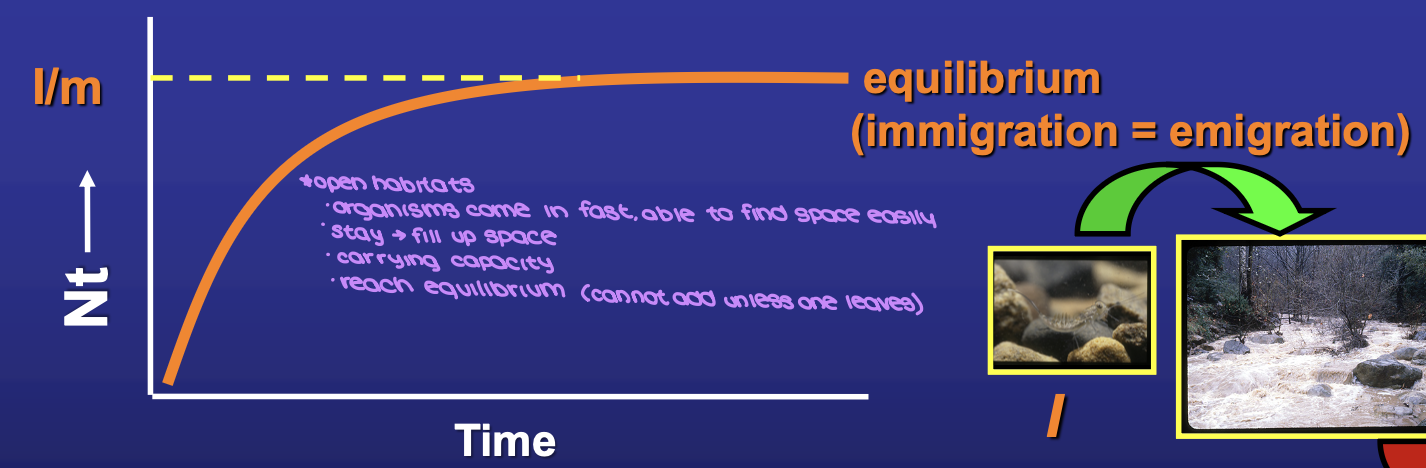
what is the general model equation for movement and colonization? what do each of the terms mean?
dN/dt = I - mN
I = immigration
N = density
m = per capita emigration
change in density is a factor of the change in time
how does the general model change at equilibrium (where immigration equals emigration)?
I = mN
organisms come into the space fast and stay
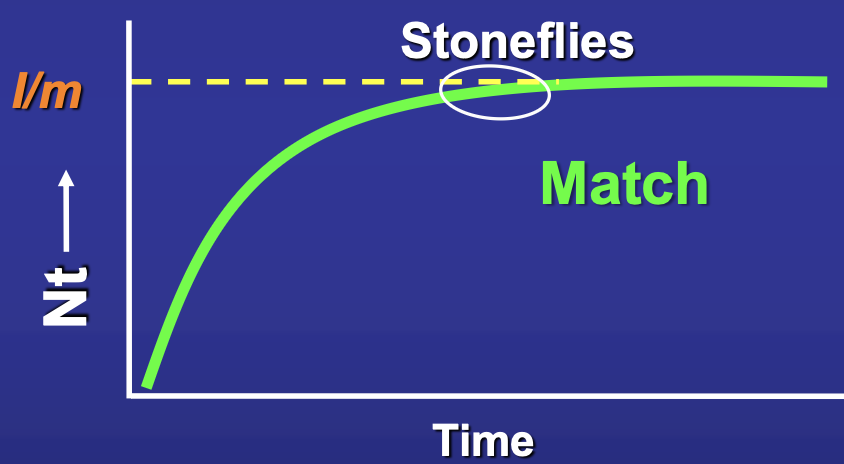
what are the results of the Cibrowski and Clifford experiment testing the general model on stoneflies?
stoneflies equilibriate in 1-2 days
MODEL MATCH
what are the results of the Cibrowski and Clifford experiment testing the general model on Simulium?
Simulium reach max density in 1 day and then decline
Simulium do NOT stay
NOT A MODEL MATCH
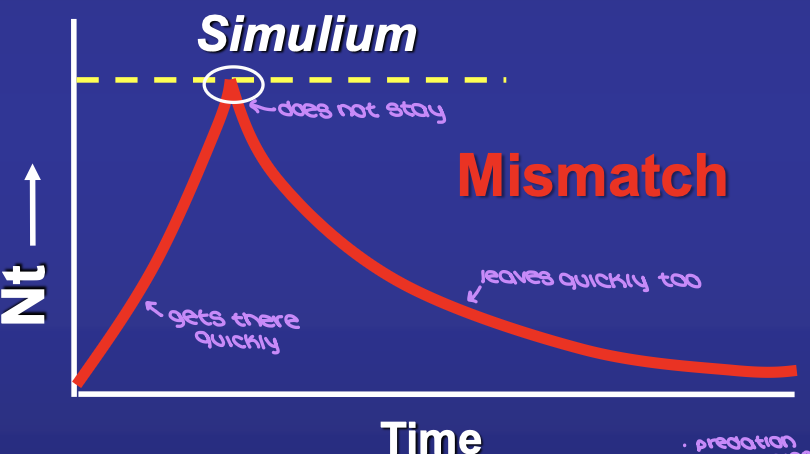
why were Simulium not a model match in the Cibrowski and Clifford experiment? (three possibilities)
predation: Simulium are eaten by stoneflies
succession/habitat degradation: rocks become smoother → biofilm forms → leads to filamentous algae → Simulium can no longer attach to rocks
density dependence: filter feeding organisms compete with each other for resources
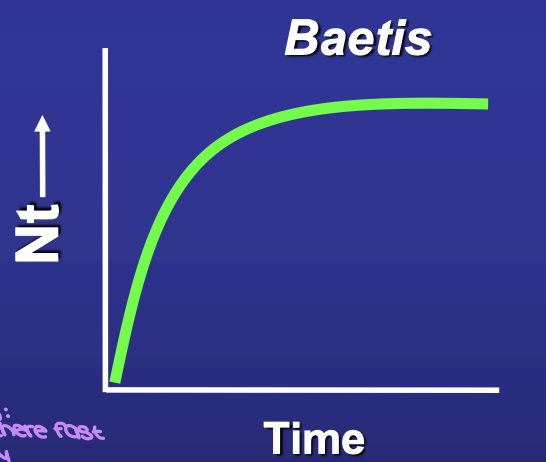
what are the results of the Shaw and Minshall experiment testing the general model on Baetis (mayfly)?
Baetis reach equilibrium density in 4 days
MODEL MATCH
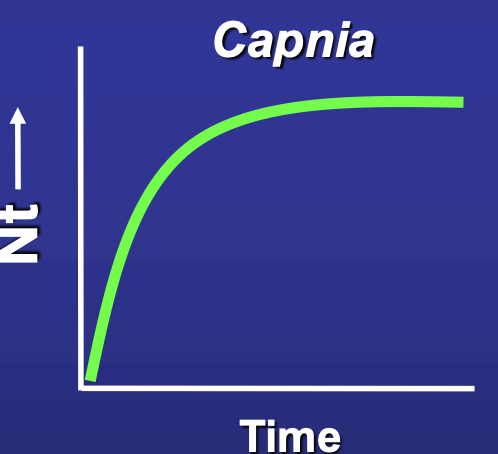
what are the results of the Shaw and Minshall experiment testing the general model on Capnia (stonefly)?
Capnia reach equilibrium density in 4 days
MODEL MATCH
what are the results of the Shaw and Minshall experiment testing the general model on Chironomidae (midge)?
Chironomidae still increasing after 2 months
Chironomidae do NOT get there fast
NOT A MODEL MATCH
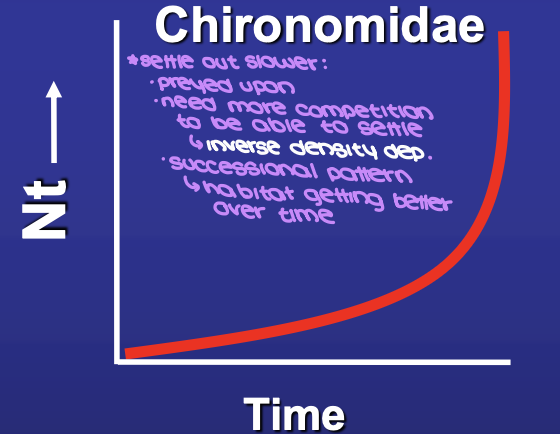
why were Chironomidae not a model match in the Cibrowski and Clifford experiment? (three possibilities)
Chironomidae have low drift rates
succession: habitat gets better over time → more resources for them to settle
inverse density dependence: need more competition in order to settle
what are the four sources of colonists?
downstream (down to up)
upstream (up to down) (drift)
aerial (top to bottom) (flight)
hyporheic (bottom to top)
what was the experiment that Williams and Hynes did on the source of colonists? what were the results?
used colonization trays to measure drift rate/density
results: majority of movement is upstream to downstream
what were the two issues with the Williams and Hynes experiment?
underestimates downstream to upstream
trout uses the nets to feed
combination of slow water current and lots of bugs creates a good place for trout to stay
overestimate aerial
snails climb the tethered net and eats the algae
what are the three types of drift?
catastrophic (floods): organism is forced to move
constant drift (continuous): organism moves by accident by slipping
behavioral: organism moves by choice
what is the difference between diel periodicity and aperiodic?
diel periodicity: night drift > day drift
aperiodic: night drift = day drift
what are the five reasons why organisms drift?
colonize
new resources
leave unfavorable patches
predator/competition avoidance
low cost dispersal
what is hypothesis #1 for why organisms drift at night?
accidental drift:
animals are move active at night (top of substrate)
entering the drift is accidental
drift is a passive process
what is the experimental evidence from Bailey?
animals more common on tops of stones at night (feeding)
correlation of activity on tops of rocks and drift at night
what is the experimental evidence from Kohler?
manipulated activity levels via starvation
starved mayflies during the night → should be hungry during the day
observed NO change in drift
results: drift was still nocturnal and not a passive process
what is hypothesis #2 for why organisms drift at night? what is the evidence for and against this hypothesis?
predator avoidance:
evidence for: larger animals tend to drift more at night
evidence against: meiofauna (small) show nocturnal drift
what is the experimental evidence for hypothesis #2?
if you put insects from a fish stream into a fish-less stream, the insects still drift at night
suggests that nocturnal drift behavior is genetically fixed (cue is a programmed response to light)
what were the results of Flecker’s comparison in fish and fish-less streams in the Andes mountains that helped to show if drift behavior was plastic or not?
drift behavior in fish and fishless streams in the Andes mountains
compared drift at night / day (N/D)
results:
fish streams: N/D > 1 (nocturnal drift)
fishless streams: N/D = 1 (aperiodic drift)
what were the results when Flecker added fish into a fish-less stream? is drift behavior plastic?
cage with fine mesh to prevent fish from feeding on the drifters
results:
increased predator → decreased day density → increased night density
drift is an active process — flexible behavioral response
what is the first factor affecting propensity to drift?
unsuitable physical/chemical/biological conditions
what is the second factor affecting propensity to drift?
food availability: ⬇ algal biomass ⬆ grazer drift rate
what is the third factor affecting propensity to drift?
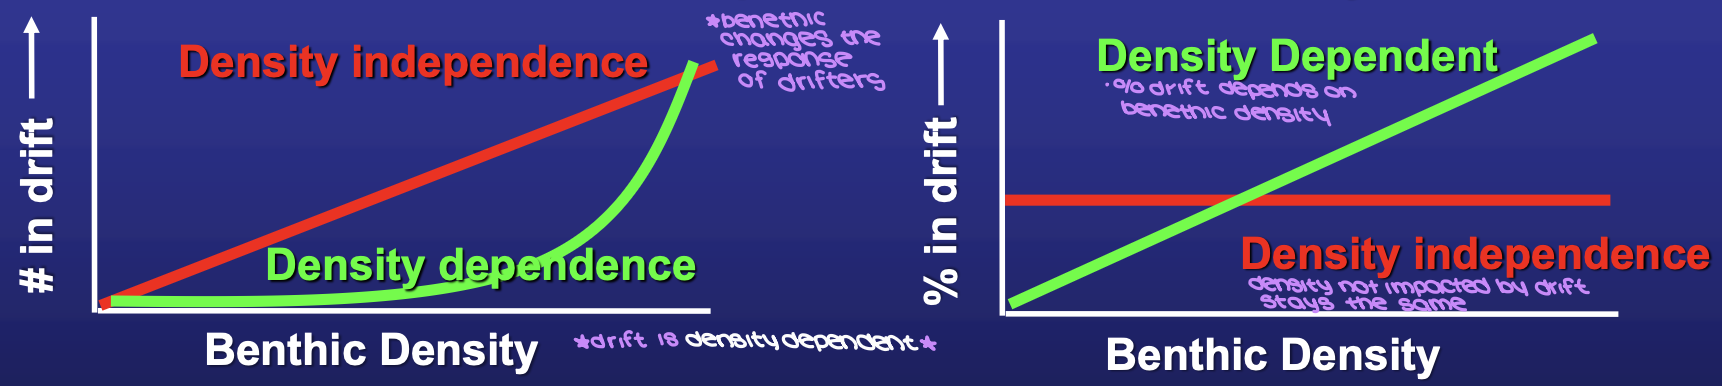
density of competitors
more competitors = harder to make a living
density dependence: lots of competitors = greater proportion will enter the drift
density independence: lots of competitors = no change in proportion drifting
what is the forth factor affecting propensity to drift?
antagonistic encounters: aggressive interactions increase drift rates
what is the fifth factor affecting propensity to drift? what did the Kratz/Even and Forester experiments show?
predator: drift feeders vs. benthic feeders
Kratz and Even: benthic predators lead to increased drift
Forester: drift predators lead to variable results (either drift at night or hide)
what is the first hypothesis used to explain why upstream depletion is not a seen consequence of drift?
Muller’s Colonization Cycle – compensatory upstream flight
what was the results of the Neves experiment that tested the colonization cycle hypothesis? Were there any problems with the design?
Neves: screens with sticky paper to measure upstream flight
error: weak fliers – heavily influenced by wind
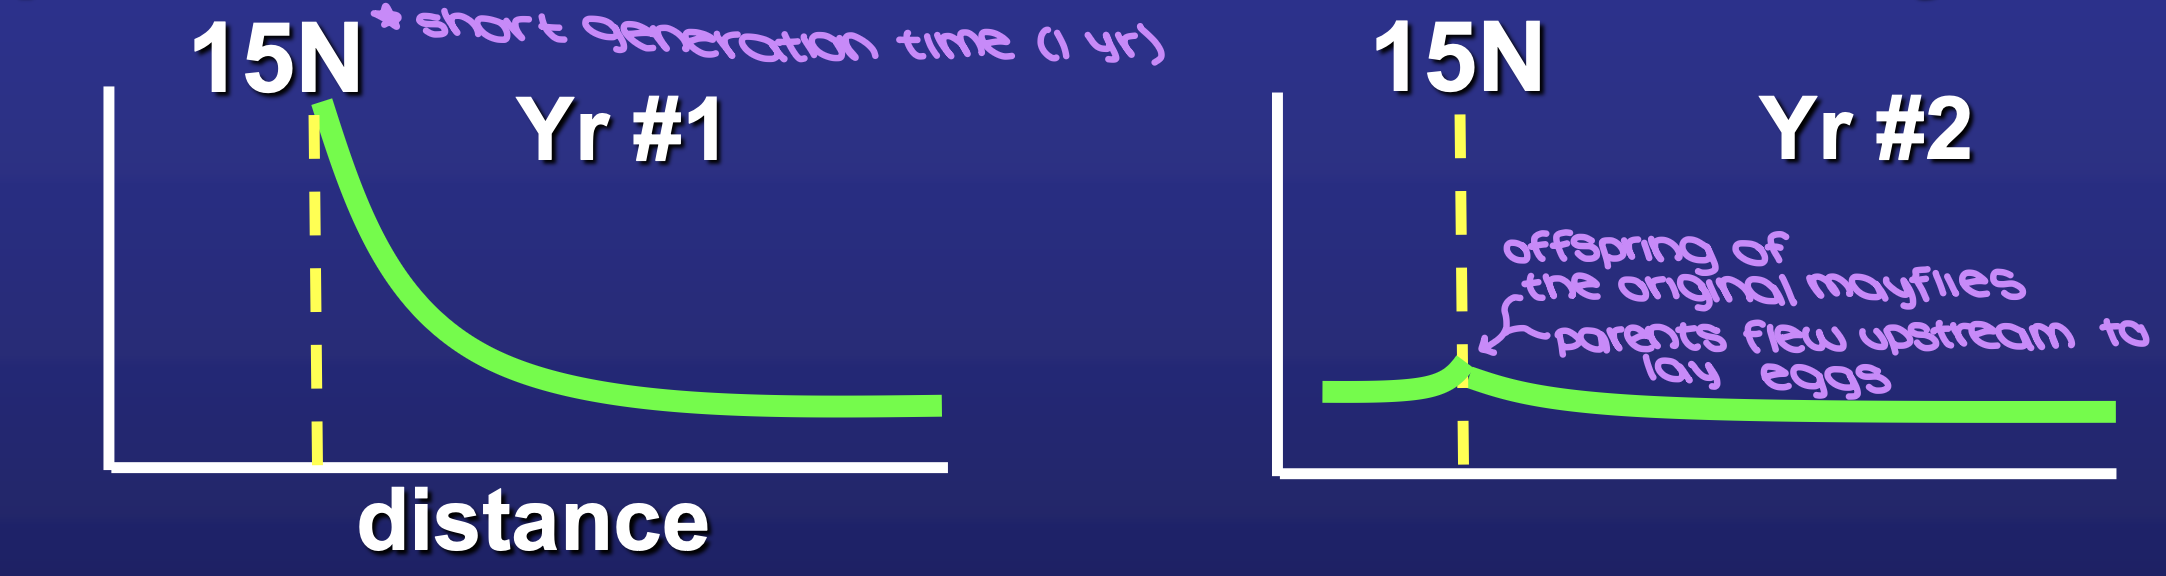
what was the results of the Hershey experiment that tested the colonization cycle hypothesis?
Hershey et al.: labeled algae with radioactive nitrogen, measured downstream depletion
found that there were equal amounts upstream and downstream at the start of the next year
offspring of the original mayflies
parents flew upstream to lay eggs
what is the second hypothesis used to explain why upstream depletion is not a seen consequence of drift?
Water’s surplus production — drift is surplus production in excess of carrying capacity
what is anadromous fish movements?
spawn in fresh water and live in salt water
less predation in fresh water
more resources in salt water
what is catadromous fish movements?
spawn in salt water and live in fresh water
no competition
open niche in fresh water
what are the movements of white fish? what adaptations do they have?
migrate onto floodplain
eat quick and lays eggs
water starts to retreat → adults and juveniles leave
adaptations to low water temperatures and high oxygen
what are the movements of black fish? what adaptations do they have?
remain on floodplains all year
moves from deep to shallow areas
adaptations to high temperatures, low oxygen, and camouflage
are stream communities structured by abiotic or biotic factors?
it depends
flashy streams: changes in discharge = controlling factor
stable streams: biological interactions = controlling factors
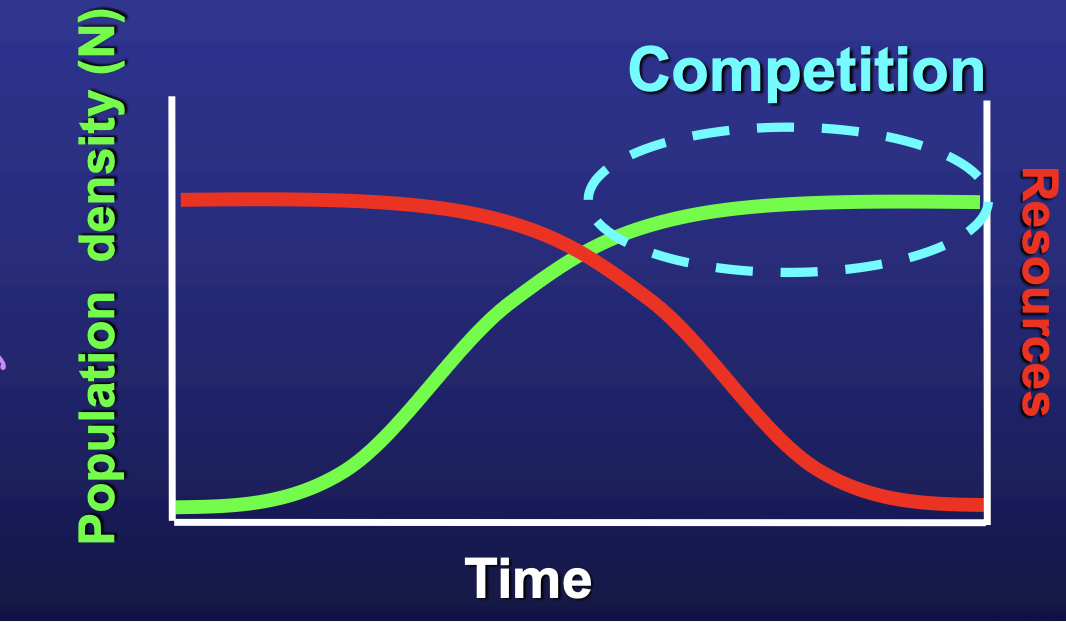
what is competition?
negative interaction where organisms are harmed by the association (-, -)
occurs over resources (food, space, light, nutrients, etc.)
what are the three conditions for competition to occur?
resources must be limiting
densities of organisms are high
environment is stable
what is intraspecific competition?
within one species
what is interspecific competition?
between two species
what is interference competition?
direct, physical interaction
what is exploitative competition?
indirect, typically mediated via a resource
what is the first idea within resource partitioning?
competitive exclusion principle → complete competitors can not coexist in the same niche
what is the second idea within resource partitioning?
ghost of competition past → past competition has led to niche diversification
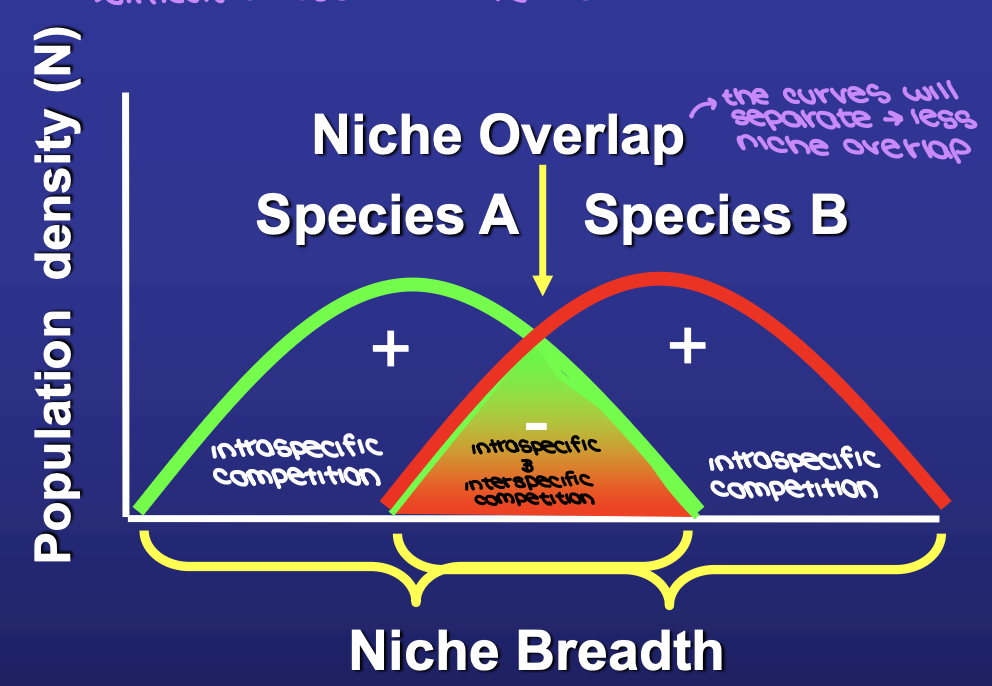
what is niche overlap? how can you test for niche overlap?
niche overlap: experiences both intra- and interspecific competition
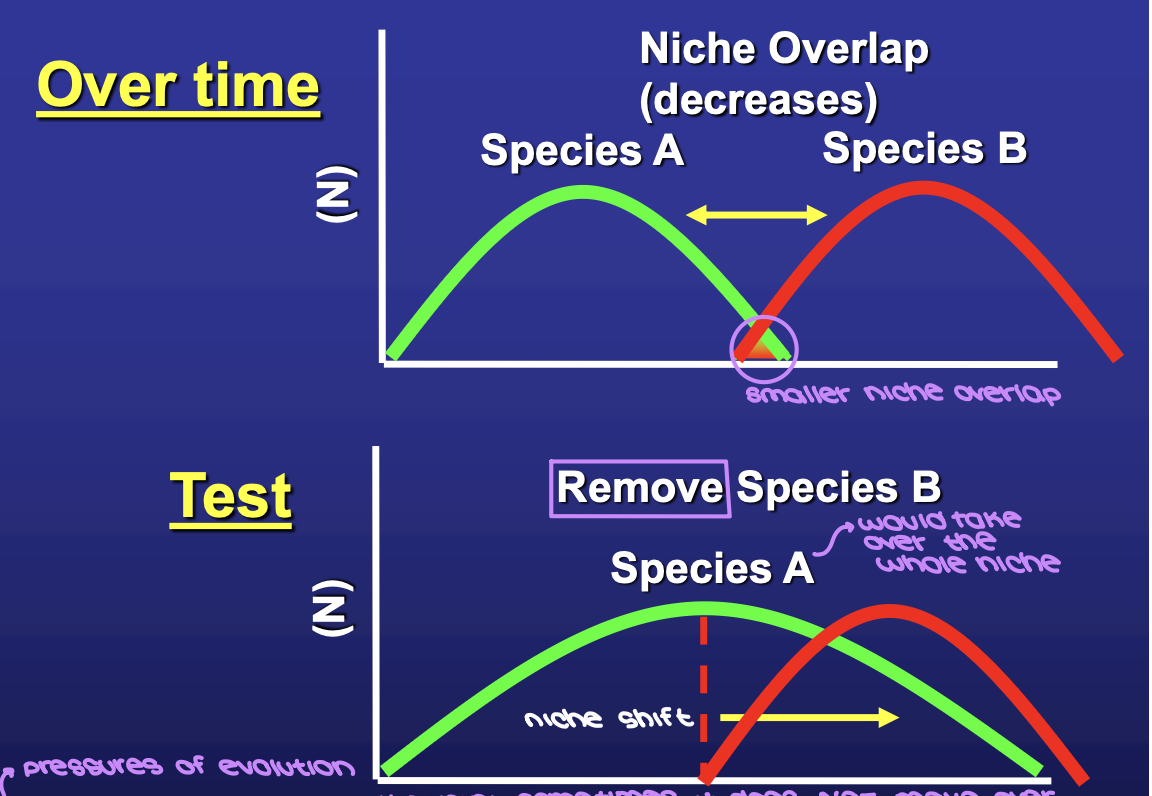
species will diversify and separate decreasing the amount of niche overlap
test: remove one species and observe the other species
experience competitive release and undergo a niche shift
could not shift over → may be genetically or physiologically fixed
what is the first way to measure resource partitioning? what did the Winemiller experiment show?
large scale habitat use, temporal (seasonality), microhabitat, food resources
ex. Winemiller – lack of diet overlap in tropical fishes
wet season – when food is abundant: ⬆ C ⬇ diet overlap
dry season – when food is scarce: ⬇ C ⬆ diet overlap
suggests competition is currently operating
what is the second way to measure resource partitioning? what did the Hynes experiment show?
distributional comparison (allopatry vs. sympatry)
Is the niche breadth wider where competitors are absent?
ex. Hynes – Great Britain vs. Isle of Mann
Great Britain: strong competition keeping these species apart
Isle of Mann: species A occupies the entire stream
suggests competitive release = niche shift
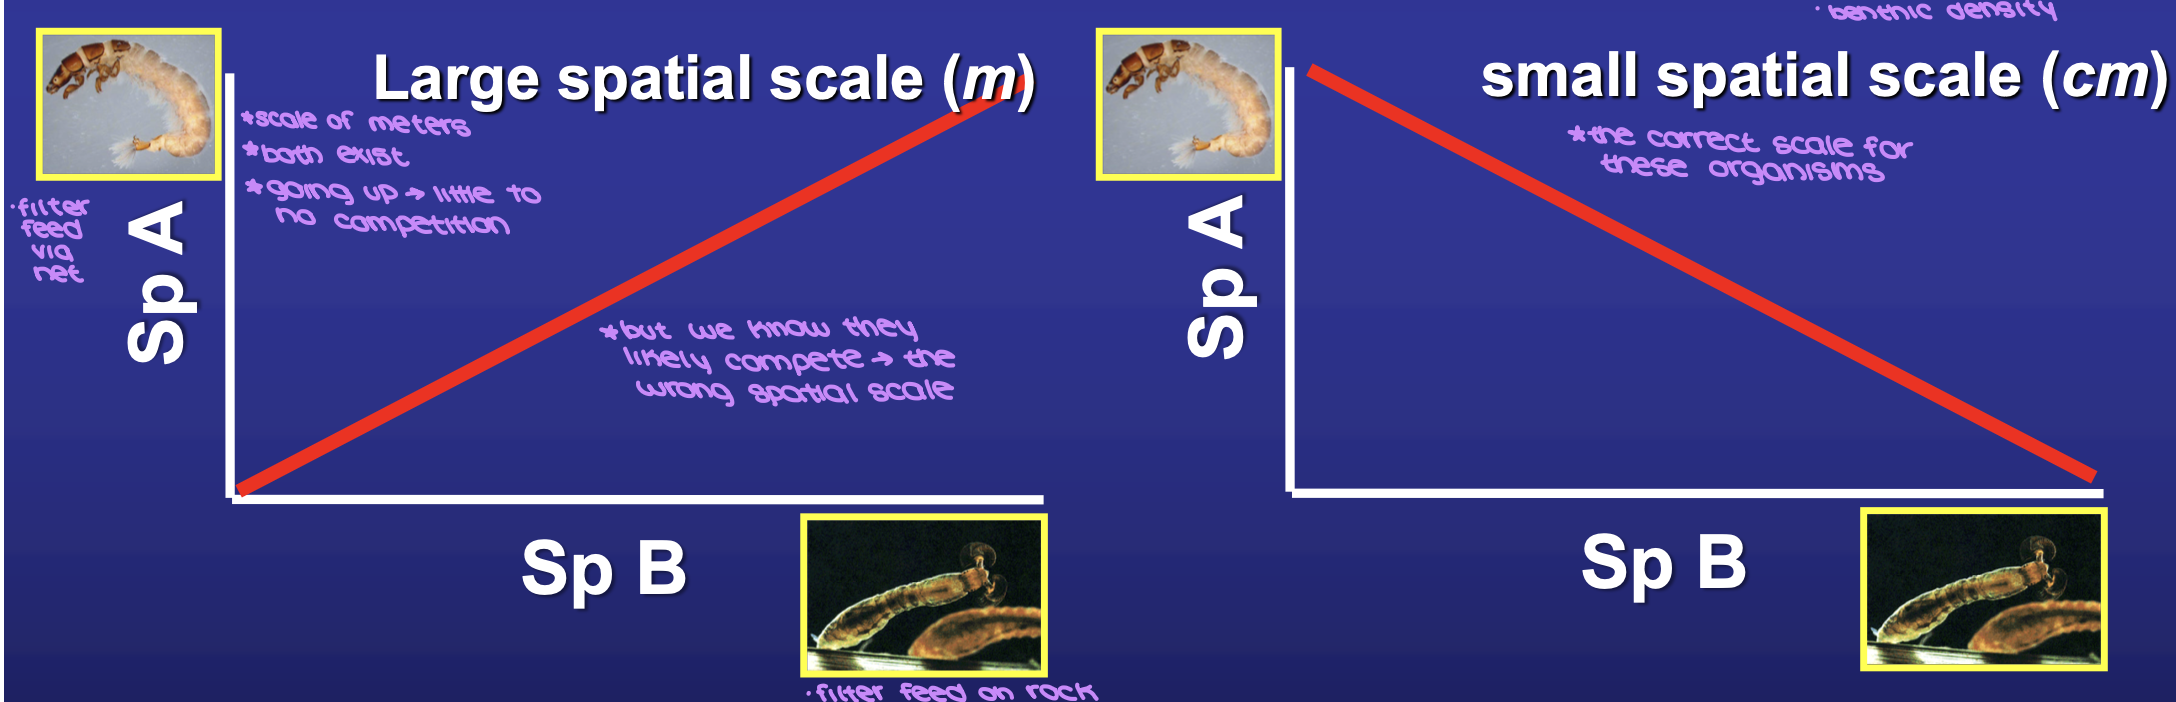
what is the third way to measure resource partitioning? what did the Hydropsychid caddisfly and black flies experiment show?
density relationships (negative correlation suggests competition)
problem with spatial scale (from the perspective of the organism)
ex. hydropsychid caddisfly and blackflies
species interact on a spatial scale of centimeters, not meters
compete for space in the best filtering locations
experimental test #1: intraspecific interference competition between riffle bugs
size of bugs determines preferred feeding size
directly fight over a resource
experimental test #2: interspecific interference competition between brown trout and brook trout interaction
brown trout utilize the best locations
removed brown trout → brook trout changed resting sites into vacated areas
demonstrates competitive release
brown trout bite the brook trout to maintain the best spaces
experimental test #3: intraspecific exploitative competition between Helicopsyche
observations: ⬆Helicopsyche ⬇ algae ⬇ Helicopsyche growth
no aggression noted
increased food → increase Helicopsyche → increase Helicopsyche growth
experimental test #4: interspecific exploitative competition between Glossoma and other grazers
observations: ⬆ Glossoma ⬇ algae ⬇ grazers
experiment:
no Glossoma = high algae = ⬆ grazers
no Glossoma = low algae = ⬇ grazers
resource dependent
Glossoma present = low algae = ⬇ grazer
G depletes resources which decreases grazers
why are there so many species and how is diversity maintained? what predictions does that lead to?
ghost of competition past: evolutionary time scale
diversity maintained by speciation
environmental stability = higher diversity
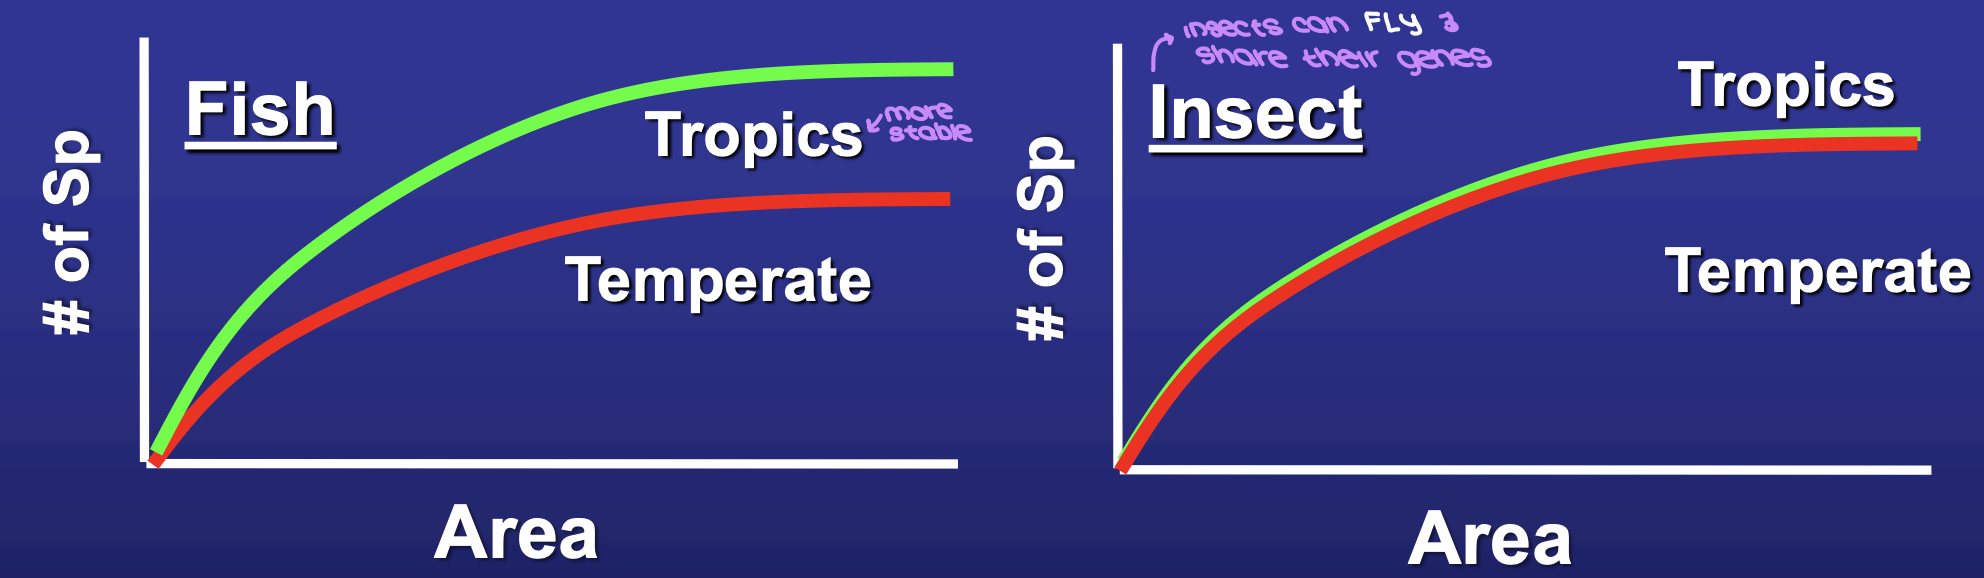
what are the diversity trends for fish and insects in tropical vs. temperate streams?
fish density tends to increase towards the equator
no trend for insects
insects are able to fly and share their genes
what is the theory of ongoing competition? how does that effect diversity?
competitive exclusion → diversity reduced by strong competition
what maintains diversity with ongoing competition?
disturbance
remove organisms and free spaces for inferior competitors
tradeoff between competitive ability and colonization ability
example of ongoing competition in sedentary invertebrates: Hydropsyche and Simulium observations
successional replacement over the summer
is the replacement driven by abiotic (season) or biotic (competition) factors?
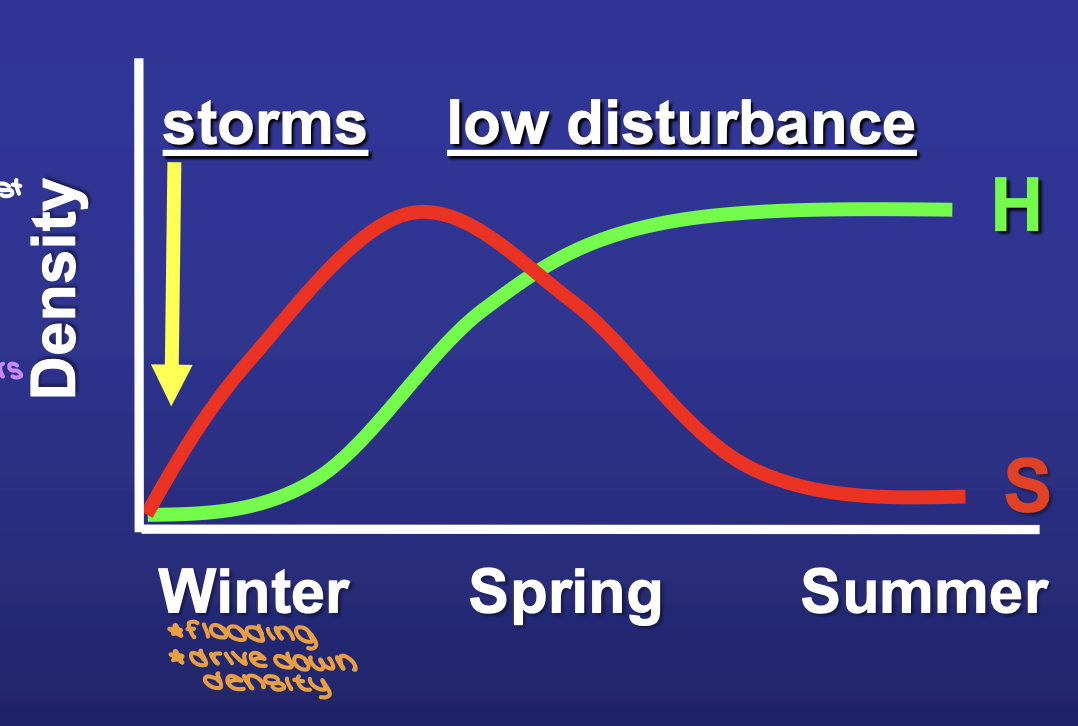
what happened in the treatment where you removed Hydropsyche?
⬇ Hydropsyche ⬆ Simulium
Simulium is able to survive through summer → not abiotic factors
what happened in the treatment where you removed Simulium?
no change Hydropsyche ⬇ Simulium
Simulium has no impact on Hydropsyche → asymmetrical competition
what happened in the treatment where you removed both Hydropsyche and Simulium?
⬇ Hydropsyche ⬆ Simulium
Simulium is the better colonizer/reproducer
what kind of competition occurs between Hydropsyche and Simulium?
Hydropsyche outcompetes Simulium for space by cutting Simulium in half
interspecific interference competition
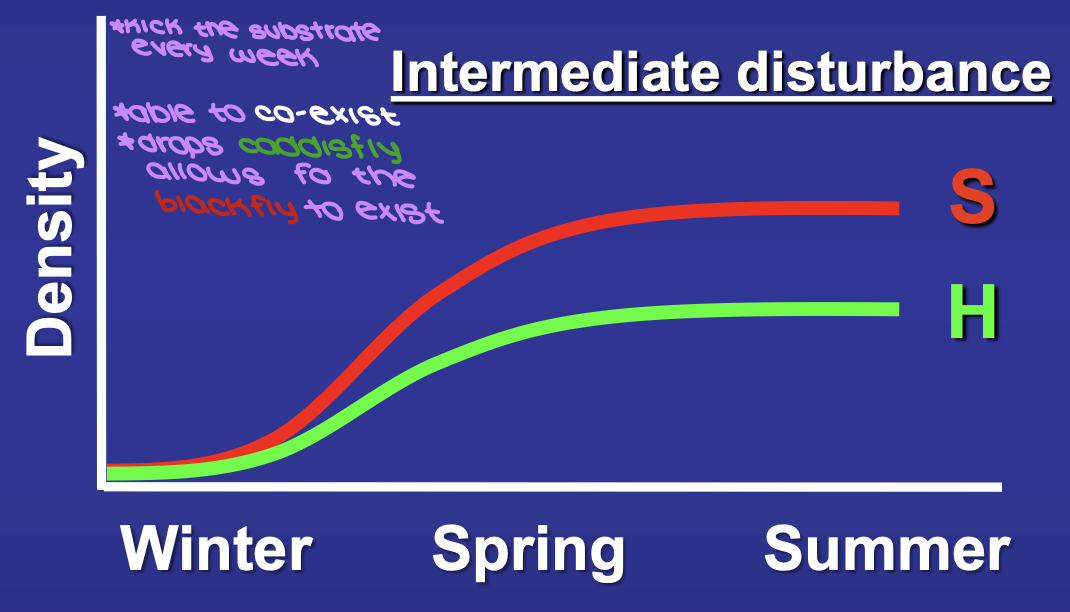
how do the results of the Hydropsyche and Simulium experiment change with intermediate levels of disturbance?
Hydropsyche and Simulium are able to co-exist through summer
what are the effects of predation?
reduce prey
effects on habitat use and foraging
cascading interactions
what are the two types of predators?
invertebrate
vertebrate
how do predators respond to an increase in prey density?
predator functional response: the consumption rate of prey by predator changes with prey density
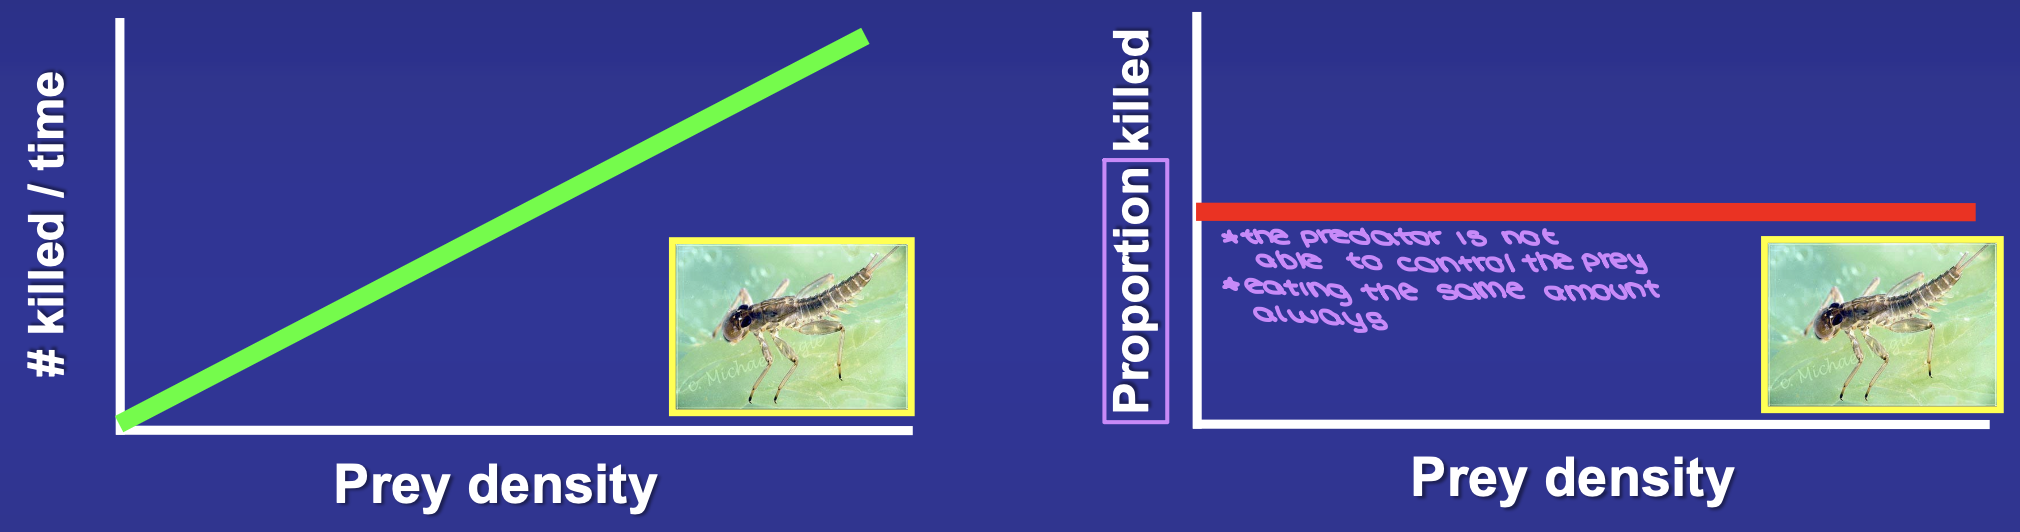
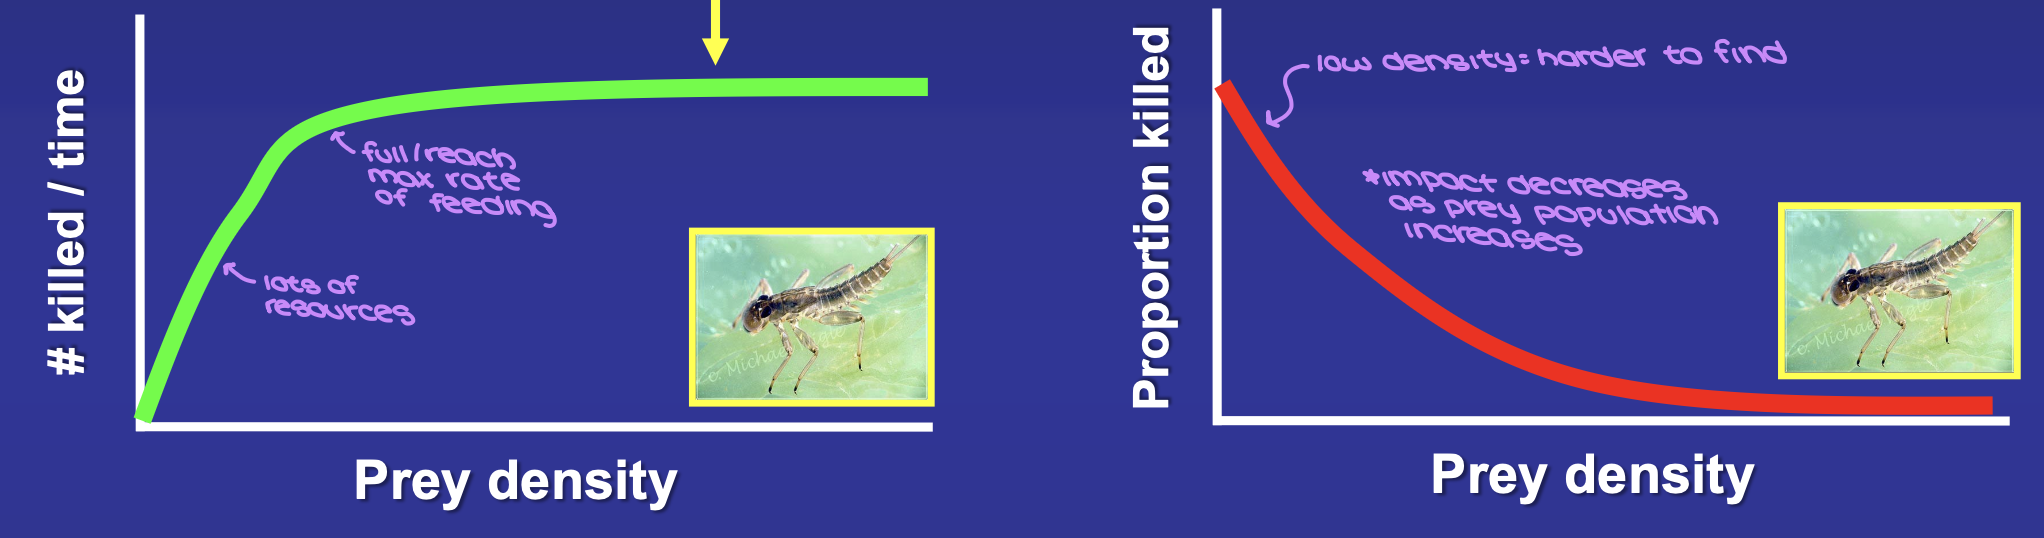
what is a type 1 predator functional response?
# of prey killed increases with density
⬆ predator ⬆ feeding rates
proportion killed is a flat line
predators CANNOT regulate the population
unrealistic in nature
issues with satiation and handling
what is a type 2 predator functional response?
# of prey killed increases then flatlines
proportion killed decreases
predators become full and cannot eat any faster
predators CANNOT regulate the population
rare in nauture
sand/bedrock rivers
artificial channels
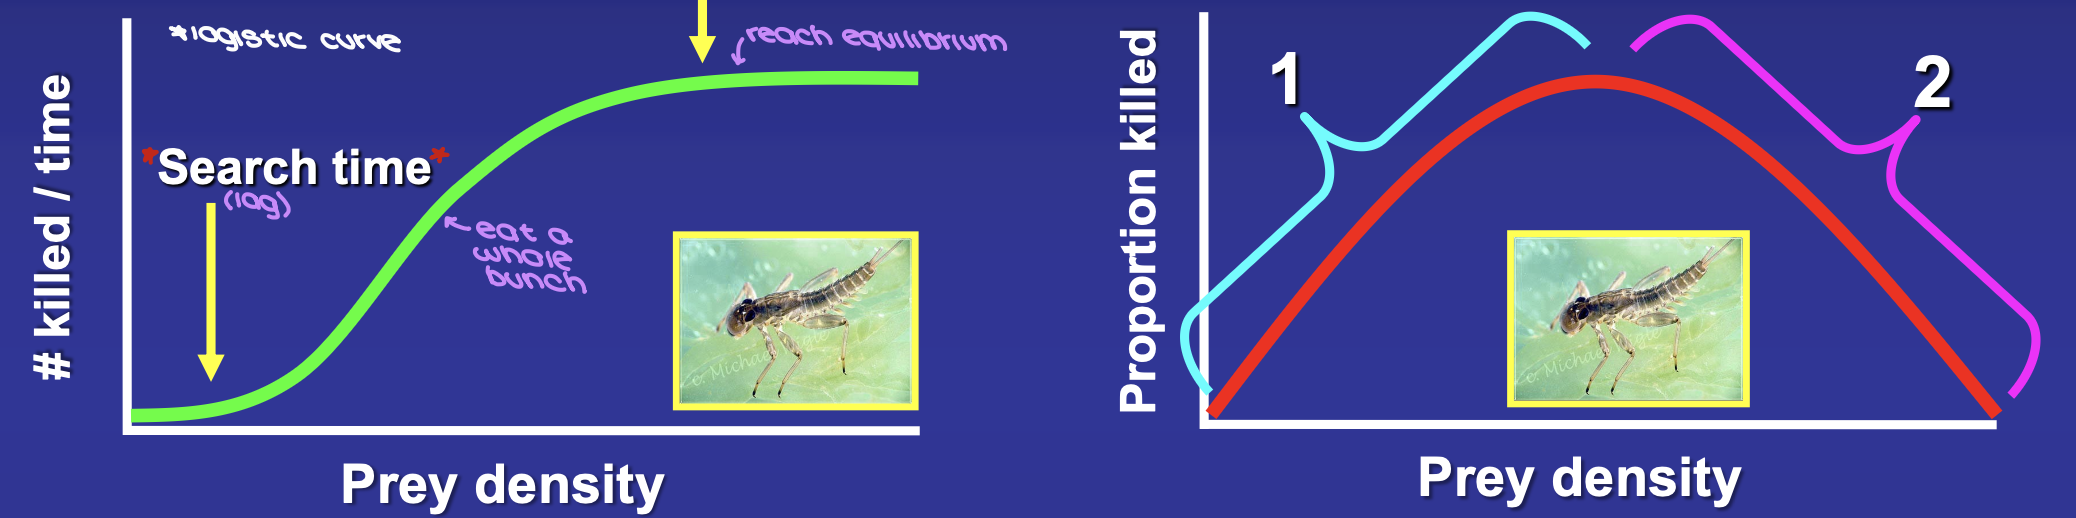
what is a type 3 predator functional response?
# of prey killed is a logistic curve showing a lag for search time, predator eats a whole bunch, and reaches equilibrium
proportion killed is a u-shaped curve
low to intermediate densities are regulated by predators
at high densities → predator swamping
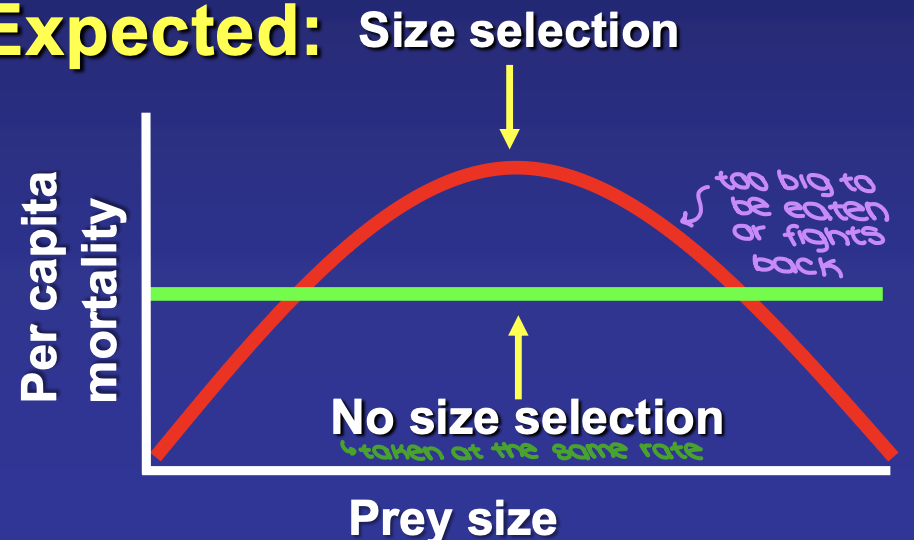
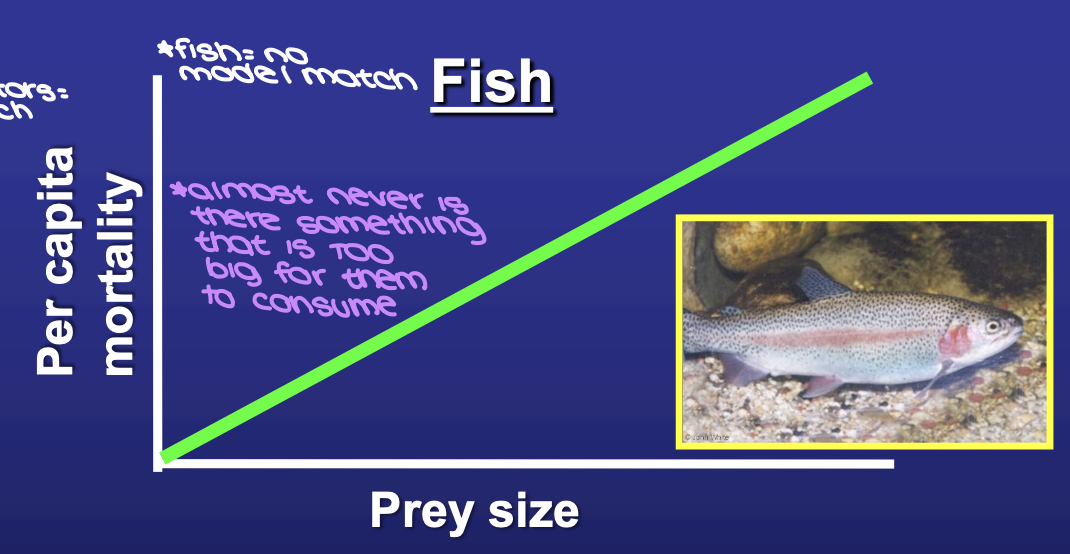
what does the size selectivity curve expected to look like for predators that don’t have size selection vs. those that do?
no size selection = flat line
size selection = u-shaped curve where at some point prey is too big to be eaten or fights back
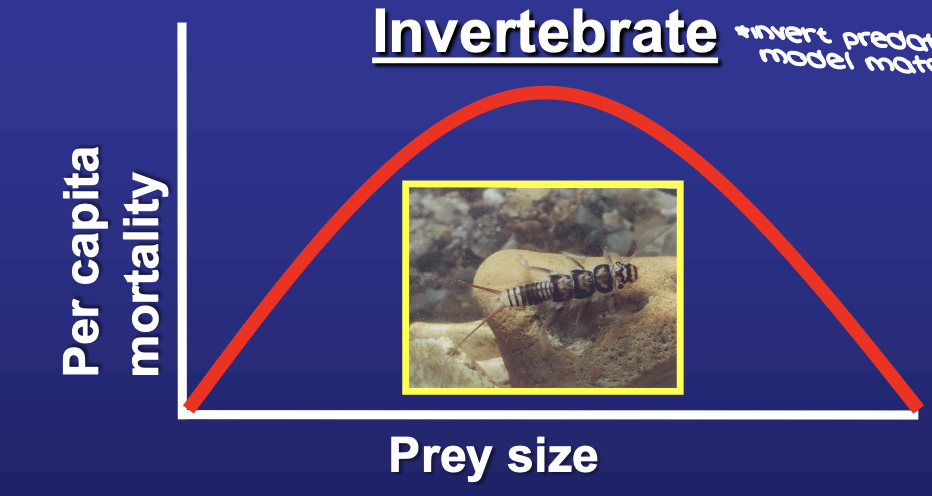
what does the size selectivity curve actually look like for invertebrates?
invertebrates demonstrate size selectivity
MODEL MATCH
what does the size selectivity curve actually look like for fish?
fish do not demonstrate size selectivity as there is almost no prey that is too big for fish to consume
NOT A MODEL MATCH
what does predator size influence?
determines diet breadth
what determines the minimize prey size consumed?
gill raker → acts as a cage within fish
what determines the maximum prey size consumed?
gape (how wide the mouth opens)
what is the first adaptation that prey use to avoid being eaten?
reduce activity ⬇ encounter rates ⬇ resource acquisition
what is the second adaptation that prey use to avoid being eaten?
avoid top of substrate ⬇ encounter rates ⬇ resource acquisition
what is the third adaptation that prey use to avoid being eaten?
nocturnal activity ⬇ encounter rates ⬇ resource acquisition
effective against visual predators like fish
not effective against tactile predators like invertebrates (use sense of smell)
what is the forth adaptation that prey use to avoid being eaten?
morphological defense (armor)
energetically costly
what is the fifth adaptation that prey use to avoid being eaten?
escape responses
drift
effective against invertebrate
fish would immediately consume
posturing (looking bigger)
effective against invertebrates because of poor eye sight and prey size limits
fish would want to eat the prey even more
what are the two mechanisms of predator effects?
consumption (global effect)
behavioral modification (local effect)
what is interaction modifications?
the interaction between two species is modified by the presence of a third species
what are the two types of interaction modifications?
facilitation (+)
inhibition (-)
what did Soluk and Richardson observe in channels with and without trout? what did their observation lack?
trout grow faster in the presence of stoneflies
lacked a mechanism for this effect
what were the two predictions of Even’s experiment in Southern California streams to uncover the mechanism for the previous observation?
predators will decrease prey
multiple predators will significantly decrease prey
what were the results in the treatment measuring density / consumption?
odonate: ⬇ prey
trout: ⬇ prey
odonate and trout: ⬇ prey
impact is no larger with both species
what were the results in the treatment measuring emigration / escape?
odonate: ⬆ prey
trout: ⬆ prey
odonate and trout: ⬆⬆ prey
what were the results in the treatment measuring exposure / hiding?
odonate: ⬇ prey
trout: ⬇ prey
odonate and trout: ⬇ prey
what were the overall results from Even’s initial experiment?
no significant different in number of prey consumed by multiple predators and predators in isolation
what did Even do to determine the why there was no significant different in prey consumed?
examined the stomach contents of trout and odonates
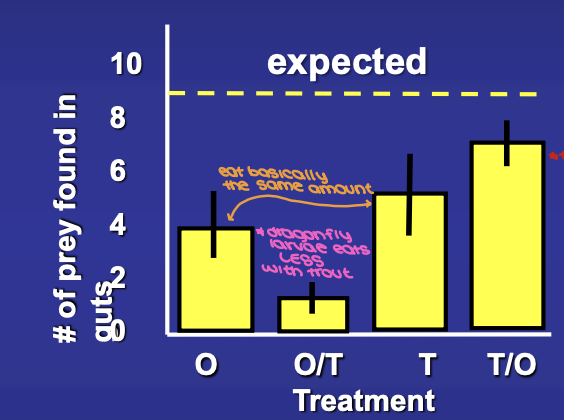
what were the results when Even examined the stomach contents?
trout decreased foraging rates of odonates
trout harass odonates causing them to hide → inhibition
odonates increase foraging rate of trout
when odonates hide, prey chose to escape and drift
when prey drift, they are consumed by the trout
no net effect = compensatory mechanism
what is the equation for predator impact? what do each of the terms mean?
PI = - ln(Np/No)
Np = prey density in cages with predators
No = prey density in cages without predators
what is the general model equation for predator exchange rates?
dN/dt = c(Ne-Ni) - aNiP
c = exchange rate = the rate at which an organism moves across a boundary
Ne = prey population density exterior of cage
Ni = prey population density interior of cage
aNiP = number of prey consumed
a = attack rate
P = number of predators
what are the three predictions of the predator exchange rate model?
as a increases, PI increases
as P increases, PI increases
as c increases, PI decreases
predator effects on prey density are greater in habitats with reduced prey exchange
what were the two predictions for the Even and Cooper experiment in Sierra Nevada streams?
predators will decrease prey
increase in exchange rates = decrease predator impact (PI)
what were the two treatments for the Even and Cooper experiment in Sierra Nevada streams?
added trout and stoneflies
across a gradient of prey (baetid mayfly) exchange rates in channels
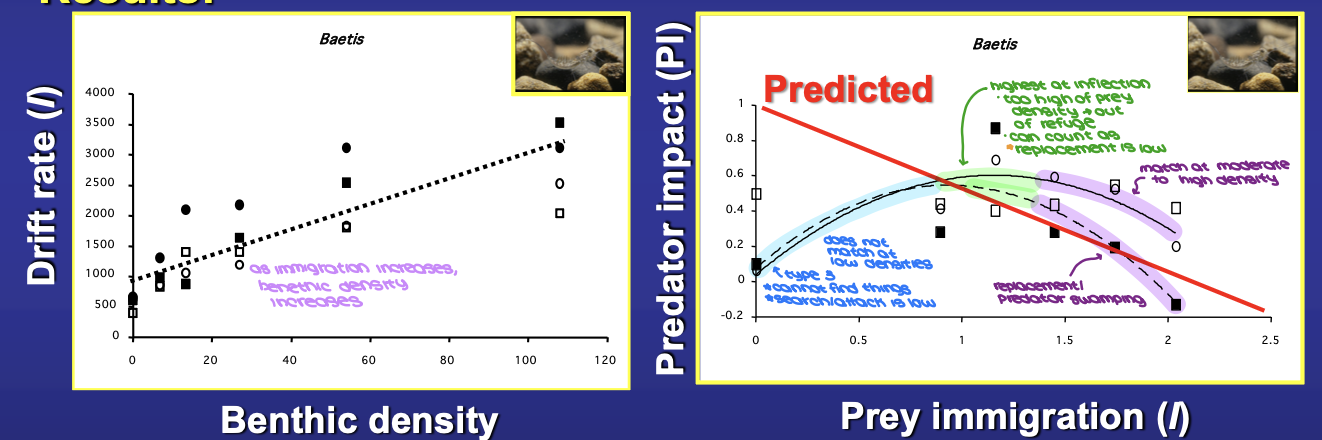
explain this results graph from the Even and Cooper experiment in Sierra Nevada streams.
NOT A MODEL MATCH
low exchange rates, prey are in refuge
type 3 → cannot find prey → search and attack is low
PI is low
at intermediate exchange rates, prey are exposed
too high of prey density → cannot all hide
replacement is low
PI is high
at high exchange rates, predator impact is swamped
PI is low
why was the Even and Cooper experiment in Sierra Nevada streams not a model match?
model was too simple → immigration and emigration are not equal
bugs: I < E
fish: I > E
what is a trophic cascade?
the effects of upper trophic levels cascade via direct and indirect effects through lower trophic levels