1.1.4 Production possibility fronters (PPF's)
 Call Kai
 Learn
Learn Practice Test
 Spaced Repetition
 Match
Match Flashcards
 Knowt Play
1/11

There's no tags or description
Looks like no tags are added yet.
Name | Mastery | Learn | Test | Matching | Spaced | Call with Kai | Chat |
|---|
No analytics yet
Send a link to your students to track their progress
12 Terms
What are production possibility fronters?
Diagrams used to represent opportunity cost and what an individual/ economy can produce using its scarce resources (factors of production)
It shows the maximum output combination of two goods that can be produced when all resources are fully efficiently used
What are some key features of PPF’s?
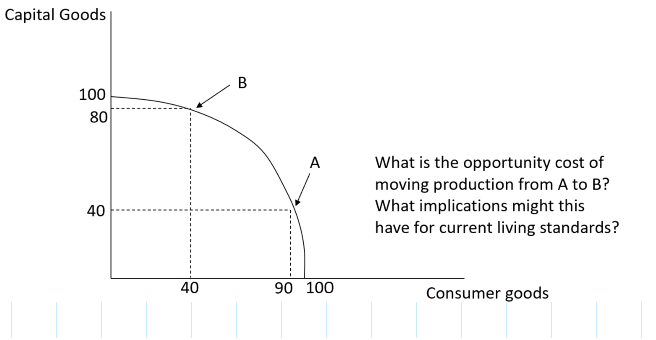
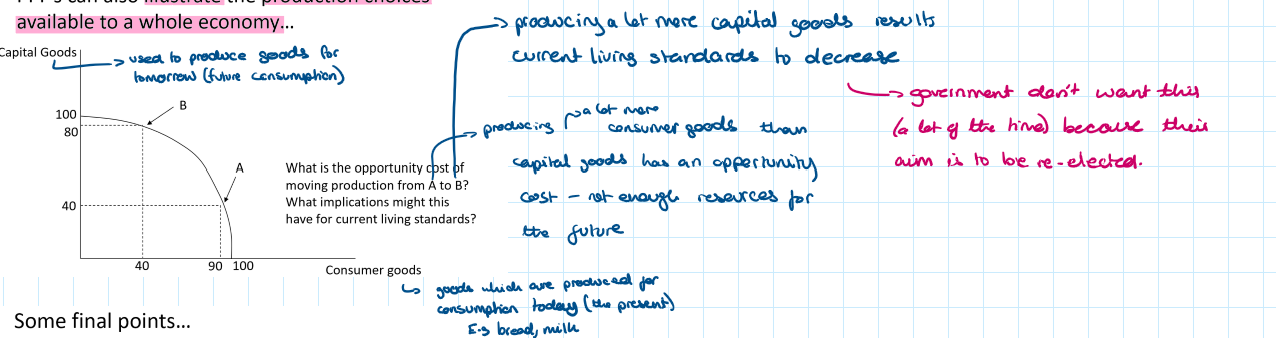
they can also illustrate the production choices available to a whole economy
PPF’s give no indication of which combination of goods is desirable for an economy
Economic resources are not equally adaptable to all uses
What is it called when the PPF is not a straight line? and what does this mean?
If the PPF is not a straight and is concave then the opportunity cost will vary
What does a PPF with straight line show?
If the PPF is a straight line then the opportunity cost will be constant along the length of the line.
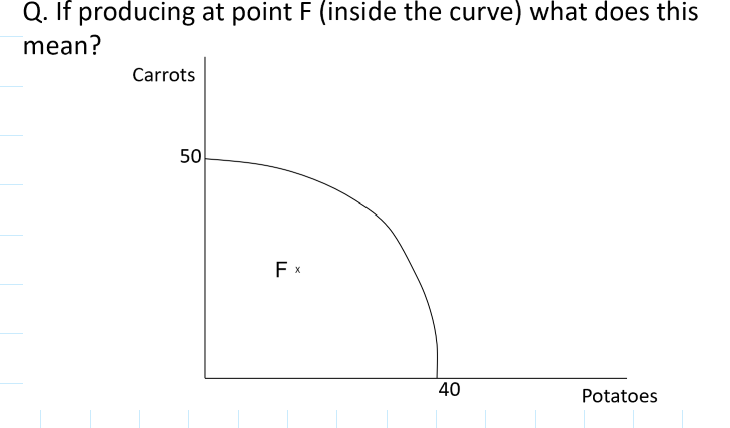
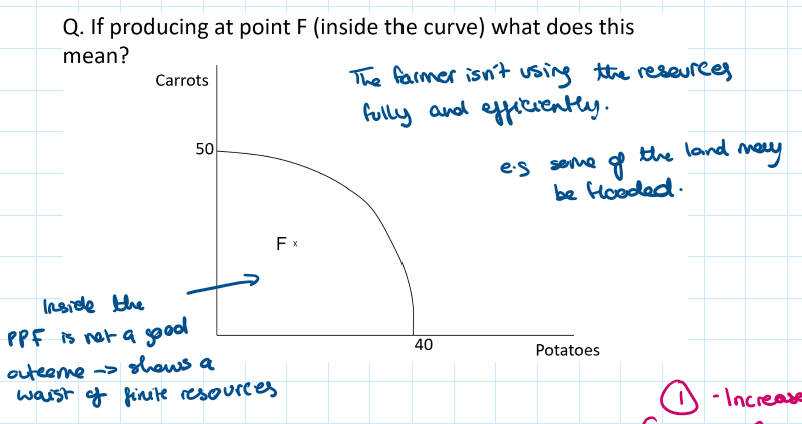
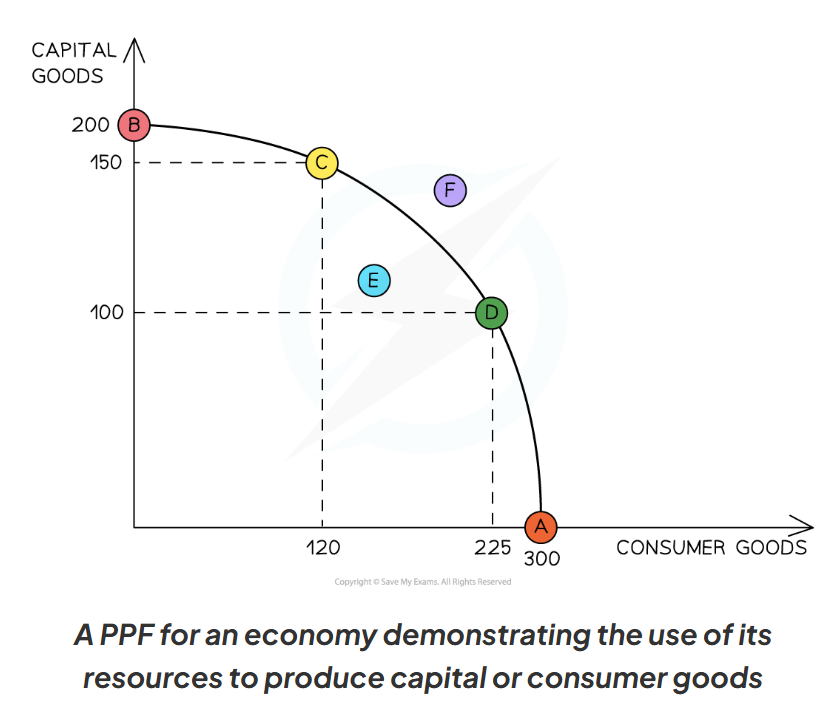
Explain the points on this diagram
A - Resources are used to produce only capital goods
B - Resources are used to produce only consumer goods
C & D - Represents full and efficient use of economic resources, as these points are on the curve. (however there is an opportunity cost)
E - Inefficient use of resources
F - Unattainable
Any point on the shows productive efficiency
Any point inside the curve shows inefficiency
Any point outside the curve is unobtainable
Any point on the curve has an opportunity costs
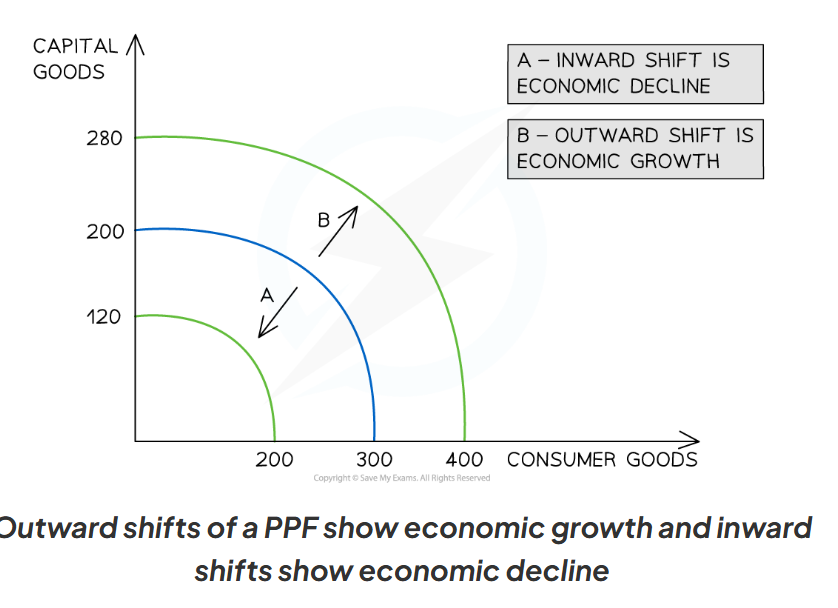
Explain the points on this diagram
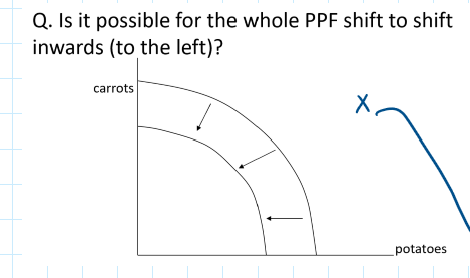
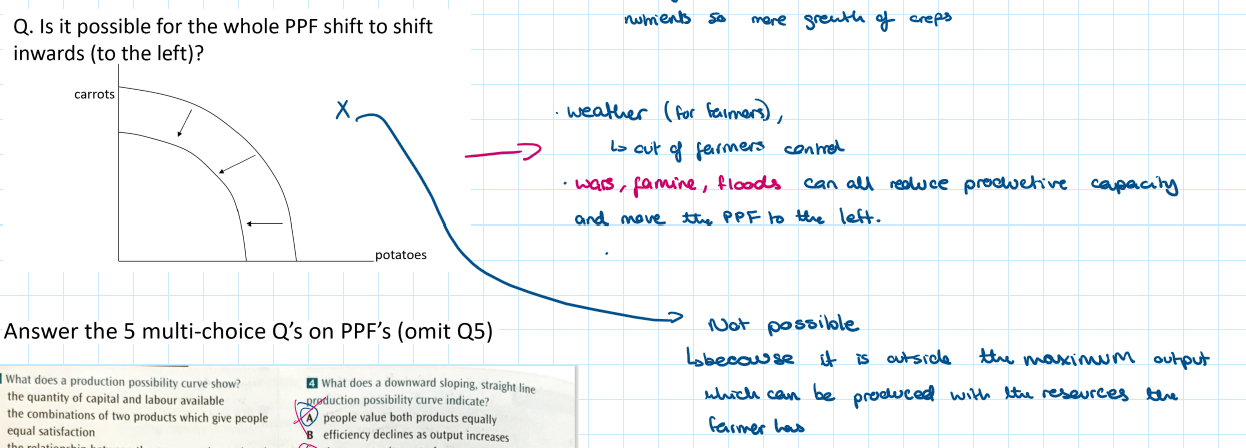
An inwards shift shows economic decline
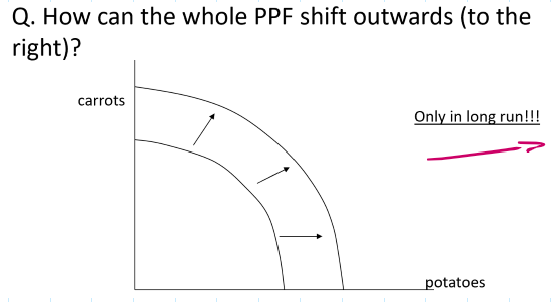
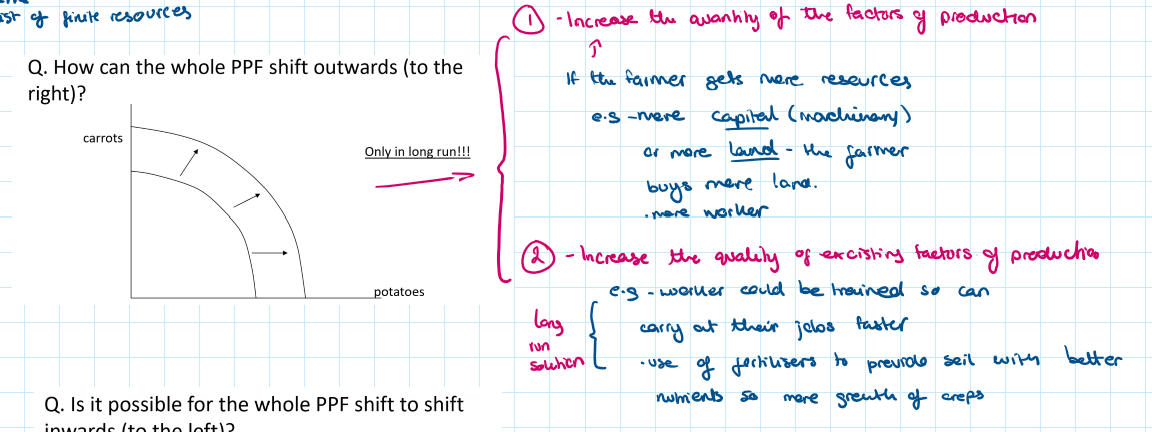
An outwards shift shows economic growth
Explain economic growth and how it is represented on a PPF
Economic growth occurs when there is an increase in the productive potential of an economy. This is demonstrated by an outwards shift in the curve. This means more consumer goods and more capital foods can now be produced using all the available resources. A shift is caused by an increase in the quantity or quality of resources.
Explain economic decline and how it is represented on a PPF
Economic decline occurs when there is any impact on an economy that reduces the quantity or quality of the available factors of production.
E.g the Japanese tsunami of 2011 devastated the production possibilities of Japan for many years, it shifted the PPF inwards and resulted in economic decline.