PSYC2012 Descriptive Stats & Normal Distribution
1/8
There's no tags or description
Looks like no tags are added yet.
Name | Mastery | Learn | Test | Matching | Spaced | Call with Kai |
|---|
No analytics yet
Send a link to your students to track their progress
9 Terms
Descriptive Stats
Methods of summarising/organising raw data which provide basic insight but no inferences
> Visualisation = box plots, frequency tables & histograms, bar charts, scatter plots, line graph
> Central Tendency & Spread
Measures of Central Tendency
1. Mean Balance point of distribution (2 decimal places). More sensitive to extreme scores so can be misleading representation of data.
2. Median The score that divides distribution in two equal parts (no. scores + 1 / 2).
3. Mode Highest frequency
Central Tendency & Skewness
- Mean is sensitive to extreme scores
- Mode & median are "robust"
- Skewness does not affect mode, median a bit, mean dragged furthest in direction of skew.
Measures of Variability/Spread/Dispersion
Range, IQR, Variance, SD
Range
> Calc R: Maximum - Minimum
> Calc IQR: Q3 - Q1 (median of top half - median of bottom half)
> Crude:
R Only sensitive to lowest/highest score
IQR Specifies spread of middle 50% but still only tells you about 75/25%
> Large range = large variability
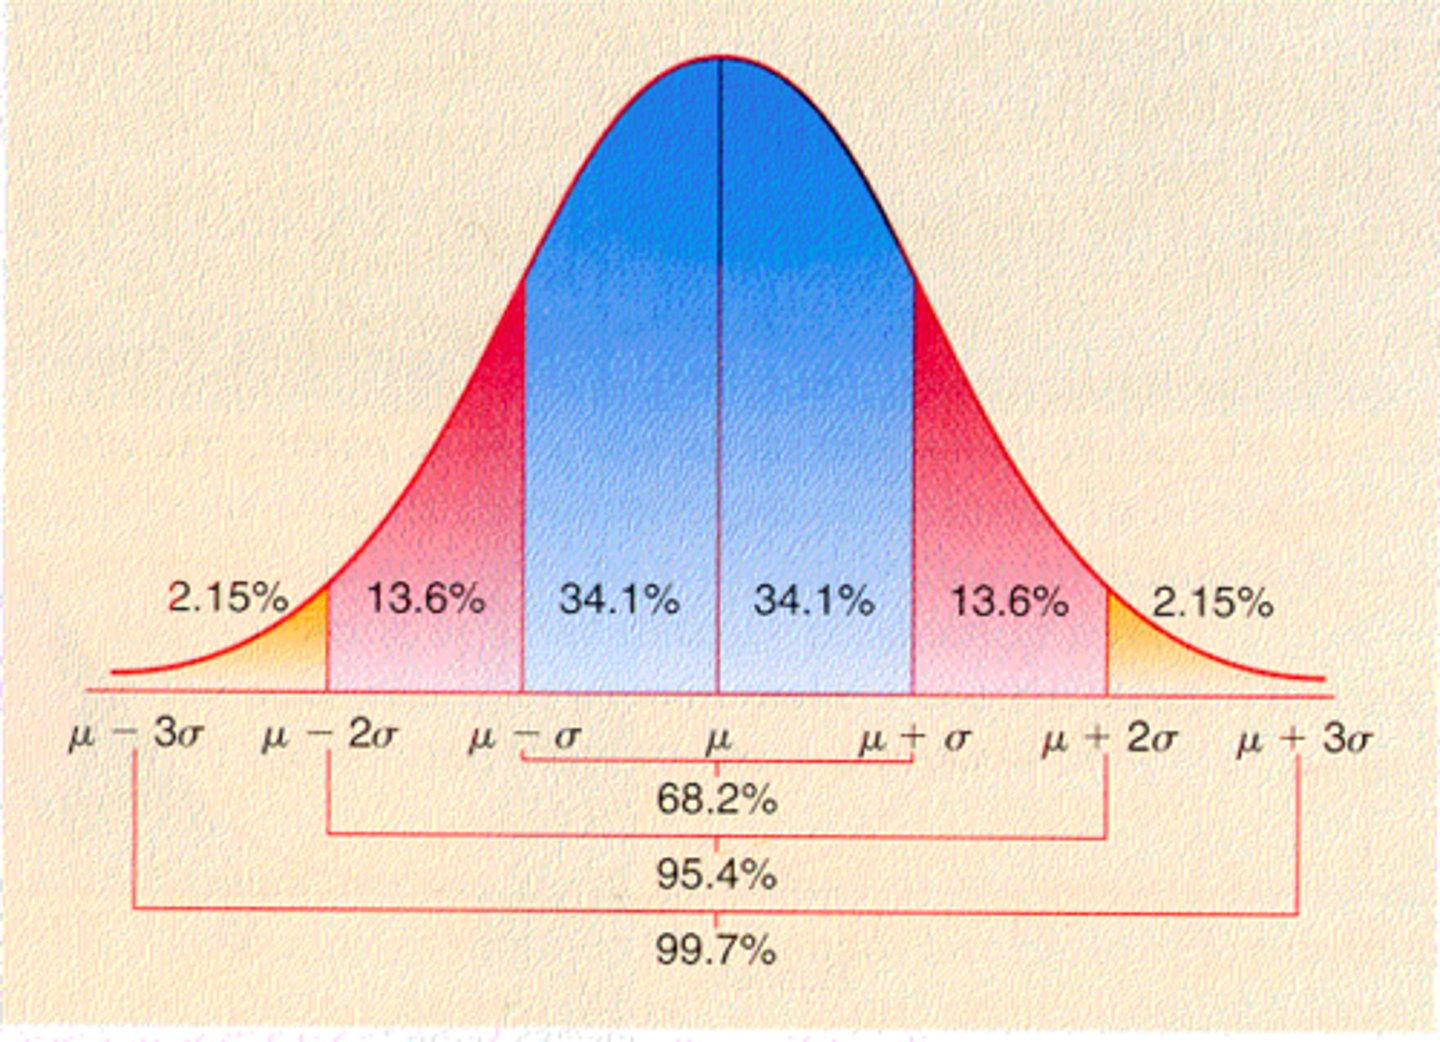
Normal Distribution
Symmetric (re central tendency), bell-shaped probability distribution where mean, median & mode share same value.
+- 1 SD = 68%
+- 2SD = 95%
+- 3SD = 99.7%
Variance (Population)
Measure of variability that describes an average distance of every score from the mean.
> Considers all values!
> Average squared deviation
Step 1: Find mean
Step 2: Find deviation scores
Step 3: Average deviation scores
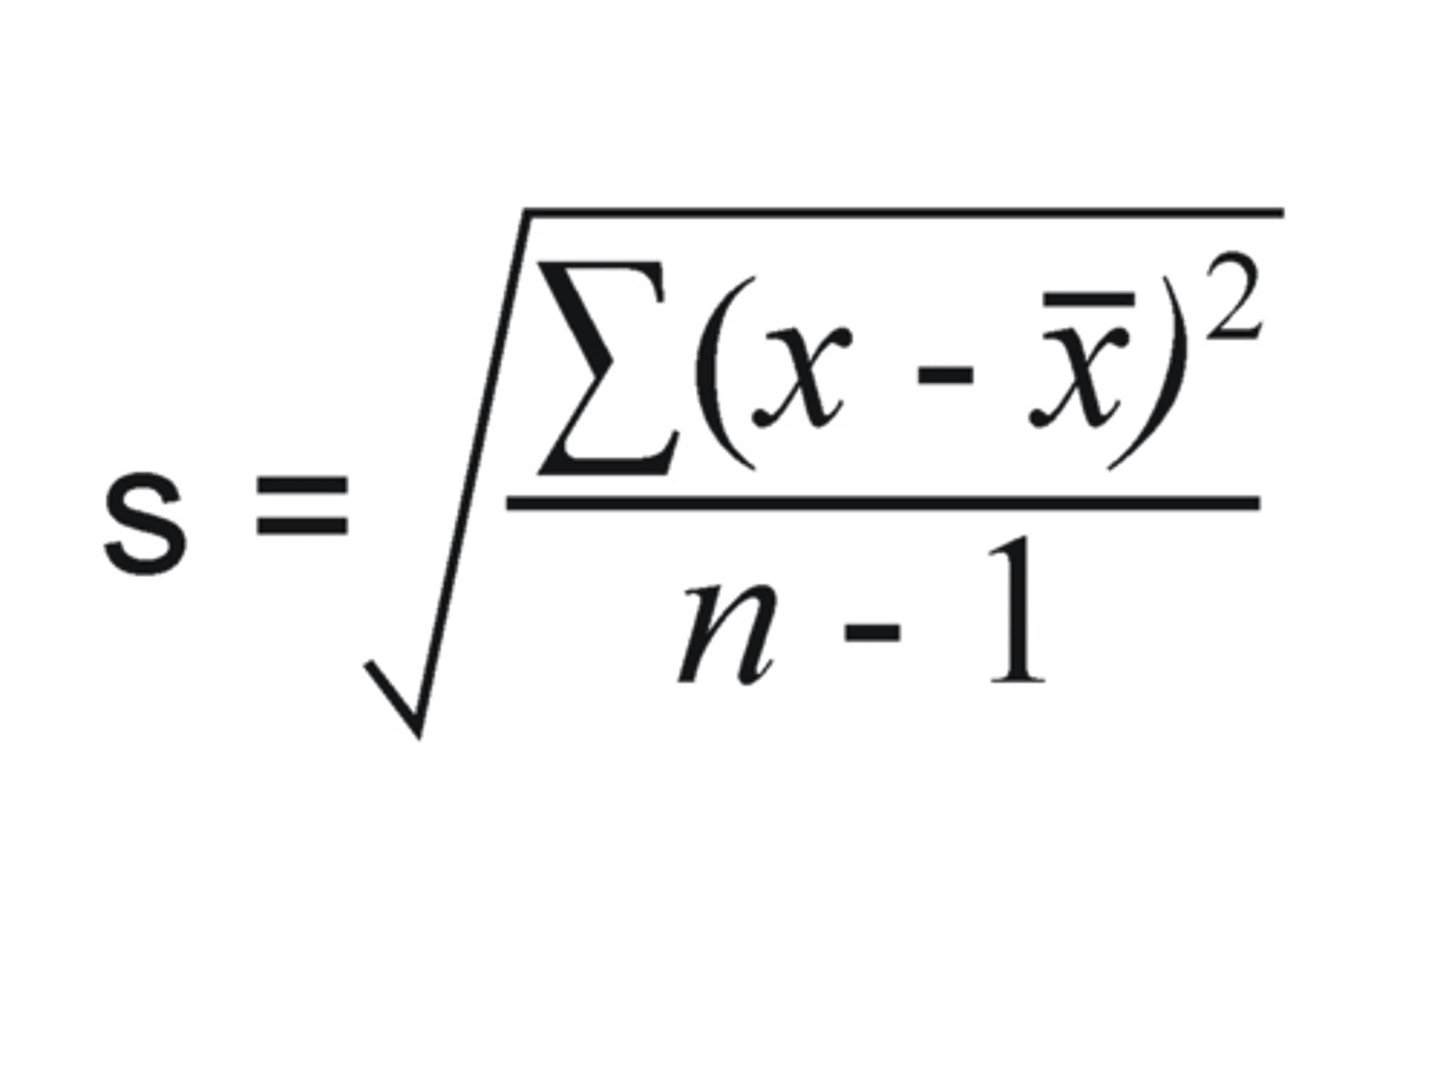
Standard Deviation
Measure of variability that describes an average distance of every score from the mean
> Considers all values!
> Square root of variance to obtain index of variability in original units
> Symbol = Sigma
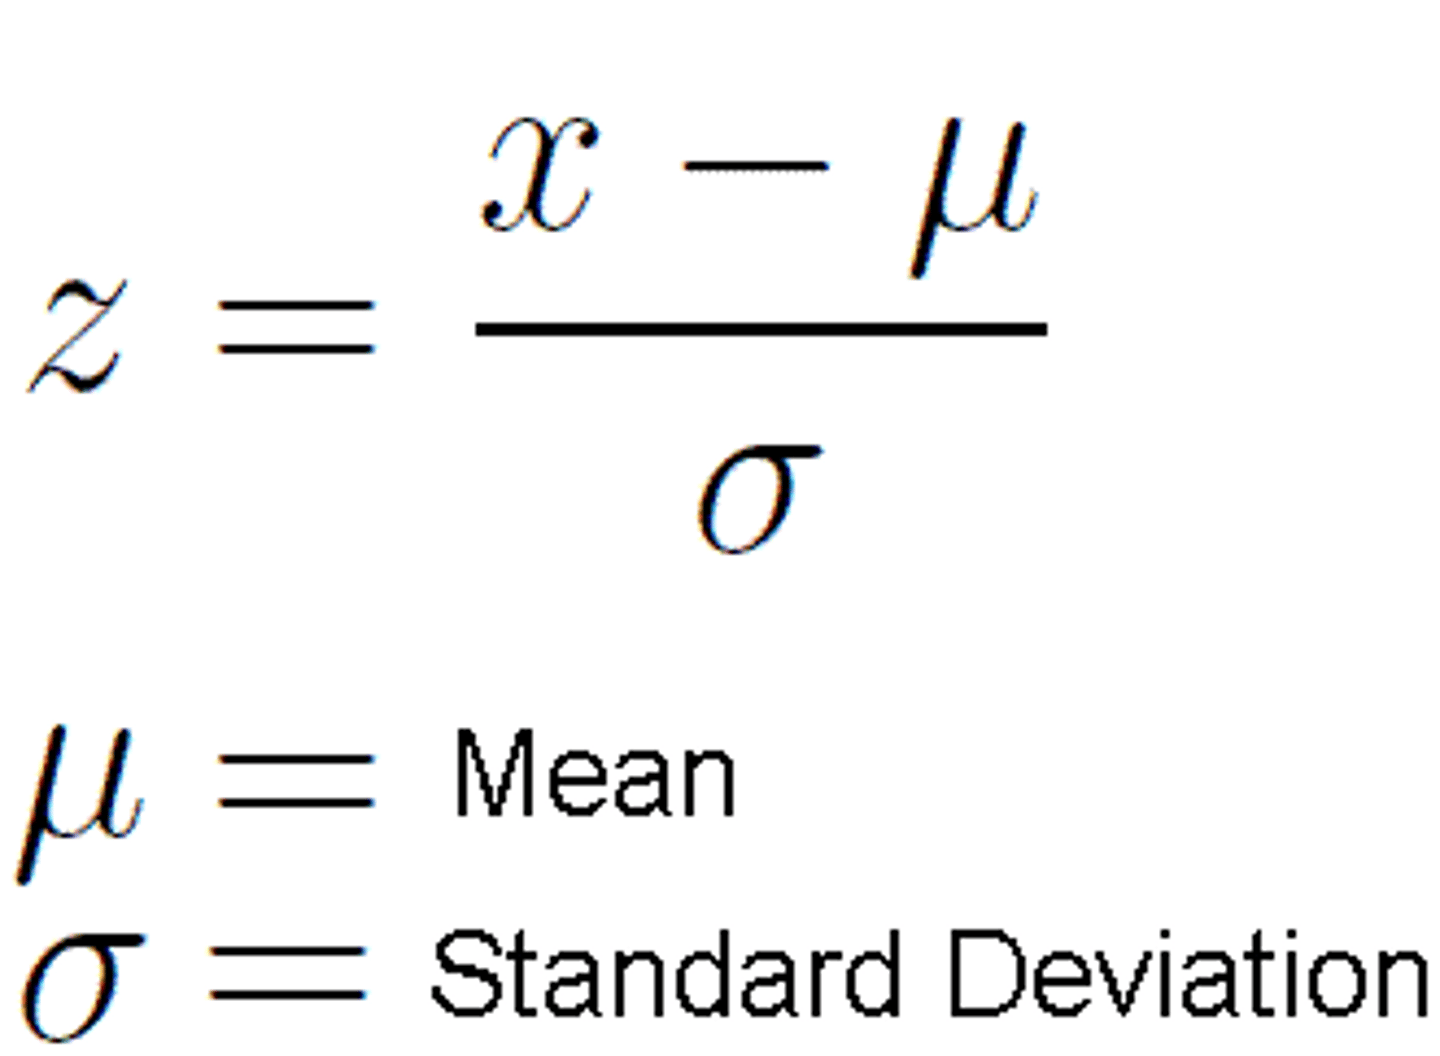
Z-Score
Standardised deviation score!
Calc: Deviation score / SD
NOTE: Z-score 0 = mean, +1,2,3 above average, -1,2,3 below average (SDs)
+ Strong index of relative standing: standardising = eval. data point regardless of the original distribution's mean or variance.
+ Allows comparison of different datasets with different scales (e.g. performance in Maths vs. Chem)
E.G. Z-scores useful bc misleading comparison occurs when raw scores use different units or when difficulty is unequal