Data science exam 3
1/8
There's no tags or description
Looks like no tags are added yet.
Name | Mastery | Learn | Test | Matching | Spaced | Call with Kai |
|---|
No analytics yet
Send a link to your students to track their progress
9 Terms
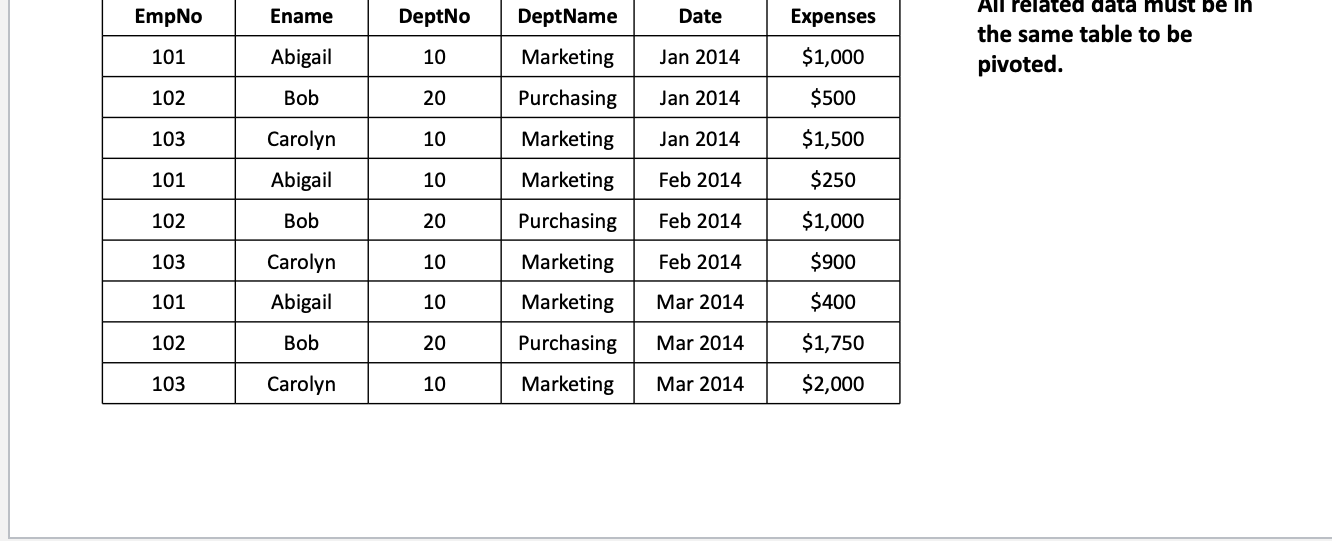
What are pivot tables? And how is data stored to be analyzed in a pivot table?
Must be stored in a structure, rows and columns format (a flat file or database table)
Pivot tables: a table of statistics that summarizes the data of a more extensive table (databases, spreadsheets etc). This summary might include sums, averages, or other statistics which the pivot table groups together in a meaningful way.”
Uses a flat file structure
All related data must be in the same table to be pivoted
Structured data? with examples
Structured data are recorded as well-defined fields that correspond to distinct variables
google sheets, microsoft excel files
Can be displayed in rows and column and relational databases
Numbers, data and strings
Easier to manage and protect with legacy solution
Unstructured data
natural languages writing, consist of a mishmash of semantic entities that can differ from an observation to another and it may not be clear what constitutes a separate observation in unstructured data
email, text files, social media posts, video, images, audio, sensor data etc
Cannot be displayed in rows and column and relational databases
Images, audio, video, word processing files, e-emails, spreadsheets, requires more storage
What is sentiment analysis? How does it work?
Sentiment analysis categorizes whether a statement is positive or negative and assigns it a score accordingly
Structured data
A form of predictive analytics, it predicts a sentiment score that a human elevator would likely give to the statement
• What is analytics? How is analytics related to Big Data?
Analytics is about extracting information from data by discovering meaningful patterns, but analytics information can have different status with respect to our actions.
Analytics relates to Big Data by providing the tools and techniques (like Apache Hadoop or Spark) to process massive, high-velocity, diverse datasets (structured/unstructured) that are too complex for traditional methods, unlocking insights such as customer behavior, operational efficiency, and future forecasts.
What is the difference between descriptive, predictive, and prescriptive analytics?
▪ Give examples of each.
o What are the uses of forecasting? Give an example.
Descriptive analytics summarizes and helps understand past data Descriptive analytics
Predictive analytics predicts values for data points we do not have, if these data points are in the future we call this forecasting Insight
Prescriptive analytics facilitate a decision-making directly by suggesting an action Foresight
• What is machine learning?
Machine learning is a broad category of techniques to learn model parameters from data so that the model can be used to predict values or classify items, this can be called traditional or discriminative AI
What is pivot table analysis?
A data summarization technique that quick;y reorganizes, aggregates and analyzes large datasets in spreadsheets
What is an interactive dashboard?
A dynamic data visualization tool that allows users to actively explore, filter, and manipulate data in real time to gain insights.