Psych 240 final
1/74
There's no tags or description
Looks like no tags are added yet.
Name | Mastery | Learn | Test | Matching | Spaced | Call with Kai |
|---|
No analytics yet
Send a link to your students to track their progress
75 Terms
(Ho) Null Hypothesis
The normal state of affairs, in which there is nothing interesting going on
(Ha) Alternative Hypothesis
A change from the normal state of affairs
Null hypothesis significance testing (NHST)
the procedure by which we decide whether to reject the null hypothesis, in favor of the alternative
P value
p<0.05 reject the null
p>0.05 fail to reject the null
p hacking
when researchers "hack" their results to lower p values to achieve statistical significance
Type 1 error
rejecting the null when the null is actuall true
Type 2 error
failing to reject the null when the null is false
power
the probability that my study will successfully reject the null if the null is actually false
effect size
used to refer to how wrong the null is. it would be the difference between true possibility of flipping heads and our null value of 0.05
The sampling distribution of the mean
a probability distribution created by taking all possible random samples of a fixed size from a population and plotting their means
Population mean: Quantity
N
Population mean: mean
Population mean: variance
Population mean: sd

Sample mean: quantity
n
Sample mean: mean
Sample mean: variance

Sample mean: sd
Standard Error of the mean (SEM)
the standard deviation of a sampling distribution
Central Limit Theorem
The theory that, as sample size increases, the distribution of sample means of size n, randomly selected, approaches a normal distribution.
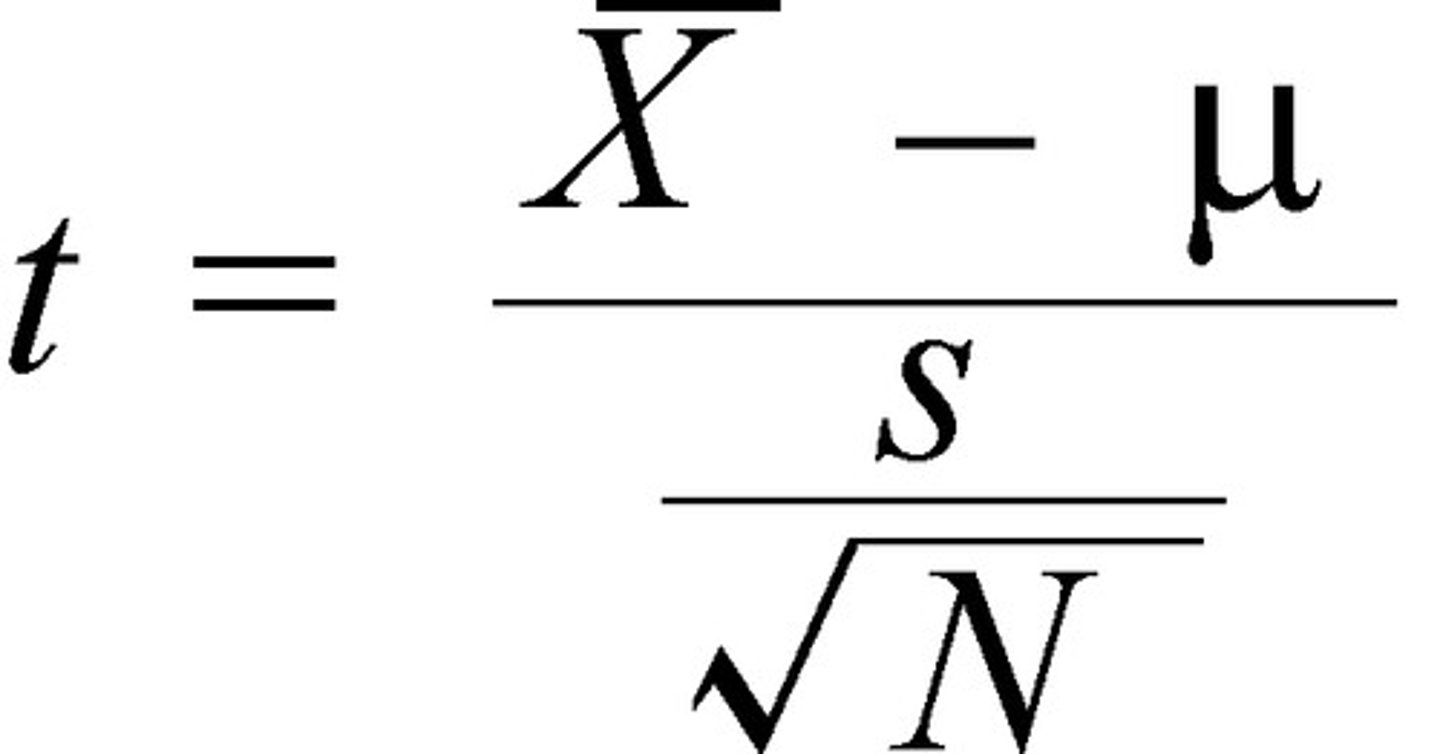
1 sample t test
When the null hypothesis is about the value of a single mean
matched pairs t test
when the null hypothesis is about the mean difference between 2 measurements from each individual
2 sample t test
when the null hypothesis is about the differences between 2 population means
1 way anova
when the null hypothesis is about the differences between multiple (3 or more) population means
2 way anova
when the null hypothesis is about differences between multiple population means, with 2 grouping variables
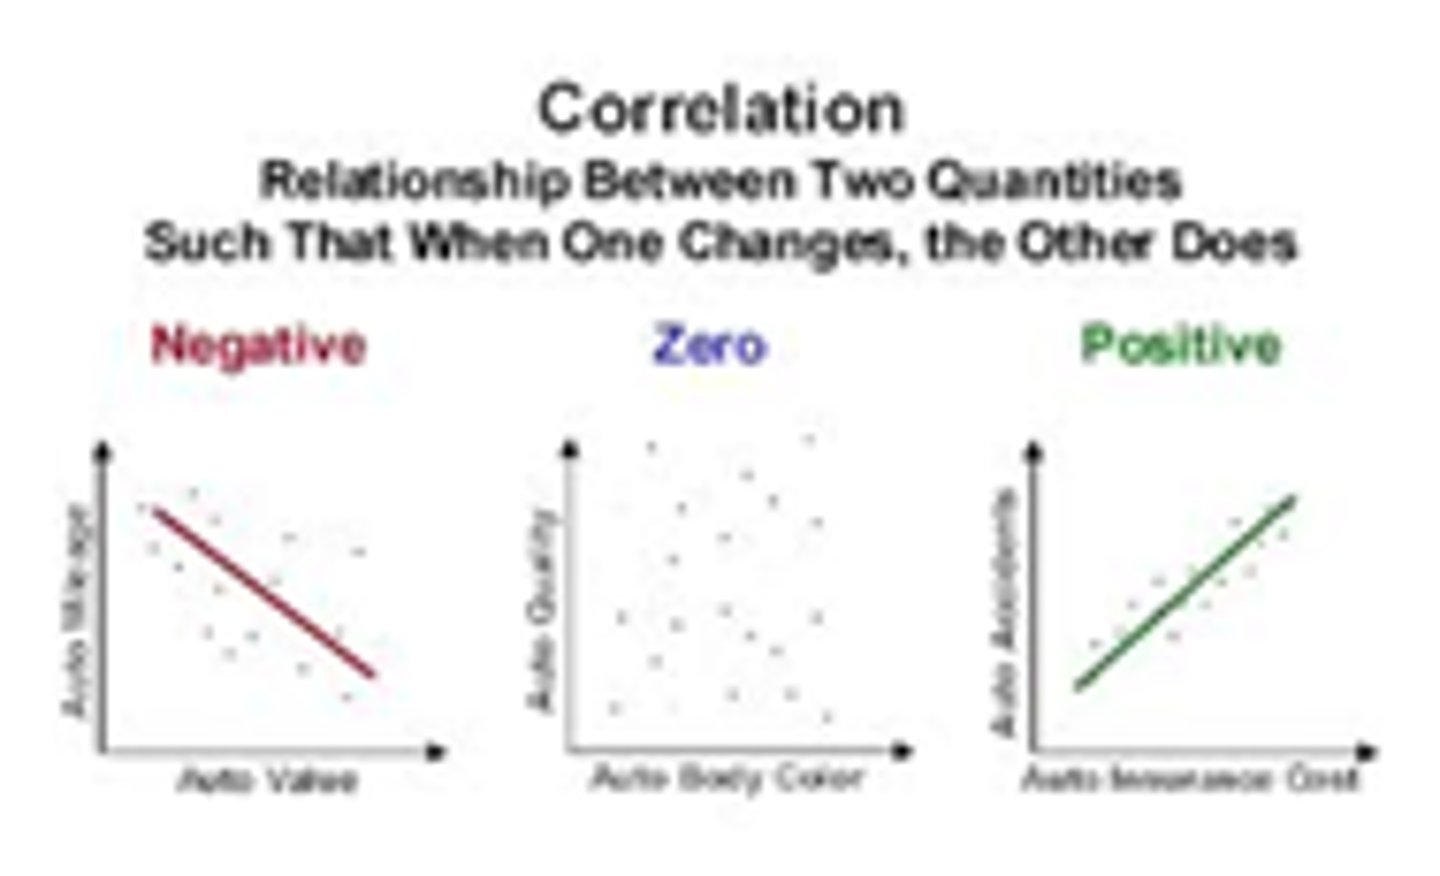
correlation/regression
relationship between two quantitative variables
binomial test
a method used to determine if the observed proportion of successes in a sample differs significantly from an expected population probability
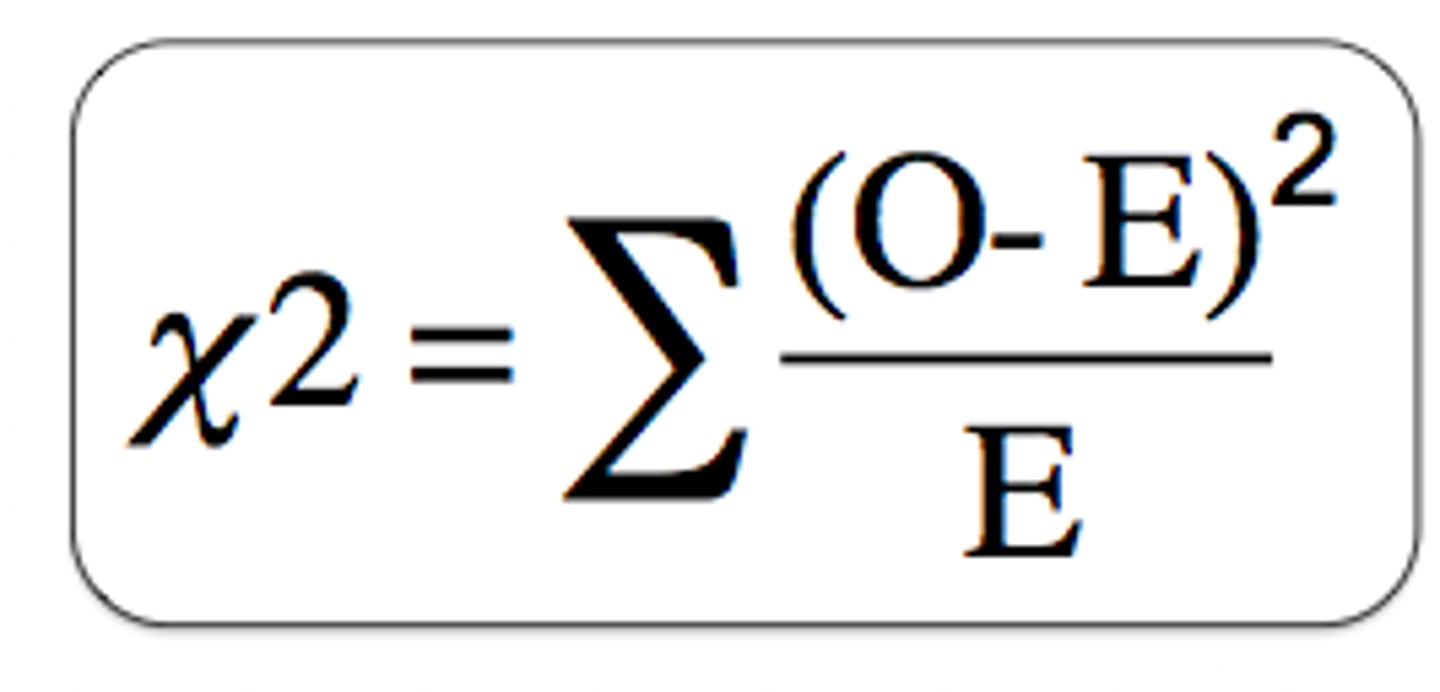
chi square test for goodness of fit
used when null hypothesis is about the distribution of a categorical variable
chi-square test of independence
used when the null hypothesis is about the independence of 2 categorical variables
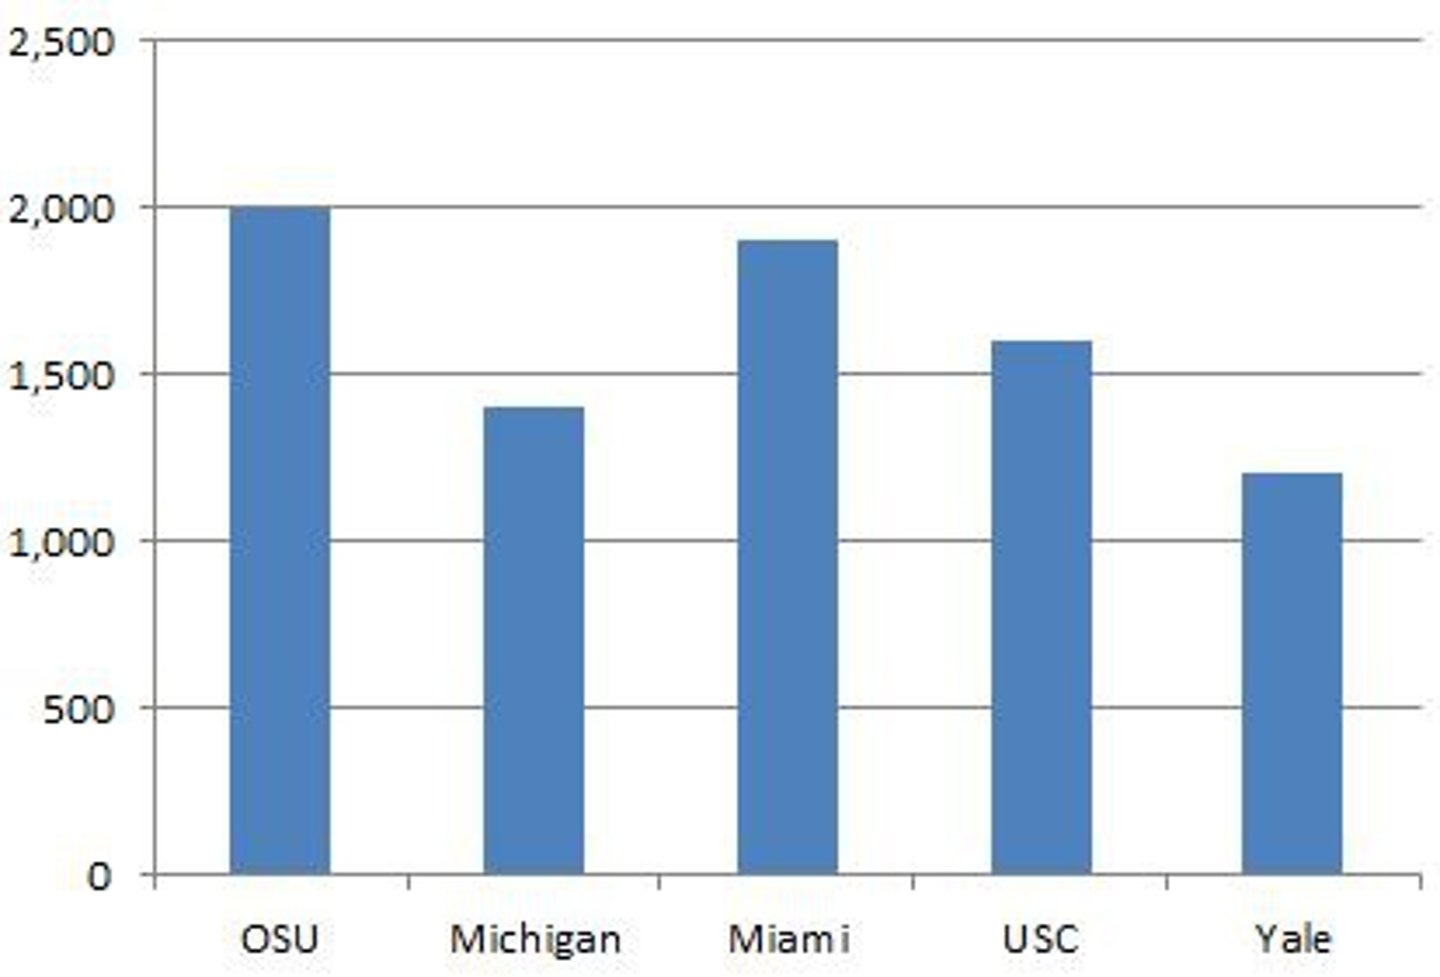
barplot
to compare numerical values across diff categories
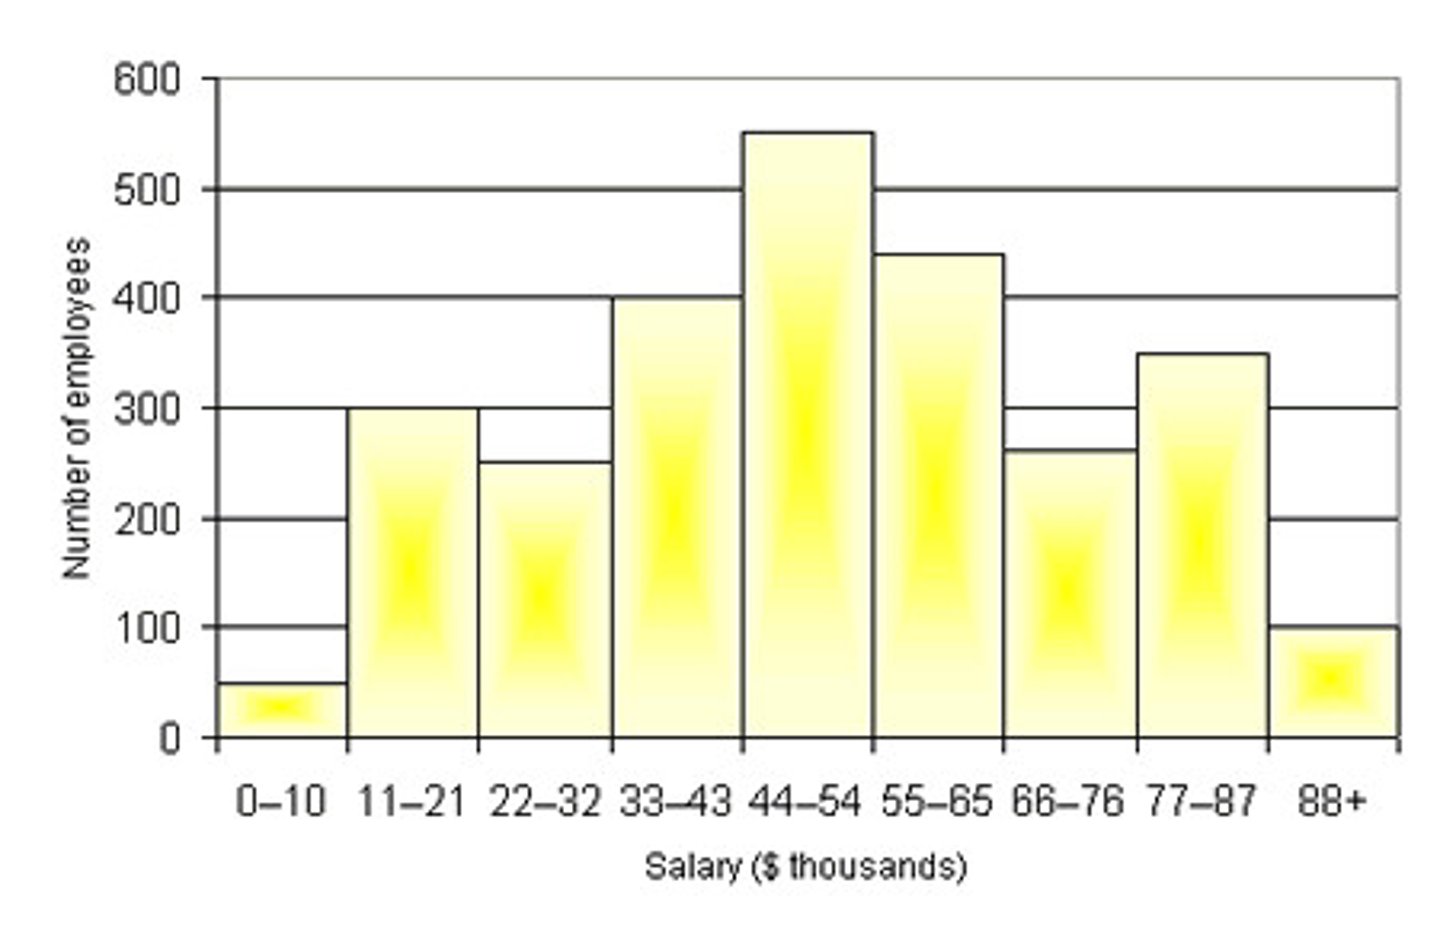
histogram
to visualize the distribution, shape, center, and spread of large continuous numerical datasets
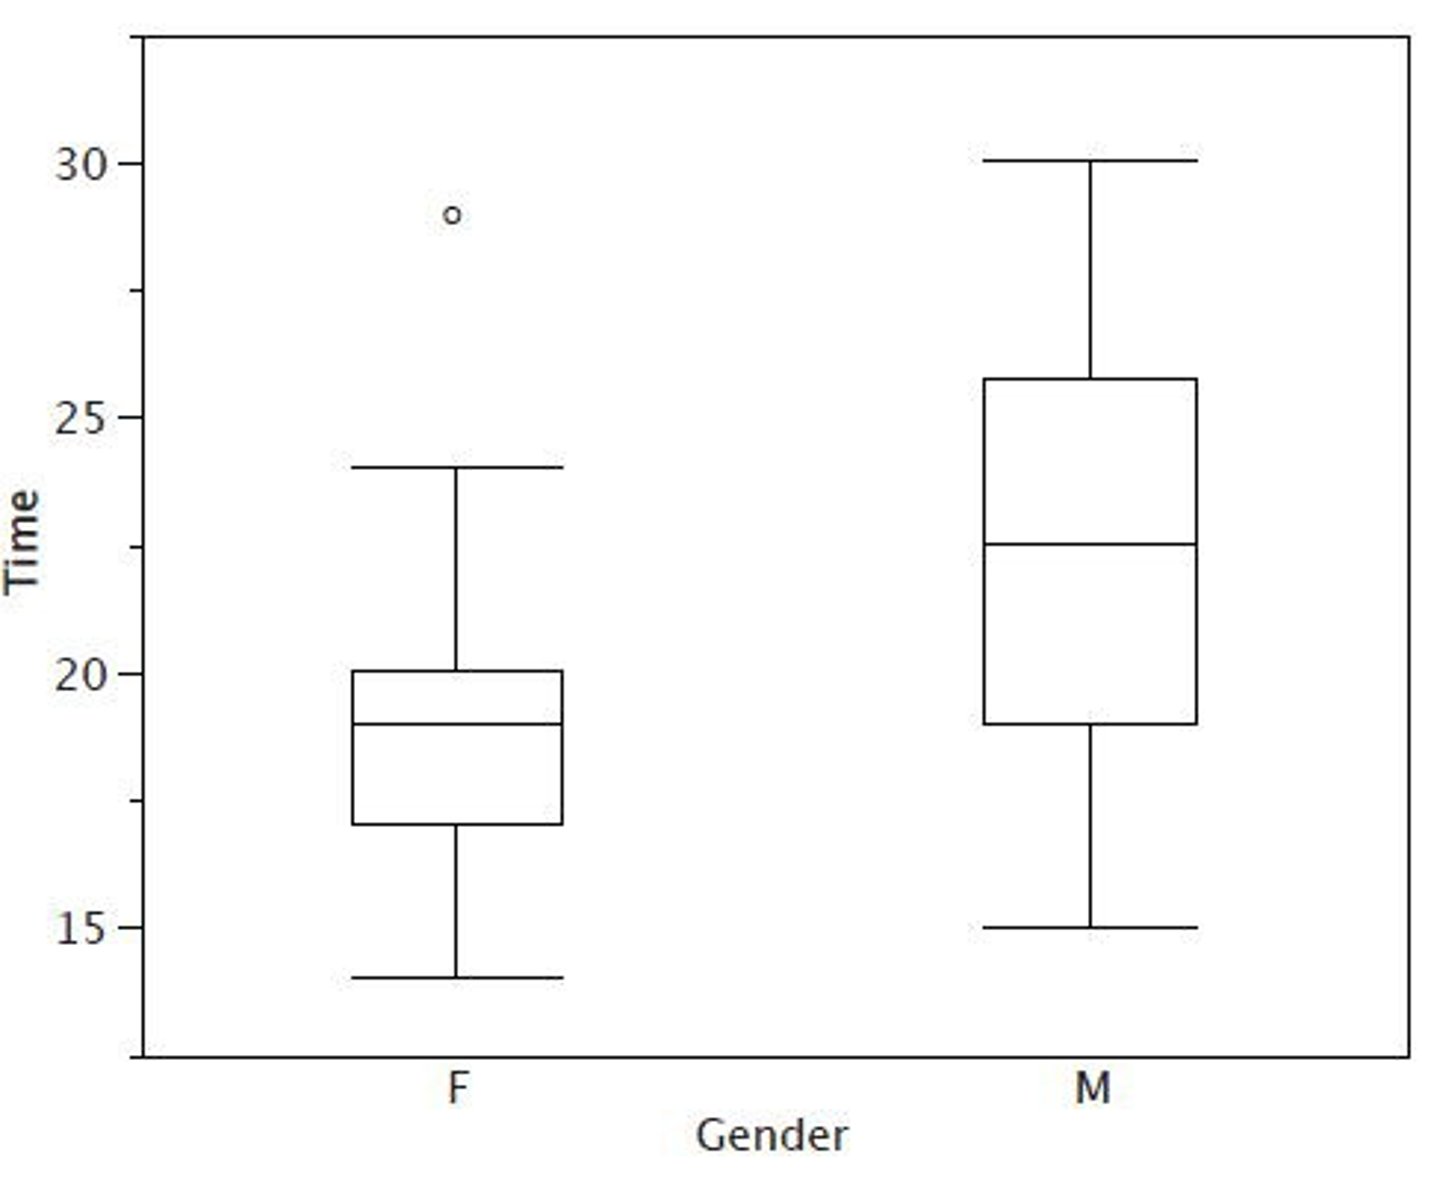
boxplot
to visualize the distribution of numerical data when comparing multiple groups
plot of discrete probability distribution
to visualize and analyze the likelihood of specific, countable outcomes for a random variable
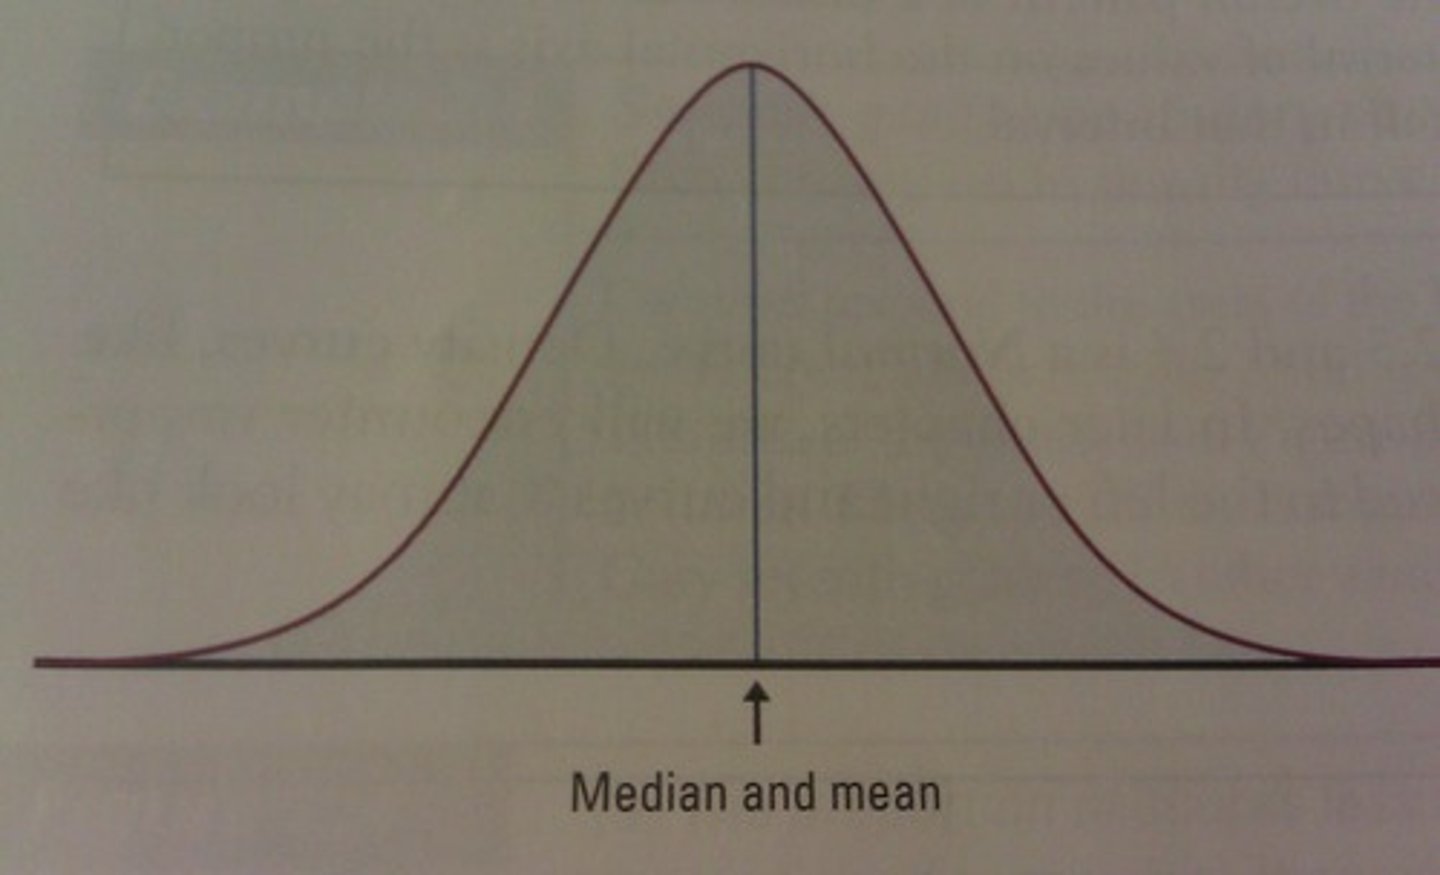
density curve
Graph of a continuous probability distribution
plot of group means with error bars
to visualize the mean value of different categories of experimental groups while showing the precision of that estimate of the variability of the data.
scatterplot
to visualize the relationship, correlation, and patterns between 2 numerical variables
t stat (1 sample)
t stat (2 sample)

chi square equation
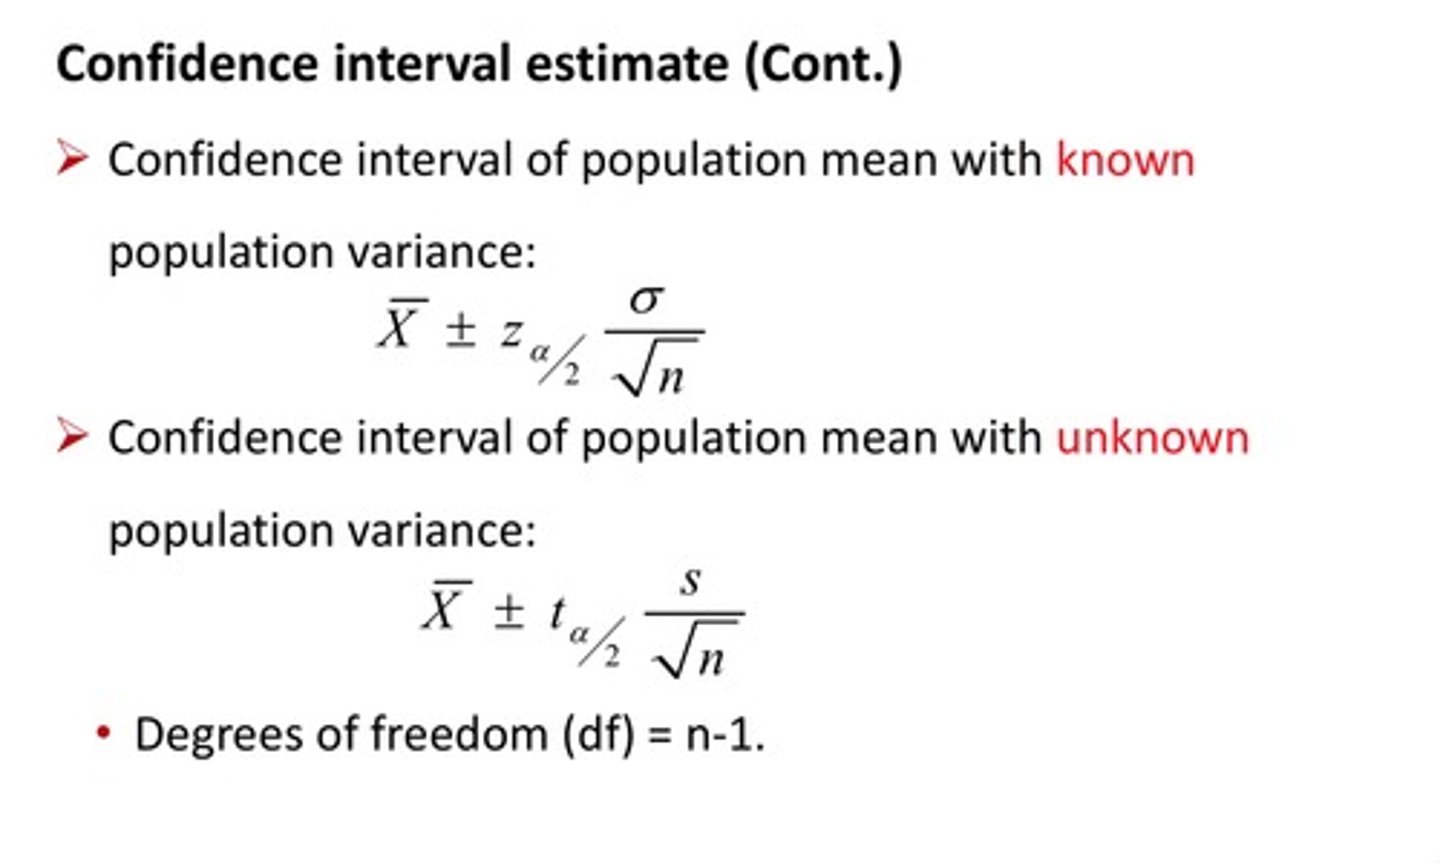
confidence interval
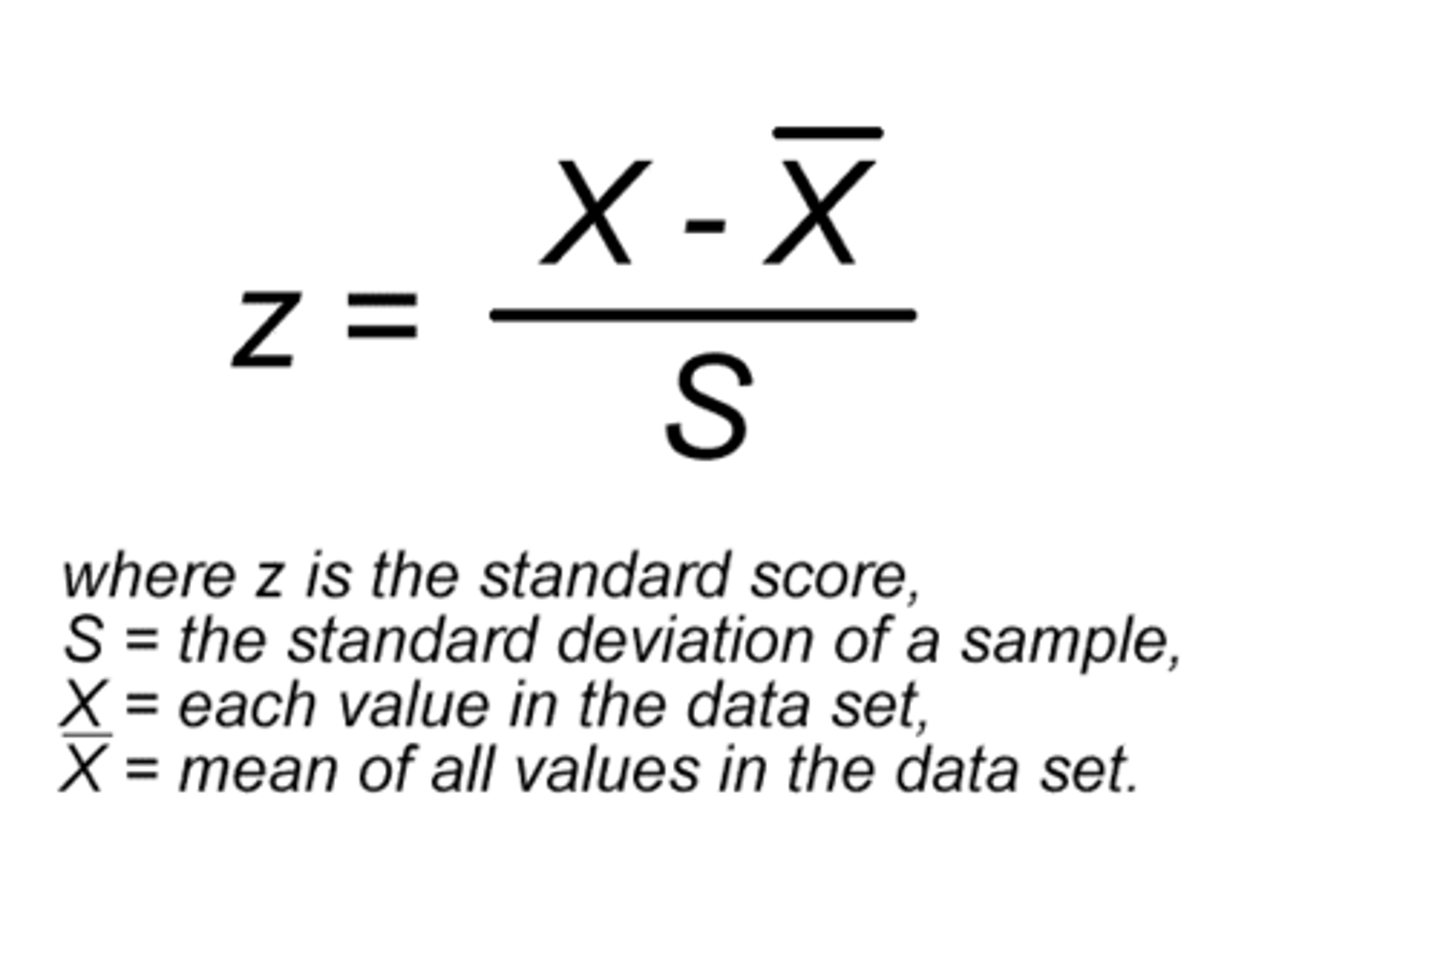
Z score
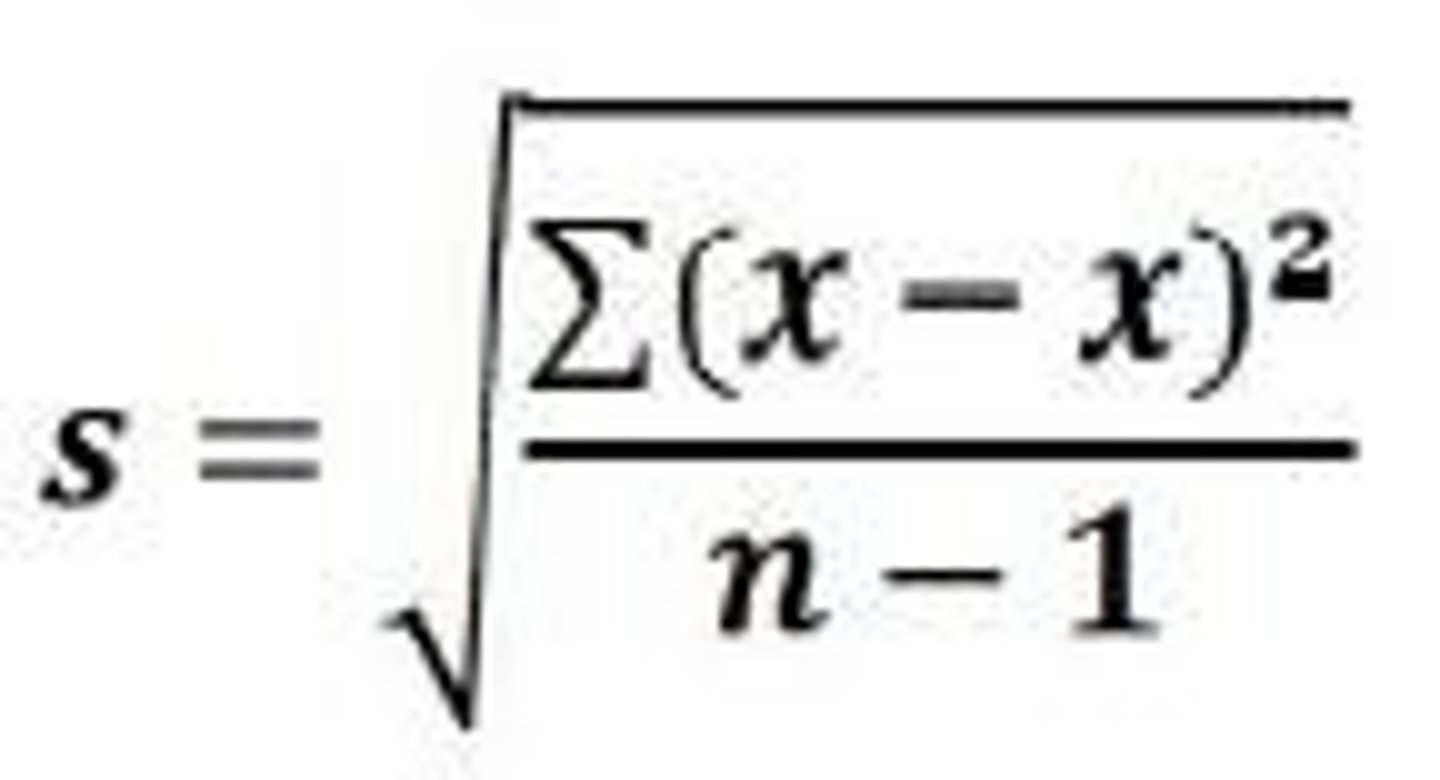
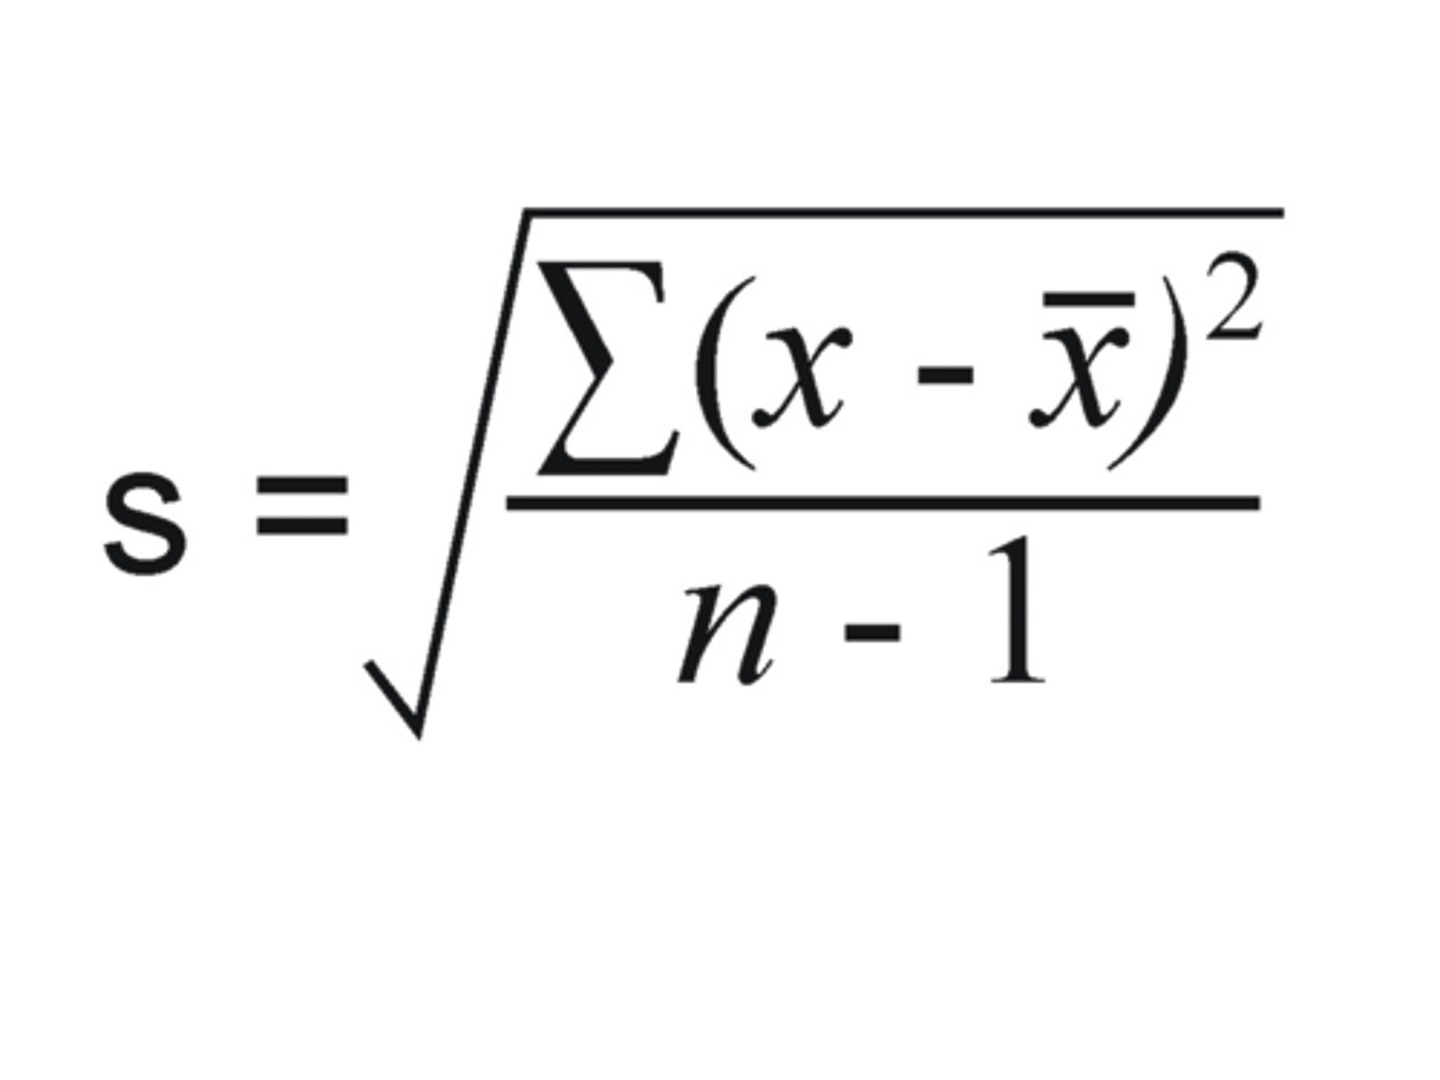
standard deviation
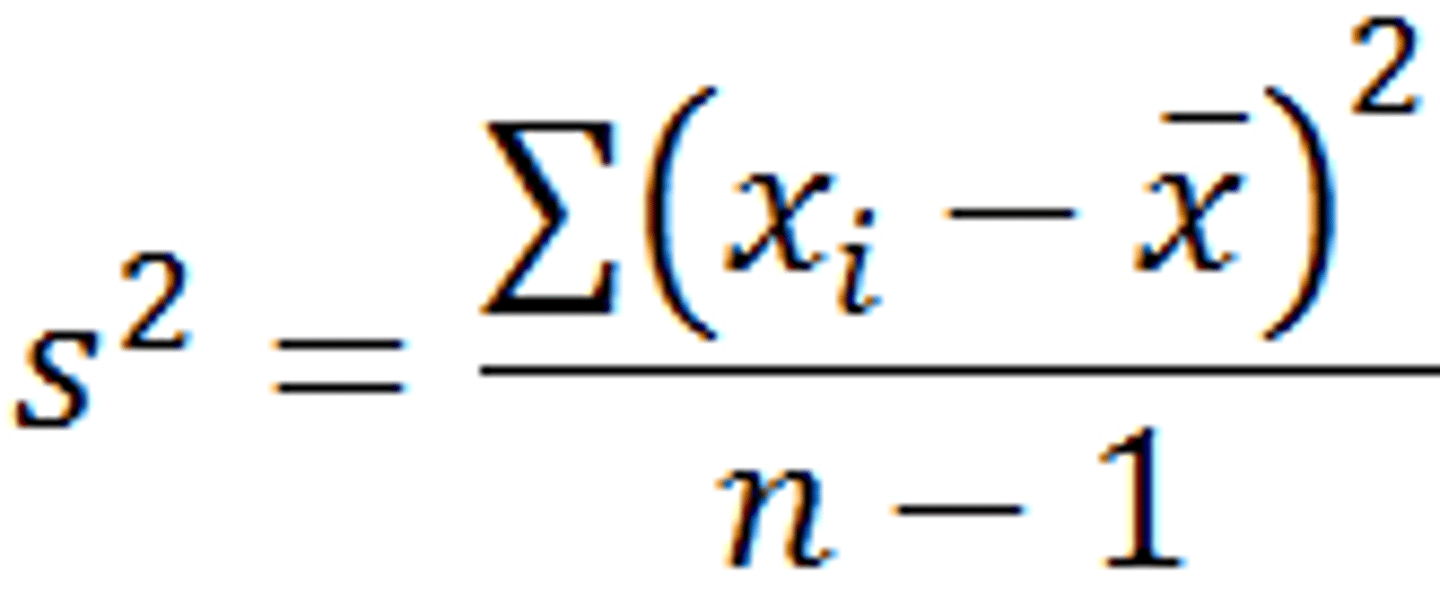
variance
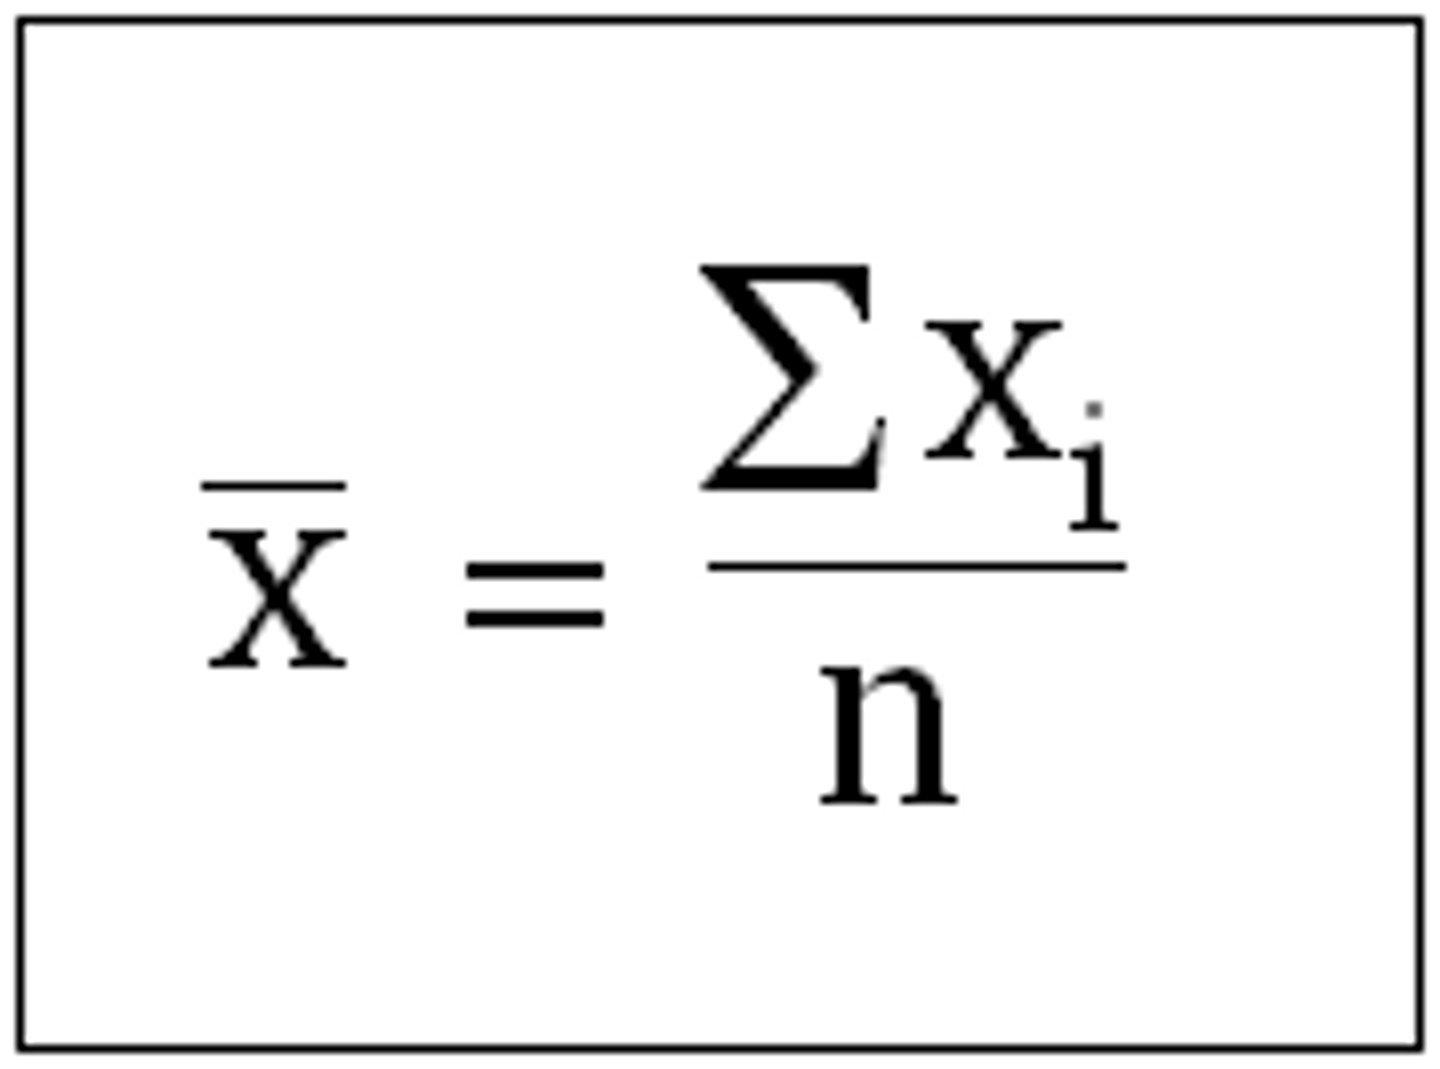
mean
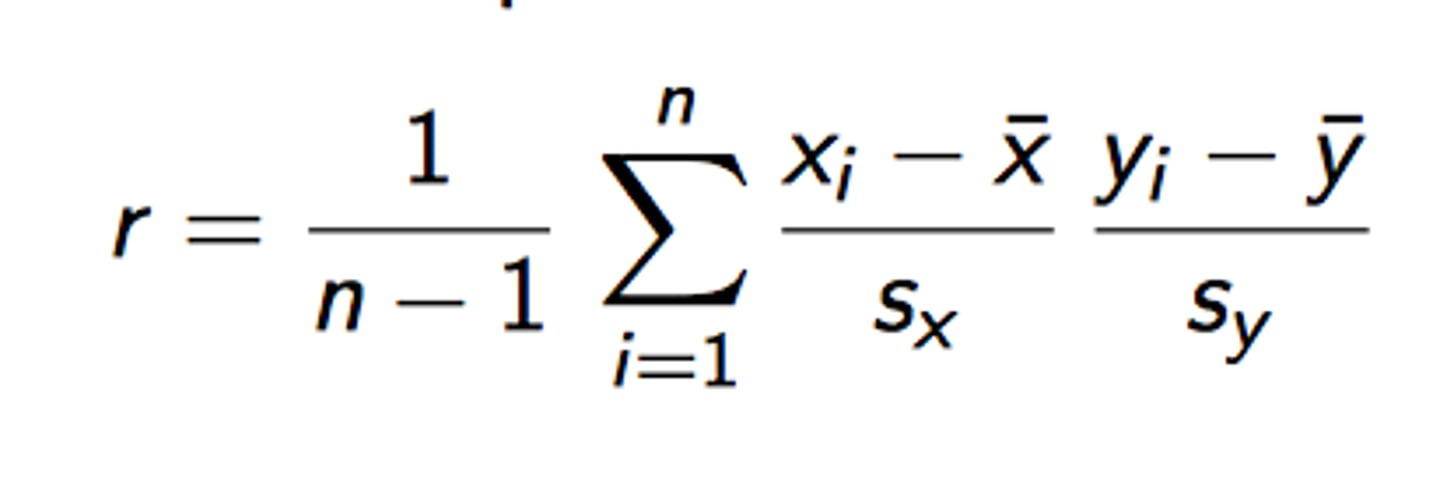
correlation coefficient r
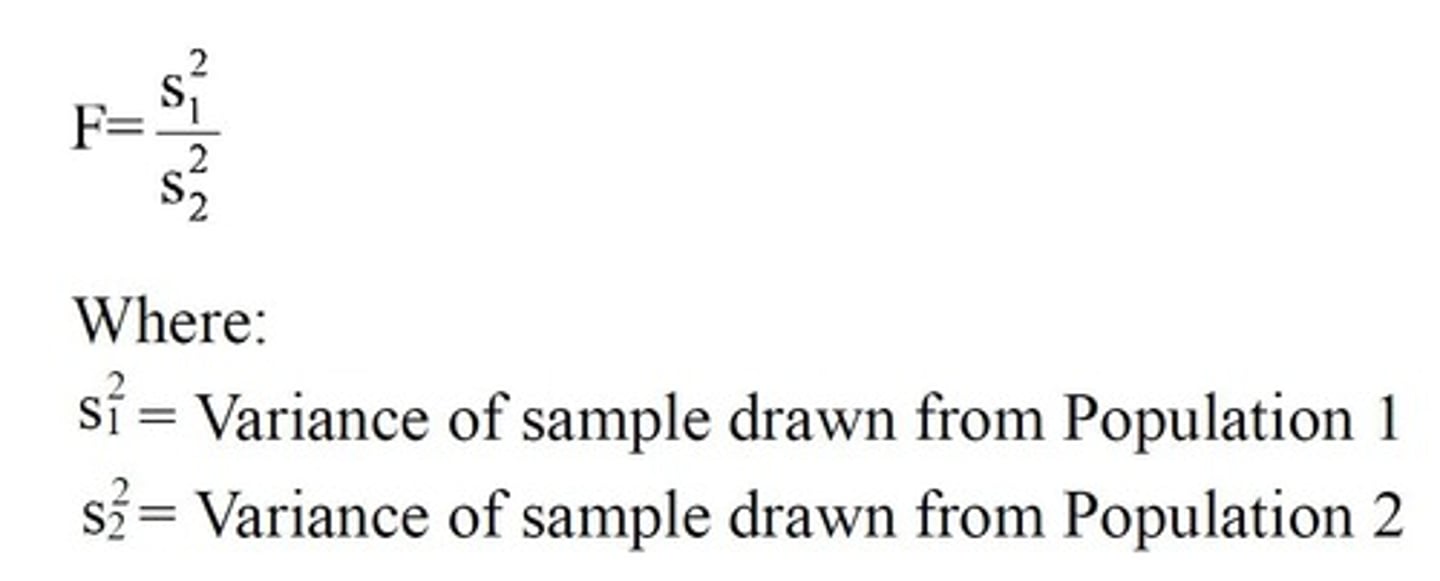
F test statistic
descriptive statistics
numerical data used to measure and describe characteristics of groups. Includes measures of central tendency and measures of variation.
inferential statistics
numerical data that allow one to generalize- to infer from sample data the probability of something being true of a population
quantitive variable
a characteristic that can be measured numerically (height, age, number of things)
categorical variable
places an individual into one of several groups or categories (color, blood type)
discrete variable
a quantitative variable that has either a finite number of possible values or a countable number of possible values (number of children in classroom)
continuous variable
a quantitative variable that has an infinite number of possible values that are not countable (age, temp.)
ordinal scale
a scale of measurement in which the measurement categories form a rank order along a continuum (survey satisfaction rating)
interval scale
A quantitative measurement scale that has no "true zero," and in which the numerals represent equal intervals (distances) between levels (e.g., temperature in degrees).
ratio scale
measurement that has a natural, or absolute, zero and therefore allows the comparison of absolute magnitudes of the numbers (10 degrees is half is warm as 20 degrees)
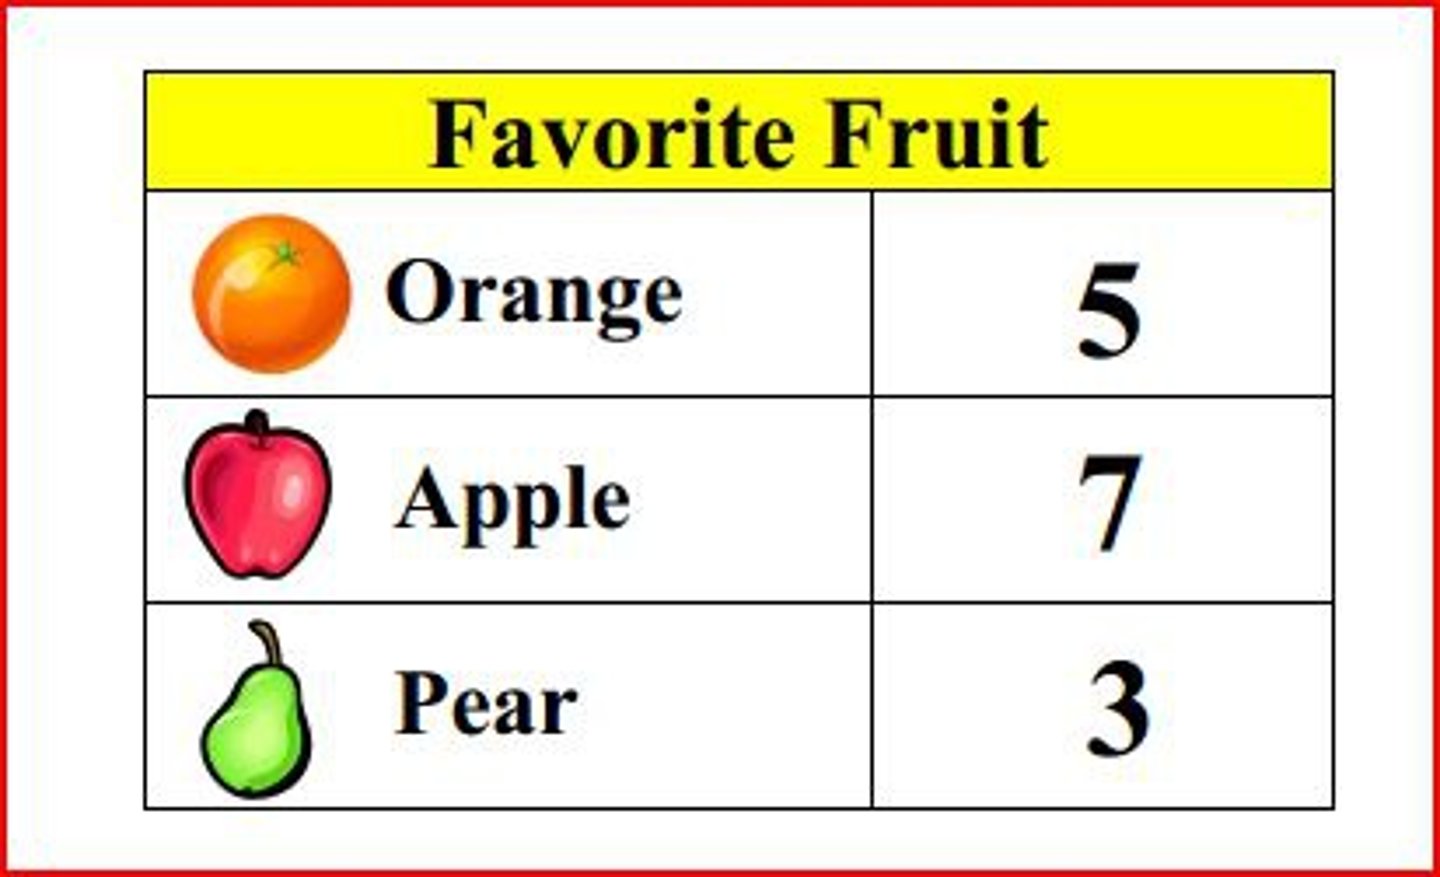
frequency table
A table used to show the number of times something occurs.
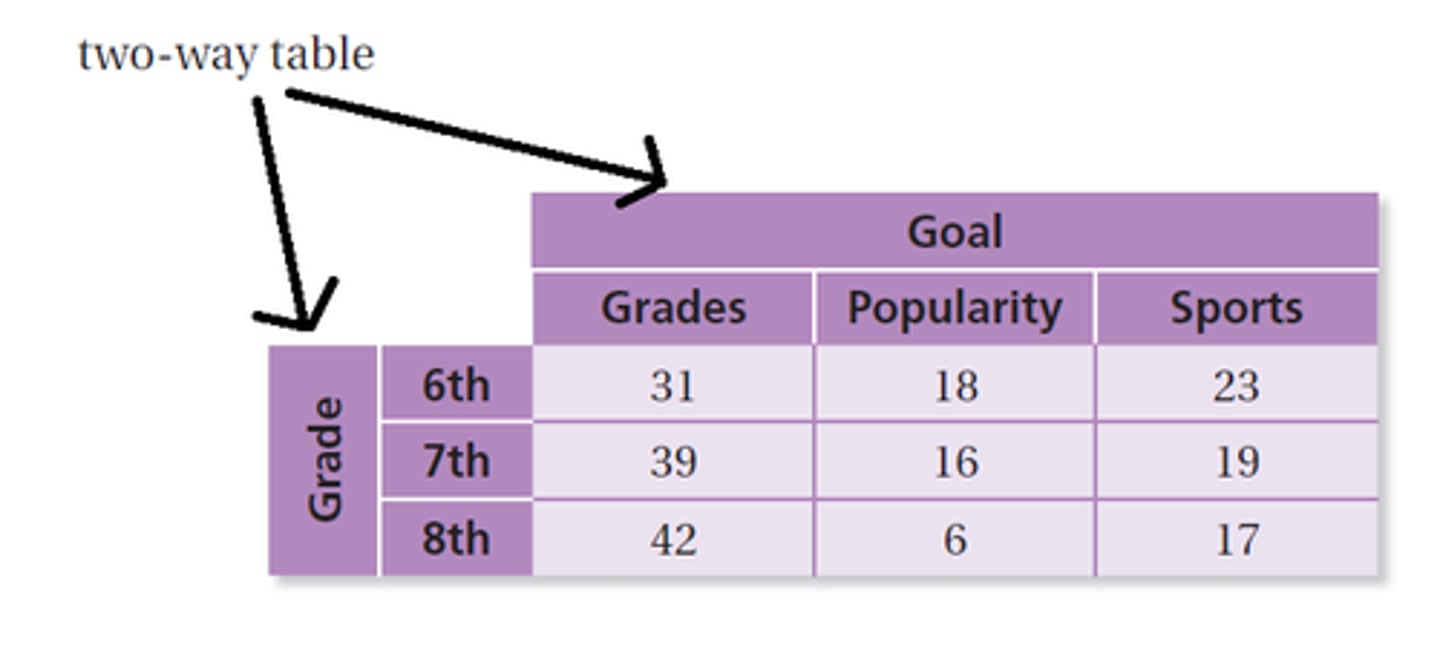
contingency table
Table displaying frequency distribution of variables.
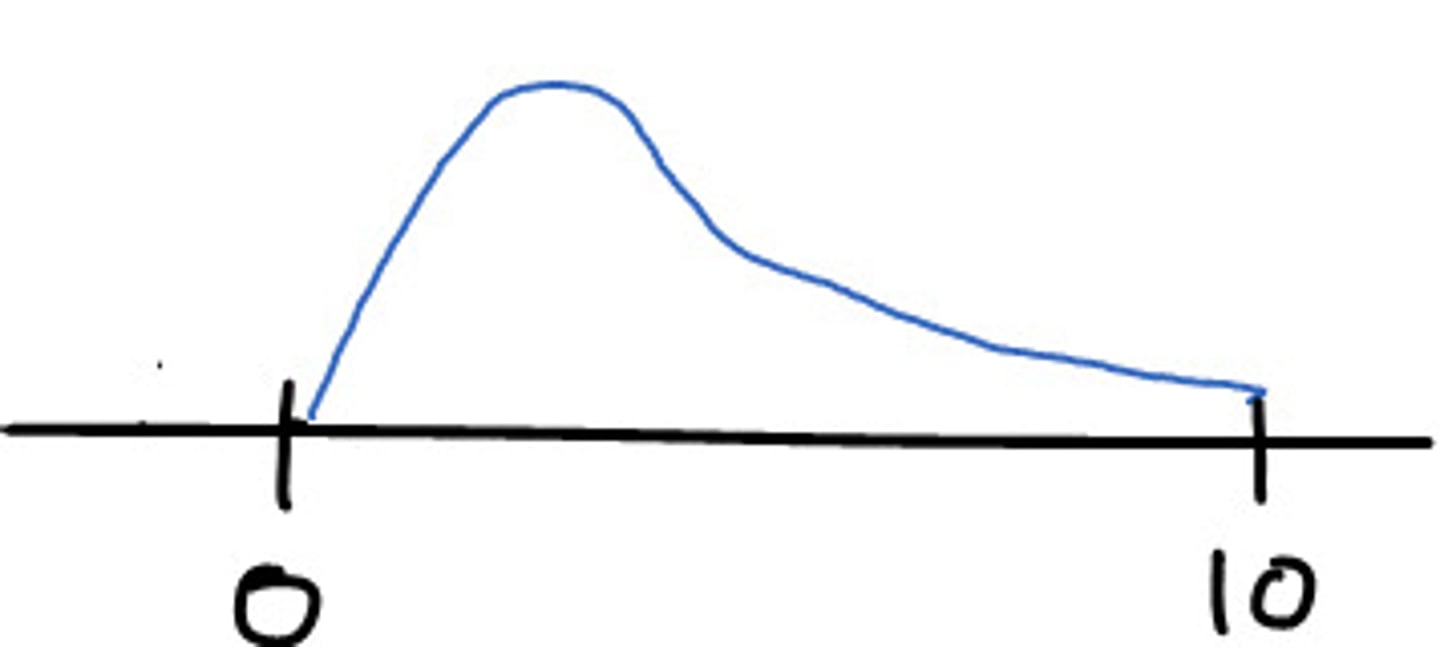
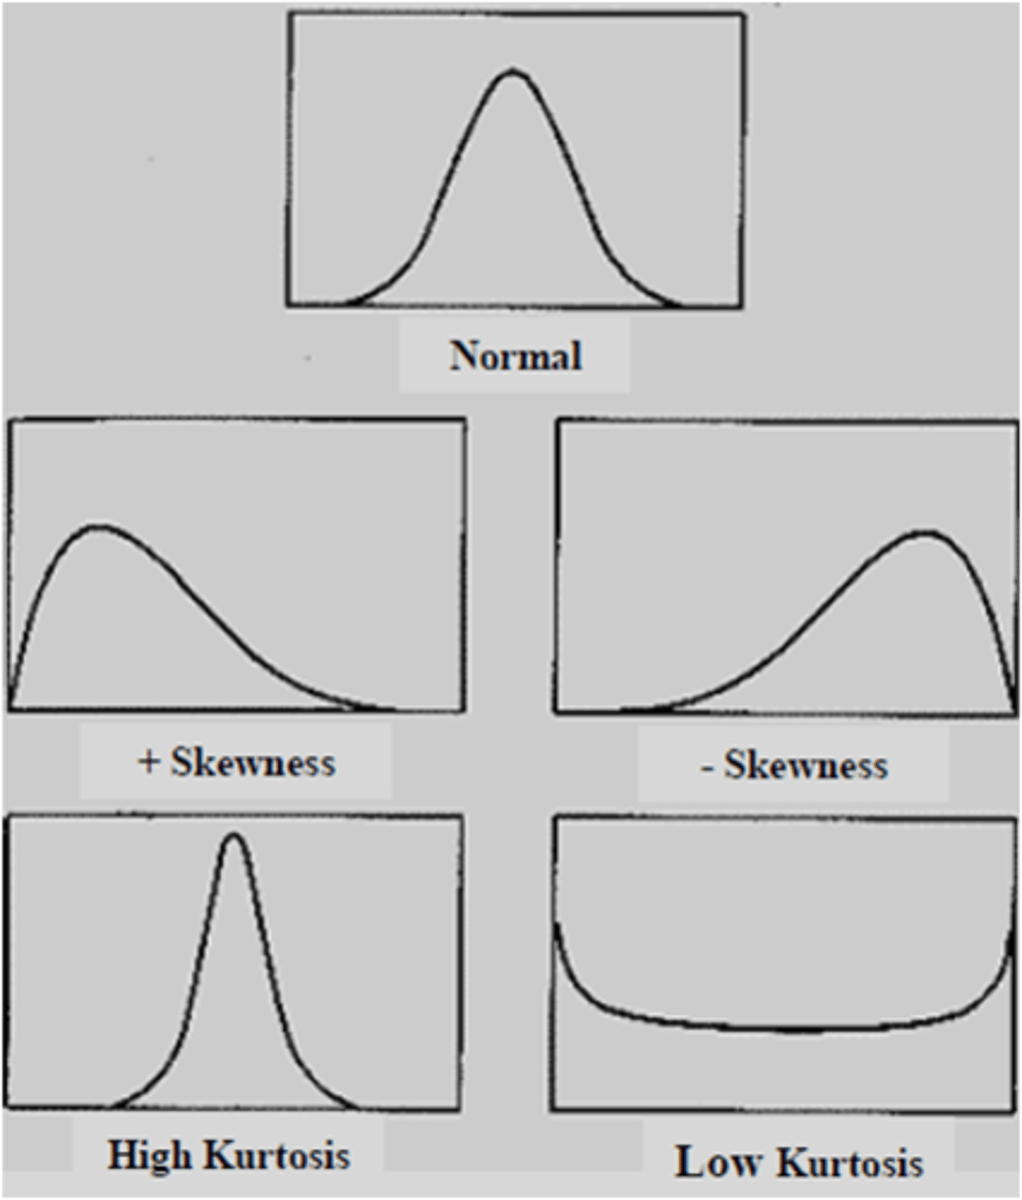
right skew
mean is greater than median
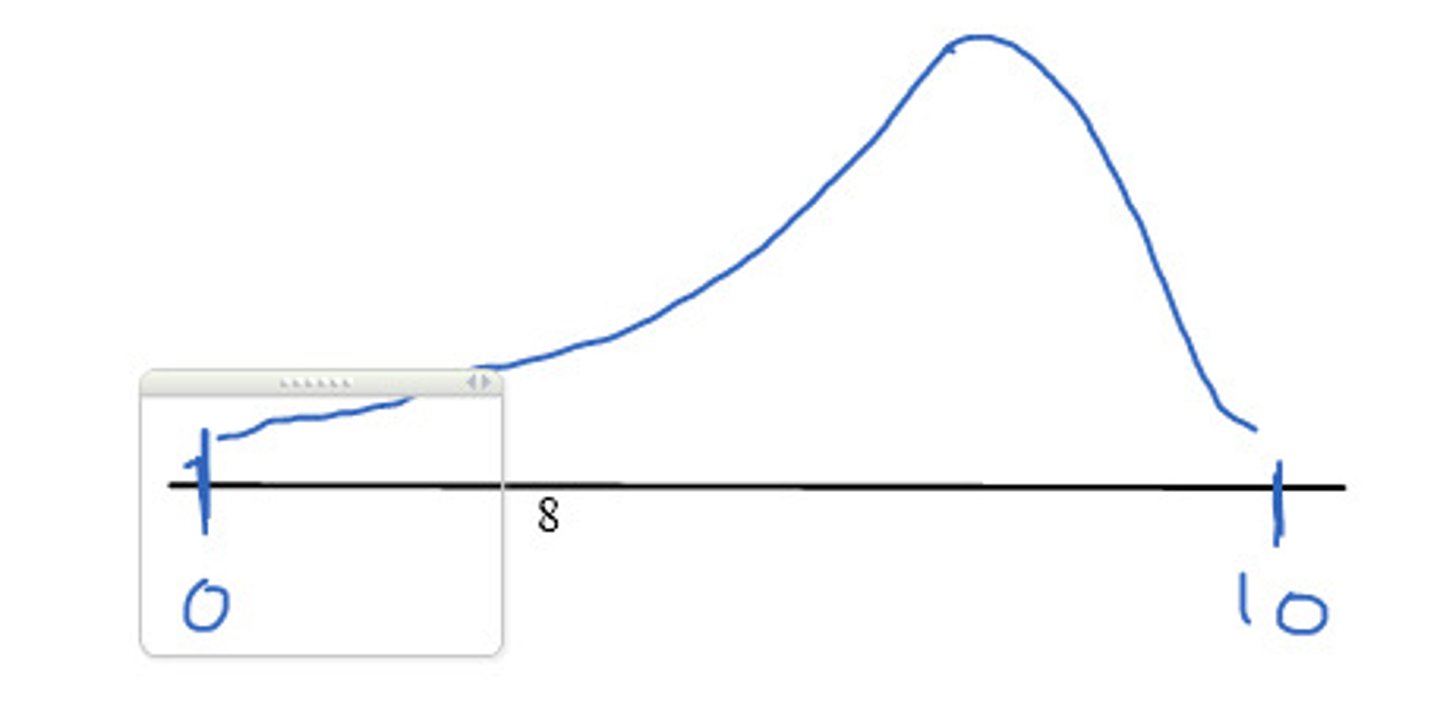
left skew
mean is less than median
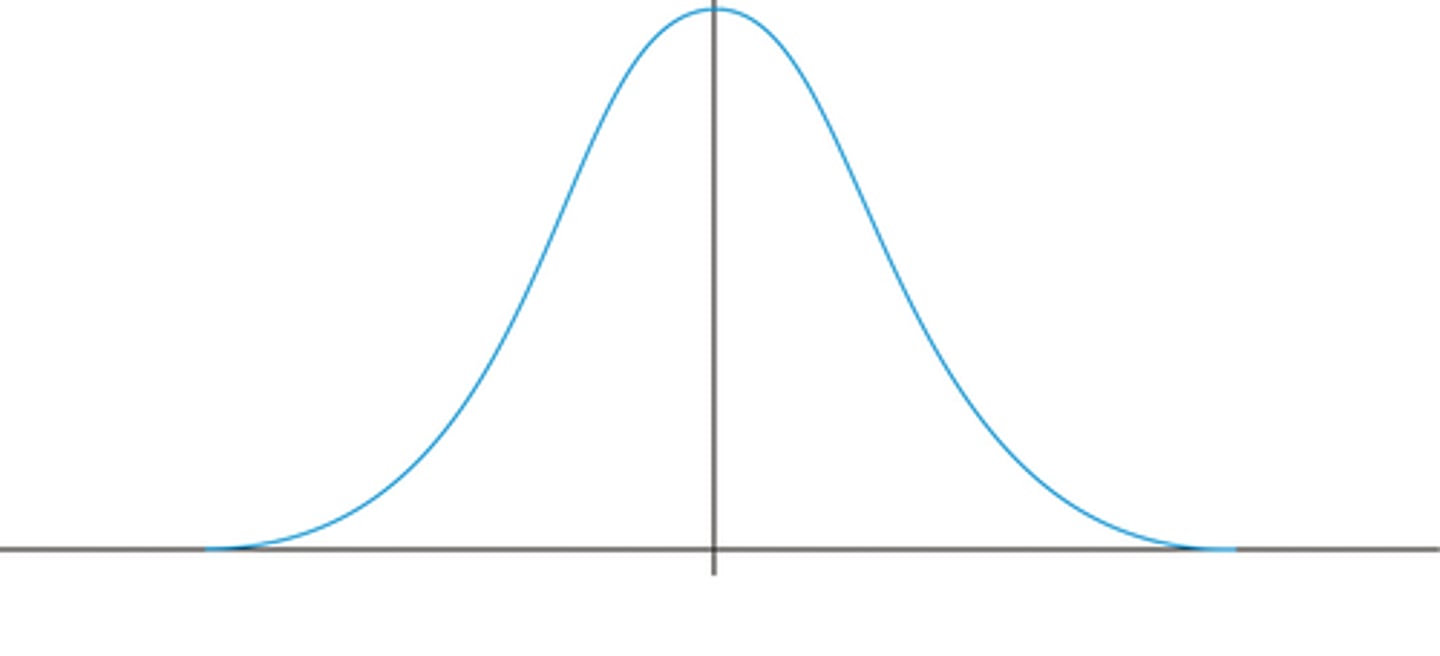
unimodal distribution
A distribution with one peak
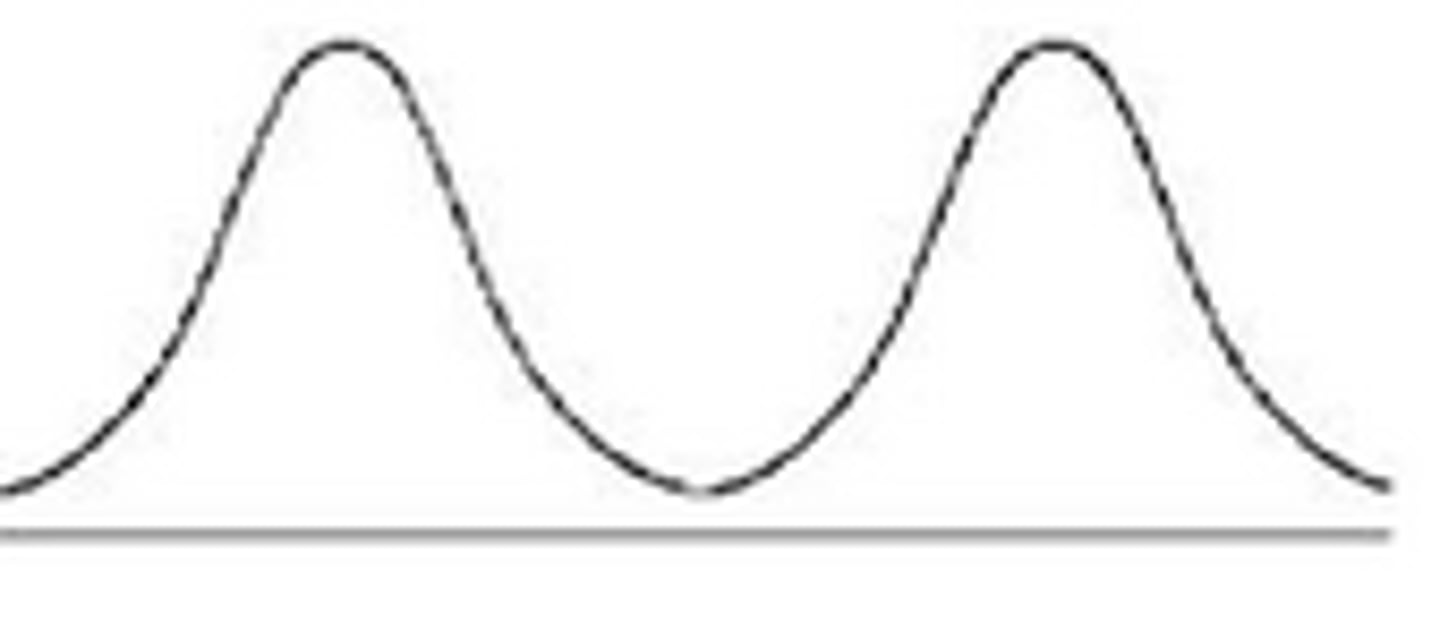
bimodal
distributions with two modes
68-95-99.7 rule
in a normal model, about 68% of values fall within 1 standard deviation of the mean, about 95% fall within 2 standard deviations of the mean, and about 99.7% fall within 3 standard deviations of the mean
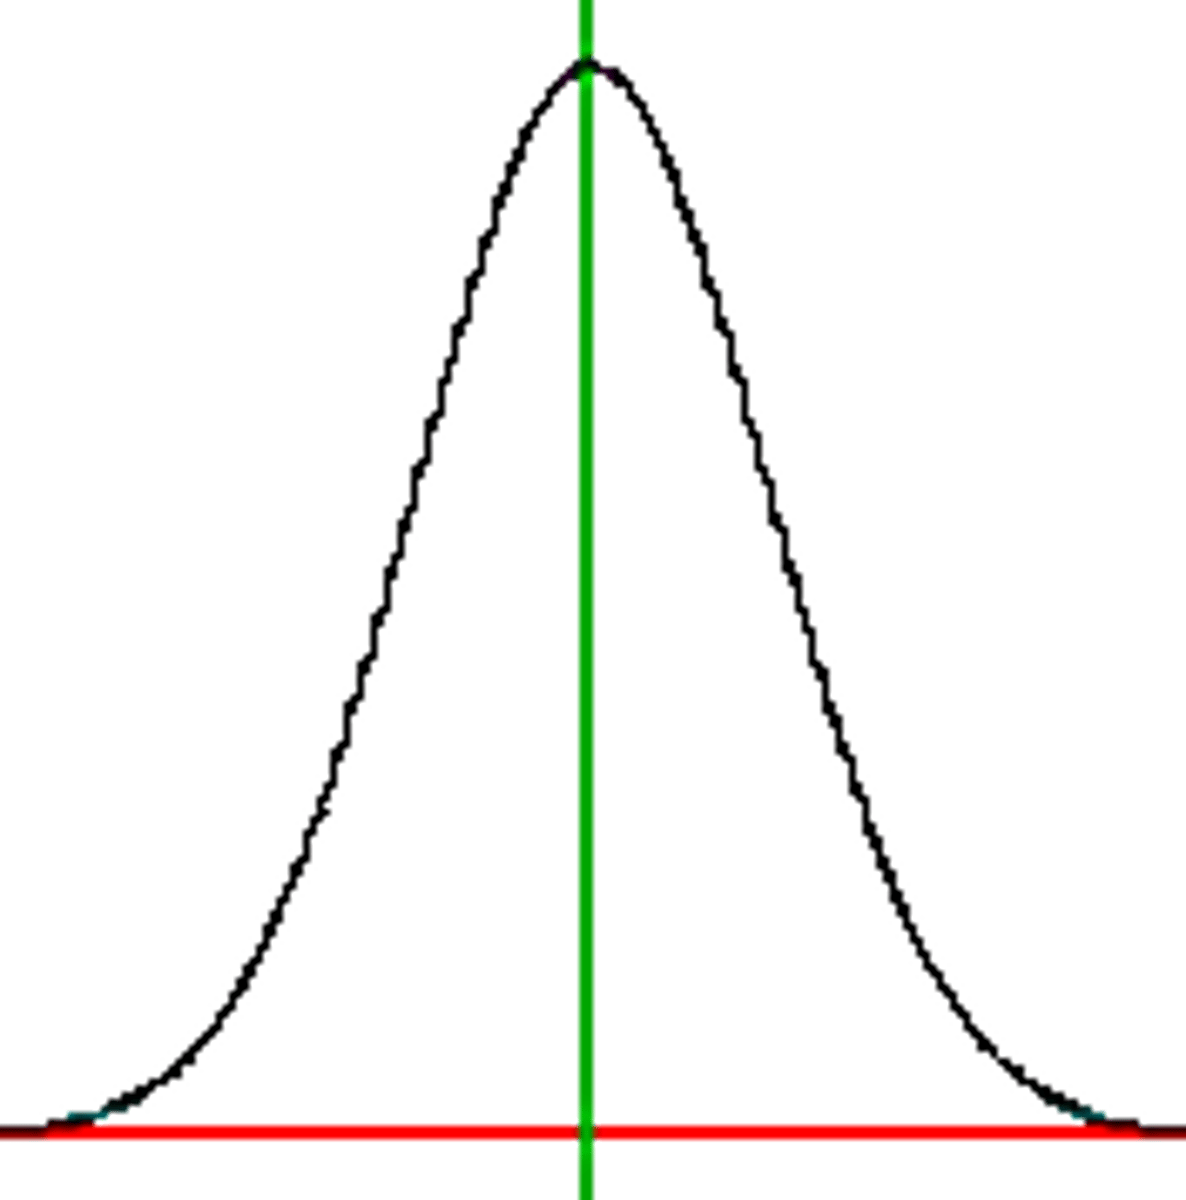
normal distribution
a bell-shaped curve, describing the spread of a characteristic throughout a population
central limit theorem
The theory that, as sample size increases, the distribution of sample means of size n, randomly selected, approaches a normal distribution.
Cohen's d
a measure of effect size indicating how far apart two group means are, in standard deviation units
intercept of regression line
Value of dependent variable when independent variable is zero.
slope of regression line
represents the change in y (response variable) for a unit change in x (predictor variable)
Q1, Q3, and IQR
- The 25th percentile is also called the first quartile, Q1.
- The 50th percentile is also called the median.
- The 75th percentile is also called the third quartile, Q3.
- Between Q1 and Q3 is the middle 50% of the data. The range
these data span is called the interquartile range, or the IQR. IQR = Q3 - Q1
degrees of freedom
The number of individual scores that can vary without changing the sample mean. Statistically written as 'N-1' where N represents the number of subjects.
margain of error
an amount (usually small) that is allowed for in case of miscalculation or change of circumstances.
Kurtosis
Bayes' Theorem
The probability of an event occurring based upon other event probabilities.
Bayes factor
a ratio of the likelihoods of two competing hypotheses that quantifies the level of support for one hypothesis relative to the other. Used as an alternative to classical hypothesis testing
Prior Distribution
Models the many plausible values of the unknown quantity to be estimated in Bayes interference
Posterior Distribution
Probability distribution for a variable after adjustment for empirical evidence on its likely value.