Stats Unit 3
1/17
There's no tags or description
Looks like no tags are added yet.
Name | Mastery | Learn | Test | Matching | Spaced | Call with Kai |
|---|
No analytics yet
Send a link to your students to track their progress
18 Terms
How to Describe Scatter Plot Relationship
DUFS + CONTEXT
Direction/Slope (Positive/Negative/None)
Unusual features (Outliers or Clusters)
Form (Linear or Non-Linear)
Strength (How close to the form)
Explanatory Variable
Used to predict the Input
Like a measurement/unit being tested
Ex. One rubber Band
Always the X axis
Response Variable
Outcome of study
what is being tested
Ex. Distance
Always the Y axis
correlation (r)
Correlation between 2 quantitative variables
Measures how close the points follow a line
Strength of linear relationship
r2
How much of the variation in the response variable (y) is explained by the linear relationship with the explanatory variable (x)
Interpretation
“The percent of the variation in y explained by the linear relationship with x.”
Residual Measurement
Difference between Actual and Predicted
Residual= Actualy -Predictedy
Extrapolation
Use of data and linear regression to find something outside of our data
Must be Cautious
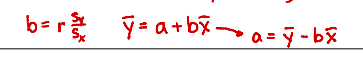
How to find Linear Regression Equation
Look at data & Identify Explanatory & Response Variable
Make Explanatory L1
Make Response L2
Use LinReg(a+bx) function
Interpret when x=0
When x=0, the predicted y context is y-int
Interpret x-context
for each additional x-context, the predicted y context increases/decreases by slope
Residual Plots
Plots used to plot the residuals of data
Plotting difference between actual and predicted of the model
To determine if Linear model is good fit
If there is a Curved pattern (U-Shaped) then the linear model is likely not best representation
ANY U SHAPE, UPWARDS, DOWNWARDS, SIDEWAYS
If no pattern & random scatter, then it’s a good model
Least Square Regression Line
Line that minimizes the sum of the squared residuals
Effect on LSLR when adding Horizontal Outlier
Tilt the Line
Slope always decreases
Farther point → greater decrease
Y intercept increases
Farther distance → Greater increase
Correlation decreases
Farther distance → weaker corelation
Effect on LSR when adding Vertical Outlier
Shift the Line up or down
Slope Doesn’t Change
Correlation Decreases
Farther Distance → Weaker correlation
Y intercept varies
Higher Up shifts graph up → greater y intercept
Lower down shifts graph down → smaller y intercept
High Levarage
Very large or Very small x-values
Important Liner Regression Formulas
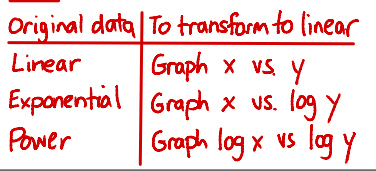
Methods to Graph Data
How to Choose Best Regression Model
Check Scatterplot for linear pattern (No pattern, random)
Check Residual plot for no leftover pattern
Check for r2 closest to 1