AP HUGS Unit 1: Map Projections & Types of Maps
1/12
Earn XP
Description and Tags
MT = Map Type (Interrupted/Uninterrupted, SD - Spatial Distribution, V - Values (Advantages), L - Limits (Disadvantages)
Name | Mastery | Learn | Test | Matching | Spaced | Call with Kai |
|---|
No analytics yet
Send a link to your students to track their progress
13 Terms
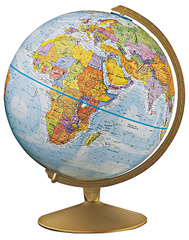
Globe
MT = Uninterrupted
V - Accurately represents shapes and distance, along with size and area
L - Not practical, no direction, cannot look at all countries at once, does not show a country’s boundaries within
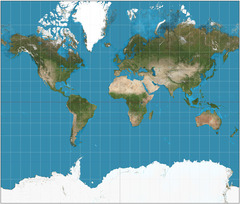
Mercator Projection
MT - Uninterrupted
V - Accurate Navigation and direction
L - Does not show accurate size/area
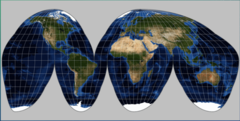
Good Homolosine Projection
MT - Interrupted
V - Shows size and shape of Earth’s landmasses
L - Distance and Distortion near the edges of the map, and direction, disrupts the oceans
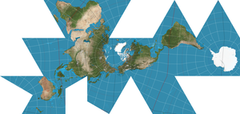
Fuller Projection
MT - Interrupted
V - Maintains accurate size and shape of landmasses
L - Struggles with direction and distortion farther away from the center
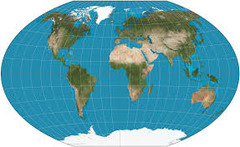
Robinson Projection
MT - Uninterrupted
V - Maintains size & shape of landmasses
L - Distortions are mainly at the top
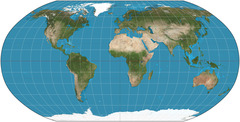
Winkel Tripel Projection
MT - Uninterrupted
V - Larger, spreads out the map
L - Spreads distortion throughout the entire map, but tries to concentrate as much distortion at the pole
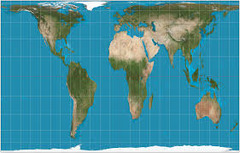
Gall-Peters Projection
MT - Uninterrupted
V - Shows the true sizes of landmasses
L - Significant amount of distortion in the shape of the land masses & direction
Chloropleth Maps
SD - Display data by using different colors
V - Show quantity and density
L - Generalizations to display info

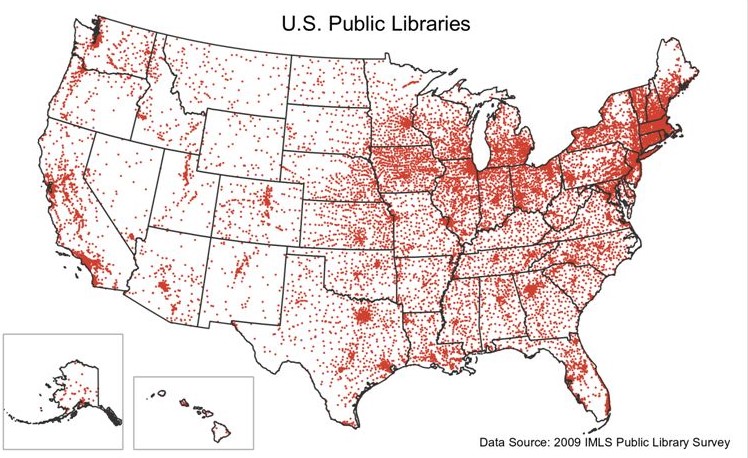
Dot Density Maps
SD - Points at the place the data is occurring
V - Shows spatial distribution
L - Can be difficult to understand if data reoccurs in the same spot
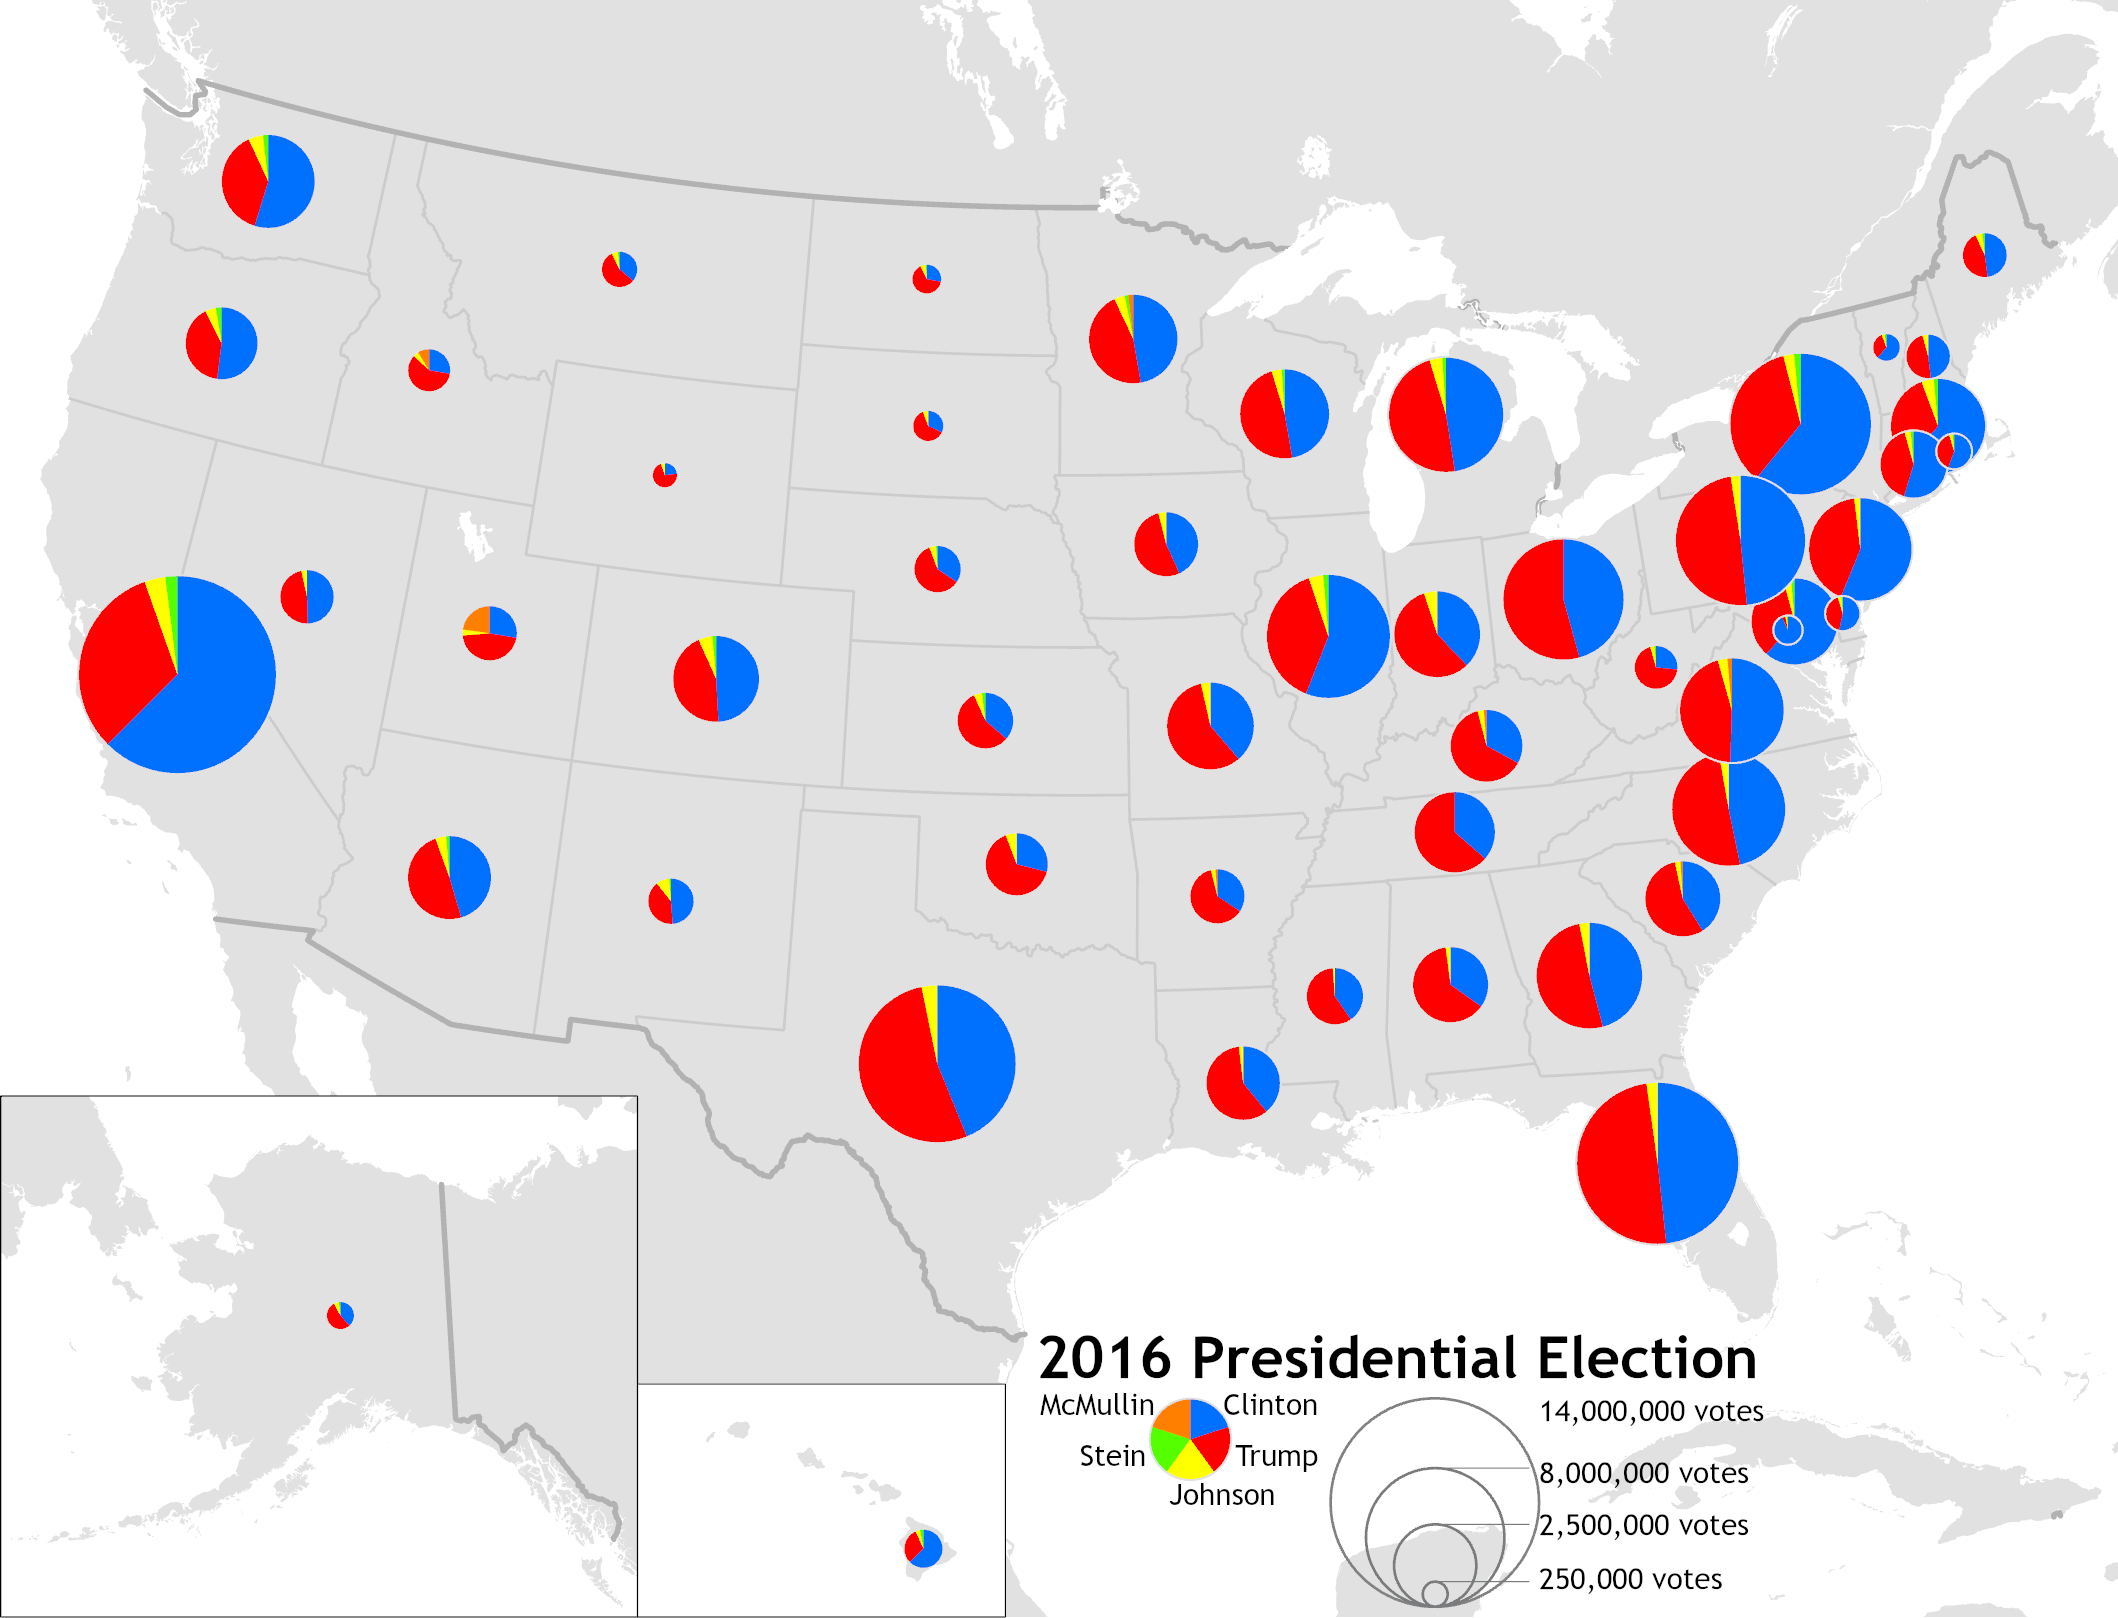
Graduated (Proportional) Symbol Maps
SD - Use shapes, items, or symbols to show amount of data & location
V - Very visual, efficient use of symbols of various sizes to show the occurrence of something
L - Can be difficult to understand because of overlapping data
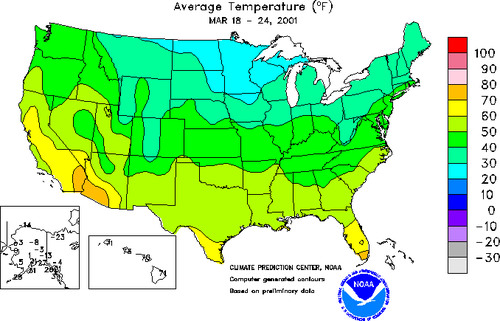
Isoline Maps
SD - Use lines to connect different areas with similar or equal amount of info
V - Visually represent continuous and steady data
L - Can be difficult to read
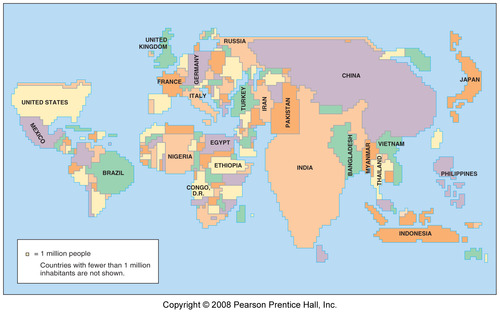
Cartograms
SD - Shows data dynamically and with the greatest value represented by the largest area
V - Very visual and can clearly show differences between places
L - Can be confused due to the distortion of the shape & size of place
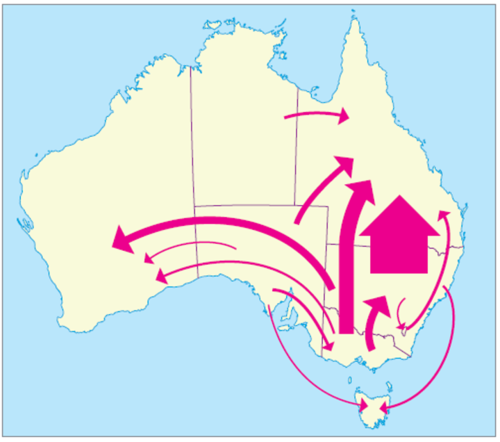
Flowline Maps
SD - Shows movement of objects
V - Simpler to understand spatial relationships by representing movement and flows between places
L - Overlapping lines and clutter can be hard to understand