Unit 9: Inference for Slopes
1/3
There's no tags or description
Looks like no tags are added yet.
Name | Mastery | Learn | Test | Matching | Spaced | Call with Kai |
|---|
No analytics yet
Send a link to your students to track their progress
4 Terms
Least Square Regression Line
It is the line that minimizes the sum of squared residuals → y=a+bx
Slope (b) - How much y changes when x increases by 1
Computer Output
The p-value is only for a two sided test → don’t forget to divide by two for a one sided test!
Confidence Interval for Slopes
A confidence interval for the slope tells you a plausible range for the true population slope β.
1) STATE
Parameter: Let β be the true slope of the population LSRL for (x) and (y)
Statistic (b) = _ → fond from computer output
Confidence level
2) PLAN (L.I.N.E.R): t Interval for Slopes
Linear - The dot plot shows a linear regression and the residual plot has no pattern
Independent - The sample size < 10% of population size
Normal - The residual plot has no skew or outliers → Use normal distribution
Equal Standard Deviation - The residual plot shows a similar variability of x
Random - They took a random sample → Establish causation
3) DO t Interval for Slopes
Confidence Interval: b±t(SEb)
b → statistic (found from computer output)
t → invT( (1-confidence level)/2, df (n-2)
SEb → found from computer output
4) Conclude
We are _% confident that the interval _ to _ captures the true population slope of the LSRL for (x) and (y)
Hypothesis Tests for Slopes
1) STATE
Parameter: Let β be the true slope of the population LSRL for (x) and (y)
Hypothesis test
H0: β = 0
Ha: β <,>, ≠ 0
Statistic (b) = _ → fond from computer output
Significance level
2) PLAN (L.I.N.E.R) t Test for Slopes
Linear - The dot plot shows a linear regression and the residual plot has no pattern
Independent - The sample size < 10% of population size
Normal - The residual plot has no skew or outliers → Use normal distribution
Equal Standard Deviation - The residual plot shows a similar variability of x
Random - They took a random sample → Establish causation
3) DO
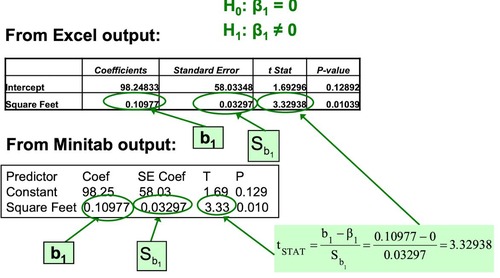
t Statistic : (b-β) / SEb → Found from computer output
p value: Found from computer output
df = n-2
4) CONCLUDE
If p < 0.05 → Reject null
If p > 0.05 → Fail to reject null