A-level economics: 2.1 Measures of economic performance - content
1/76
There's no tags or description
Looks like no tags are added yet.
Name | Mastery | Learn | Test | Matching | Spaced | Call with Kai |
|---|
No analytics yet
Send a link to your students to track their progress
77 Terms
GDP
value of goods & services produced in economy in 1 year
rising GDP
positive economic growth
higher incomes
more jobs
higher consumption
higher standard of living
falling GDP
negative economic growth
lower incomes
less jobs
lower consumption
lower standard of living
real GDP
adjusted for inflation
calculated using constant prices
prices held at level of chosen base year
nominal GDP
not adjusted for inflation
calculated using current prices
e.g. nominal vs real GDP - pizzeria
year 1: sold £500,000 worth of pizza
year 2: sold £900,000 worth of pizza
80% increase - doesn’t mean pizzeria produced 80% more pizzas in year 2 than year 1, price likely increased
year 1: 50,000 x £10 = £500,000
year 2: 60,000 x £15 = £900,000
increase in income due to increase in price & increase in output
must consider changing prices to find how much of increase in GDP was due to higher output
to find change in output - hold price constant (£10 - price of pizza in year 1))
year 1: 50,000 x £10 = £500,000
year 2: 60,000 x £10 = £600,000
in real terms, output increased by 20% not 80% (calculated without change in price to find change in output)
total GDP
economic output of country
GDP per capita
GDP divided by population = economic output per person
value of GDP
nominal GDP
measures monetary worth of goods & services at current prices
not adjusted for inflation
volume of GDP
real GDP
measures physical quantity of goods & services produced
adjusted for inflation
GNI
GDP + net primary income + net secondary income
total foreign & domestic income earned by country’s residents
net primary income
wages, salaries, other income earned by country’s residents working abroad
earnings from foreign investments (dividends & interest)
net secondary income
transfers of money between countries
e.g. remittances (money sent as gift) from foreign workers to families in home countries, international aid
GNP
total value of goods & services produced by country’s residents & companies, regardless of where they are located
(GDP has to be produced within country)
comparing rates of growth between countries
assess relative economic performance
reveal disparities in development
highlight factors contributing to growth
comparing rates of growth over time
reveal economic patterns & trends (long-term)
identify periods of economic expansion, recession, or stagnation
purchasing power parity
items should cost same in different countries based on current exchange rate
measures how many units of one currency needed to buy same basket of goods & services that can be bought with given amount of another currency
calculated by comparing price of basket of comparable goods & services in different countries
PPP-adjusted figures in international comparisons
countries with high cost of living - PPP-adjusted GNI per capita (income) lower than unadjusted
countries with low cost of living - PPP-adjusted GNI per capita (income) higher than unadjusted
Big Mac Index
measures each currency against common standard (McDonald’s burger) manufactured in standard size, composition & quality
convert average national Big Mac prices to US dollars - can compare same goods
tells us whether currency under/overvalued in foreign exchange markets
limitations of using GDP to compare living standards between countries & over time
issues with measurement & data - currency exchange rates vs PPP, excluding non-market activities, untracked economic activities
issues with interpretation & scope - income inequality, environmental factors & externalities, changing living standards
UK national wellbeing
measures wellbeing not just income
affected by income, health, relationships, freedom & corruption
captures non-economic aspects of wellbeing
evaluation of UK national wellbeing
subjective - depends on personal feelings
hard to compare between countries - hard to collect data
changes over time/depending on mood
relationship between real incomes & subjective happiness
low income - positive relationship between happiness & income (poverty → comfort)
once basic needs met - marginal increase in happiness from extra income decreases (comfort → higher comfort)
evaluation of relationship between real income & subjective happiness
increase in income → economic growth → higher living standards → higher life satisfaction/happiness
inflation
sustained increase in general price level leading to fall in purchasing power/value of money
disinflation
fall in rate of inflation
deflation
when prices actually fall
CPI (consumer prices index)
tracks changes in average price level of basket of goods & services bought by typical household over time
used for assessing inflation & cost of living
compares current prices of items in basket to prices of same items in base year
% change in comparison reflects inflation/deflation rate
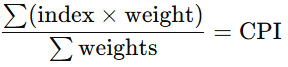
calculating rate of inflation using CPI - CPI = (indices)
using new price index
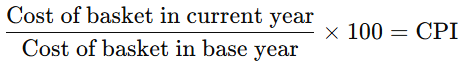
calculating rate of inflation using CPI - CPI = (prices)
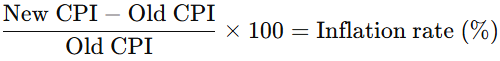
calculating rate of inflation using CPI - inflation rate =
limitations of CPI in measuring rate of inflation
not representative of all households - excludes some groups (e.g. highest/lowest incomes); different spending patterns
sampling errors & inaccurate data - low response rates; unreliable survey data
doesn’t include housing costs - e.g. mortgage payments/rent
time lag in updating basket - basket only updated annually → changes in tastes & new products not reflected quickly
changes in quality - inflation calculated only on price change → seems higher as doesn’t reflect rise in quality
difficulty measuring digital services - many have no clear price (e.g. free online services)
RPI (retail prices index)
includes housing costs
usually higher than CPI - sensitive to interest rate changes → affect mortgage interest
ONS switched from RPI to CPI - overestimates inflation
demand pull inflation definition
economic growth too fast
excess AD (AD > economy’s productive capacity)
general price level increases
too much money, too few goods
demand pull inflation causes
excess demand
cut in interest rates (encourages spending)
higher wages
increased consumer confidence (affected by job security, value of assets)
rising house prices (positive wealth effect)
increased money supply
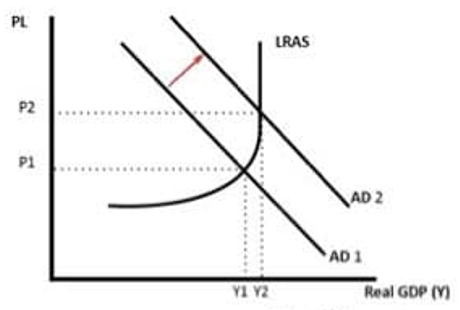
demand pull inflation chain effects
economy at/close to full employment - increase in AD → increase in price level
higher wages → consumers’ disposable income increased → consumption increased → demand increased
firms reach full capacity → increase prices → higher inflation
near full employment with labour shortages - workers can get higher wages → increases spending power
AD can increase due to increase in any of its components (C + G + I + X-M)
economic growth above long-run trend rate of growth → demand pull inflation
demand pull inflation graph
cost push inflation definition
affected by supply-side factors
production costs increase → businesses raise prices
cost push inflation causes
(all production costs)
higher wages (most significant cost for firms, firms raise prices to maintain profit)
import prices
devaluation (increased cost of imported goods (raw materials))
increase in VAT
inflation expectations (e.g. higher prices → workers demand higher wages → wage price spiral)
cost push inflation chain effects
higher wages → firms’ costs increased → firms increase prices
trade unions present united front → bargain for higher wages (collective bargaining)
increase in costs for firms → businesses increase prices
devaluation/depreciation (have to pay more to buy same good) → import prices increase → increase in inflation
oil prices increase → impacts most goods in economy → cost push inflation
high inflation expectations → workers demand higher wages → firms increase prices
low inflation expectations → temporary rise in prices
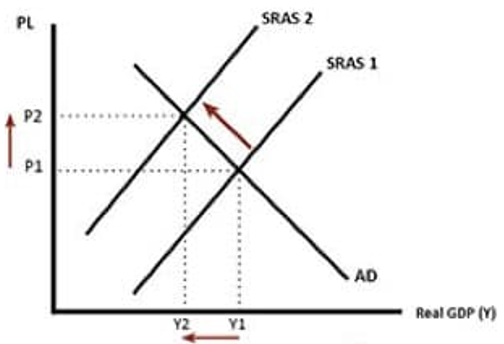
cost push inflation graph
growth of money supply - cause of inflation
too much money in economy
increased demand but no increase in supply → prices rise
effects on inflation on consumers
incomes don’t rise with inflation → less to spend → fall in living standards
reduces real value of debt → those in debt can pay it off cheaper, those owed money get back money of cheaper value
money saved of less value → savers lose out
psychological effect → feel poorer due to rising prices → decrease spending
effects on inflation on firms
higher in Britain → British goods more expensive → less competitive → harder to export (also effects balance of payments)
deflation → expect prices to fall further → postpone purchases
deflation → more likely to save (value of money will rise in future), less likely to borrow (real value of debt increases) → fall in demand → fall in profits & business confidence → long-term reluctance to invest
hard to predict → firms can’t plan for future
calculate new prices → change price labelling (expensive)
effects on inflation on government
govt doesn’t change taxes to be in line with inflation → real govt revenue falls
govt doesn’t change personal income tax allowances (amount worker can earn tax free) → real govt revenue increases & taxpayers have less money
effects on inflation on workers
don’t receive yearly pay rises of rate of inflation → worse off in real terms → fall in real incomes → living standards decrease
those in weaker unions most affected → unable to win wage rises in line with inflation
deflation → lack of demand → fall in firms’ profit → staff lose jobs to cut costs
unemployment definition
someone of working age (16-67), willing & able to work & actively seeking work but cannot find a job
claimant count
number of recipients of job seeker’s allowance & those on universal credit required to look for work (UC also includes employed)
narrow definition of unemployment - only includes those actively seeking work & receiving govt benefits
live data - have to go to job centre every week
published monthly
international labour organisation & UK labour force survey
ILO unemployment definition: individuals of working age who are without work, actively seeking work & available for work
UK labour force survey - primary source of unemployment data in UK (& follows ILO definition)
broader & more comprehensive picture of unemployment - includes those not eligible for benefits
quarterly basis (every 3 months)
approx. 90,000 people
conditions: looking for work in last 4 weeks, available to start in next 2 weeks
claimant count vs LFS
people in claimant count not LFS: working in hidden economy (avoid tax), fraudulently claim benefits
people in LFS not claimant count: unemployed not eligible for benefits (e.g. partner working, looking for work along full-time study)
LFS > claimant count
can go in different directions - LFS only sample & different types of people asked → short term changes in rate; events in labour market not covered by claimant count (e.g. more students looking for work alongside studies)
both underestimate figure as don’t include: part-time workers wanting full-time work, sick/disabled, not actively looking but would take job if offered, in education unable to find work
unemployment vs underemployment
unemployment: no job despite actively seeking work
underemployment: working in role part-time/low-skilled/below qualification level (not in any unemployment stats)
employment rate
% working age population who are employed
unemployment rate
% economically active population who are unemployed
inactivity rate
% working age population who are economically inactive (not in work, not seeking work)
changes in employment rate
higher employment → less dependency on welfare, higher output → higher living standards, higher tax revenue, stronger economic growth
changes in unemployment rate
higher unemployment → lower output, lower incomes, higher govt spending on benefits, more spare labour (labour demand < supply),
lower unemployment → higher output, higher incomes, lower govt spending on benefits, risk of labour shortages (labour demand > supply) & inflationary pressure (wage bargaining)
changes in inactivity rate
increase in inactivity → decrease size of labour force → fall in productive potential of country → lower GDP & lower tax revenues (less people working)
structural unemployment
lack of suitable skills for job available
result of deindustrialisation (automation → manufacturing sectors decline → workers not skilled enough)/other structural changes in economy
links to occupational immobility of labour (mismatch between skills of employee & skills required by vacant position) - new jobs require new skills (retraining cost)
frictional unemployment
workers seeking better job/in between jobs
affects new entrants to labour market & people on short-term employment contracts (move between jobs)
always frictional unemployment regardless of stage of business cycle
helps provide supply of labour for employers
reduced by: job info more available, job search more affordable
e.g. mothers returning to labour market
seasonal unemployment
seasonal workers without paid jobs due to time of year when there are seasonal changes in demand, production & unemployment
e.g. farming, tourism
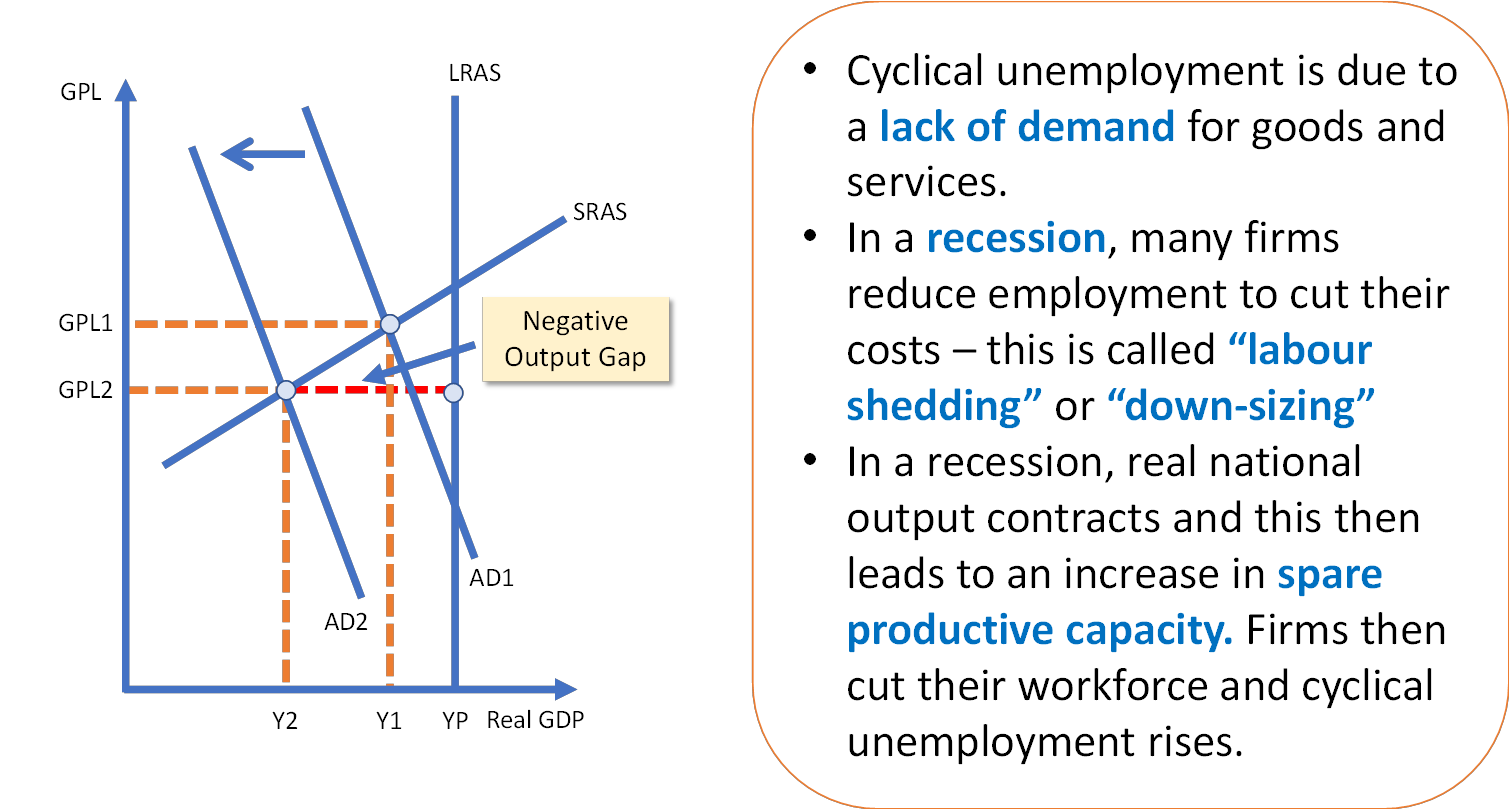
demand deficient/cyclical unemployment
involuntary unemployment due to lack of aggregate demand for goods & services
decreased demand for labour
economy slows down/recession → demand decreases → companies lay off workers
real wage inflexibility
workers reluctant to see real wages fall during economic downturn
real wages drop when nominal wages don’t rise as fast as prices
Keynesians argue wages can be slow to adjust downward due to: long-term labour contracts, trade union collective bargaining, social norms about fair pay
workers & employers reluctant to renegotiate contracts/reduce wages during downturns → persistent real wages levels too high relative to labour demand
natural rate of unemployment
rate of unemployment when labour market in equilibrium
significance of migration for employment & unemployment
increased migration → increased labour supply → migrants earn & spend income → increased AD → increased demand for labour → unemployment may not rise
(unemployment doesn’t rise due to higher demand for labour)
increased labour supply → decreased equilibrium wage (esp lower-paid, low-skilled jobs) → more competition for jobs (lower wages → need money even more)
significance of skills for employment & unemployment
increased economic development → increased demand for high-skilled labour → skills mismatch → structural unemployment → unfilled jobs → migrants may fill gaps if skills fit
effects of unemployment on consumers
unemployed → lower income → decreased spending
high unemployment areas → decreased range/quality of goods → less choice
possible decreased prices/promotions - firms try to boost demand
effects of unemployment on firms
lower consumer income → decreased demand → decreased profits
long-term unemployment → decreased skills in labour force → smaller skilled labour supply
increased labour supply → firms can pay lower wages
effects of unemployment on workers
lower income → decreased living standards
psychological impact → stress, illness, family breakdown, suicide
long-term unemployment → decreased skills → lower employability
employed workers → decreased job security & increased fear of redundancy
increased labour supply → decreased bargaining power → lower wages
effects of unemployment on government
decreased tax revenue (income tax) & increased welfare spending → increased budget deficit → less money for public spending
may increase taxes/decrease public spending/increase borrowing
effects of unemployment on society
increased social deprivation (lack of access to essential resources) → increased crime, poor health, lower life expectancy
decreased local demand → decreased incomes → further job losses (negative multiplier)
loss of potential output → inefficient resource use
decreased LRAS (if workers leave labour market) → decreased economic growth, inside PPF
benefits are transfer payment (govt distribution of wealth, not direct loss to economy)
real loss = decreased output & increased social costs
balance of payments
measures country’s transactions with rest of world
record of all money coming into & going out of country (includes payments for goods, services & financial transactions)
all transactions between residents & non-residents of national during period
components of balance of payments
current account
capital account
financial account
current account components
net balance of trade in goods
net balance of trade in services
net primary income
net secondary income
current account deficits & surpluses
deficit: value of imports (M) > value of exports (X)
surplus: value of imports (M) < value of exports (X)
macroeconomic objectives (main 4)
low unemployment
low & stable inflation
economic growth rate similar to other countries
balance of payments equilibrium
current account & macroeconomic objectives
high economic growth: increased demand → increased imports → current account deficit
high unemployment: decreased demand → decreased imports → deficit improves
govt wants export led growth: economic growth, high employment, improves current account balance, could cause inflation
interconnectedness of economies through international trade
increasing proportion of output of individual economy which is traded internationally
more people/companies own assets in other countries
increasing migration between countries
more technology being shared faster
countries are more interdependent → change in economic condition of one affects another