the large data set
1/46
There's no tags or description
Looks like no tags are added yet.
Name | Mastery | Learn | Test | Matching | Spaced | Call with Kai |
|---|
No analytics yet
Send a link to your students to track their progress
47 Terms
data from the large data set was collected for what time periods?
how many days are in each time period?
from may to october
in 1987 and in 2015
184 days in each year
what are the advantages of the time periods for which data was collected?
we can compare the same location during the same month in two different years: 1987 vs 2015
we can see the impact of global warming from 1987 to 2015 (increase in daily mean temperature for every station)
we have data collected during calmer, drier, brighter and hotter conditions: June - Aug
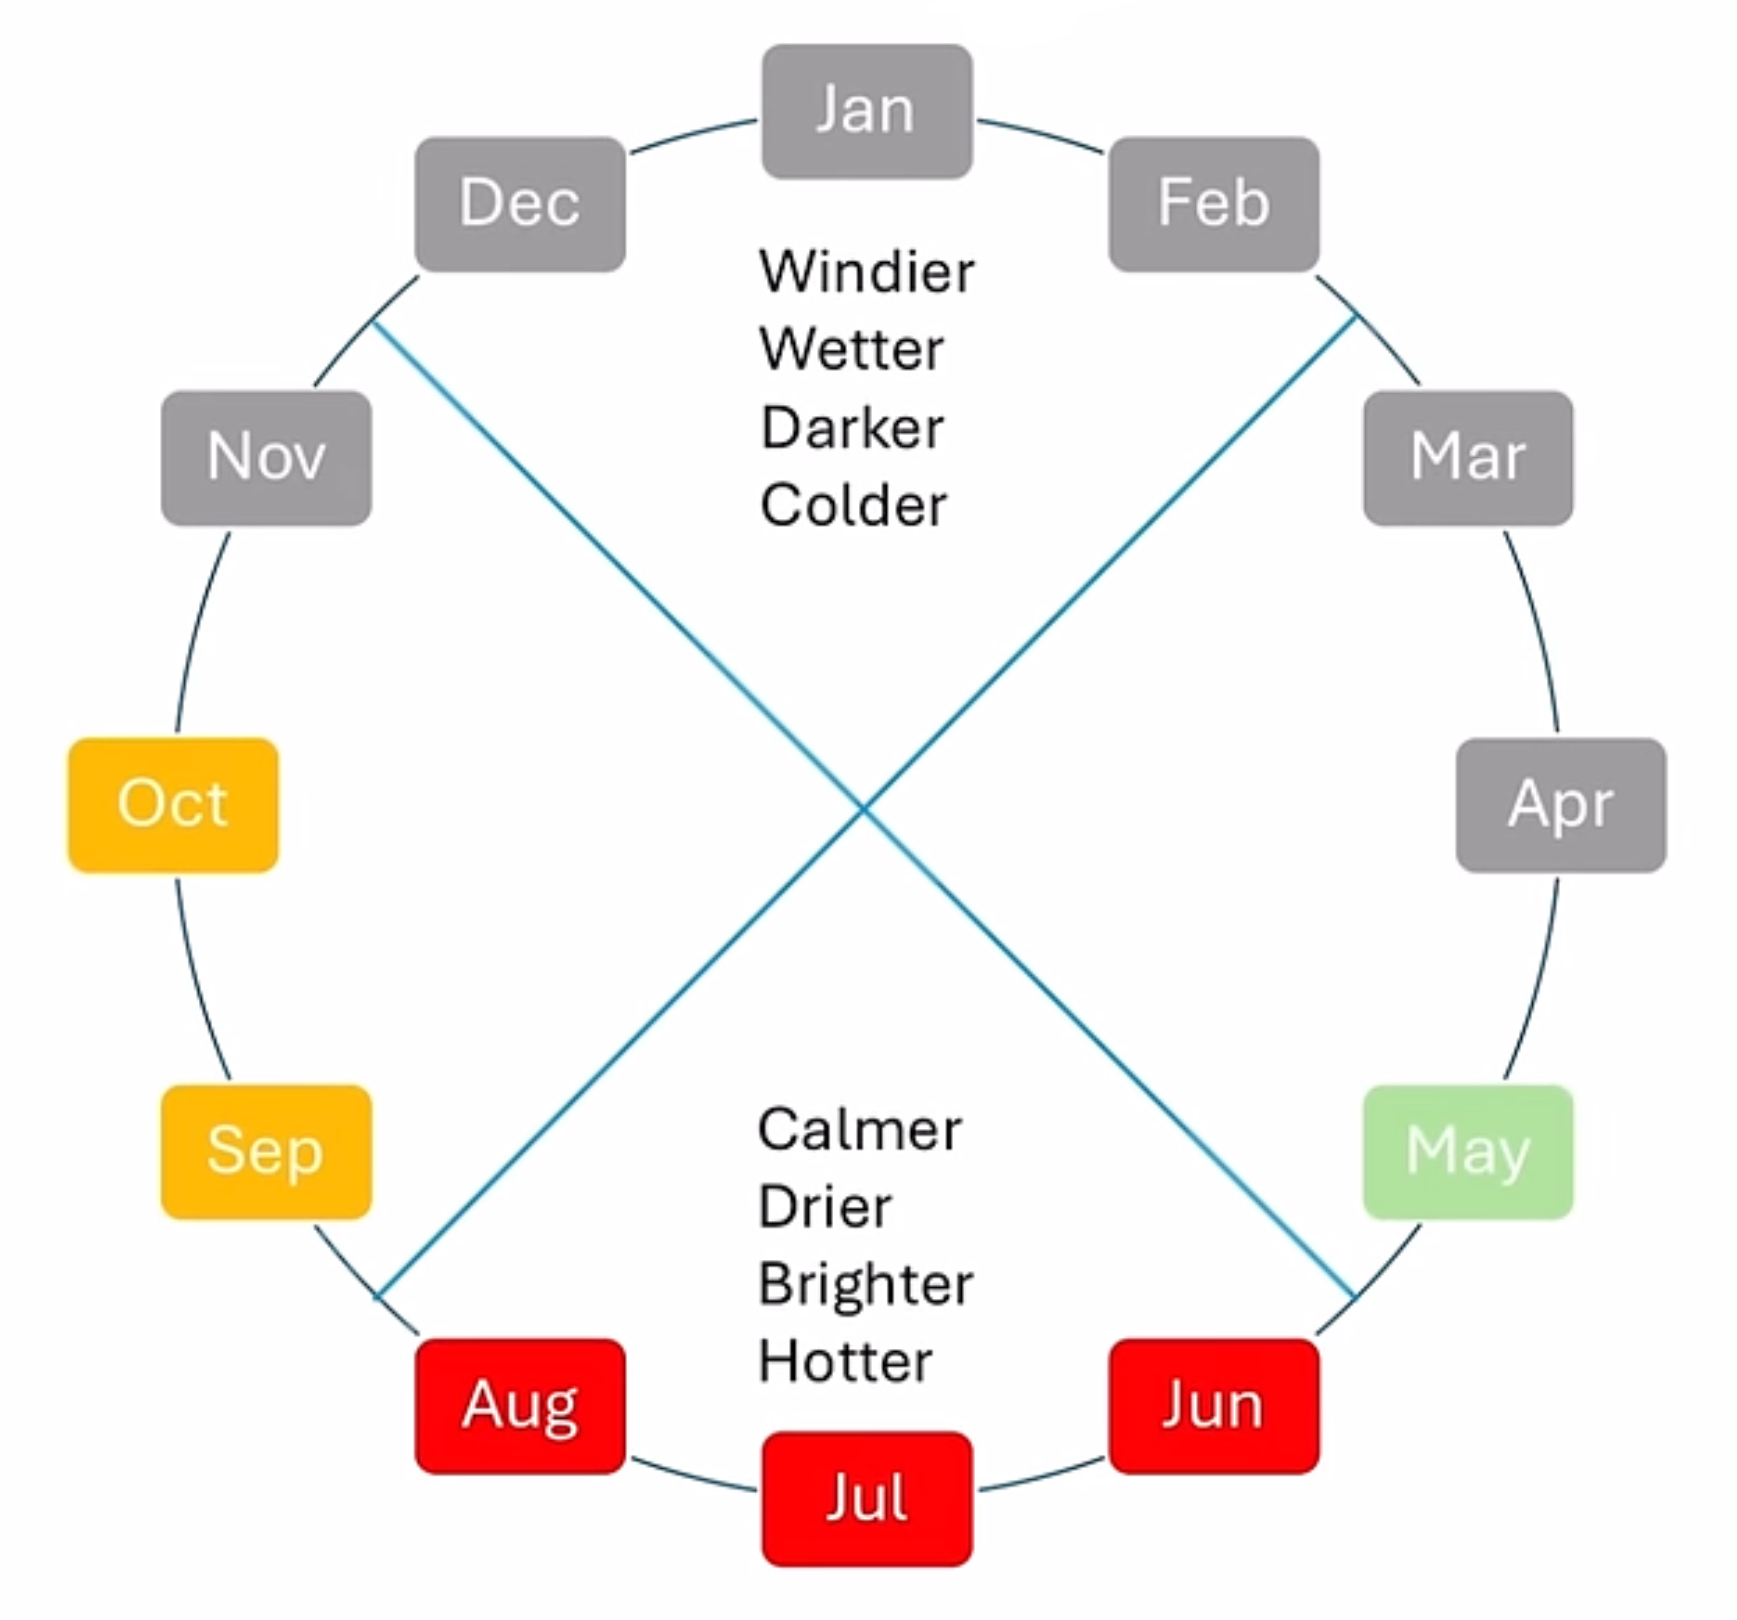
what are the disadvantages of the time periods for which data was collected?
only one spring month, May
no winter months, so no data during windier, wetter, darker, colder conditions
could maybe use October
cannot use the data to model weather for the entire year

what are the 5 UK weather stations from south to north?
Cambourne (most south, costal)
Hurn
Heathrow
Leeming
Leuchars (most north, costal)
alphabetical order except H switch
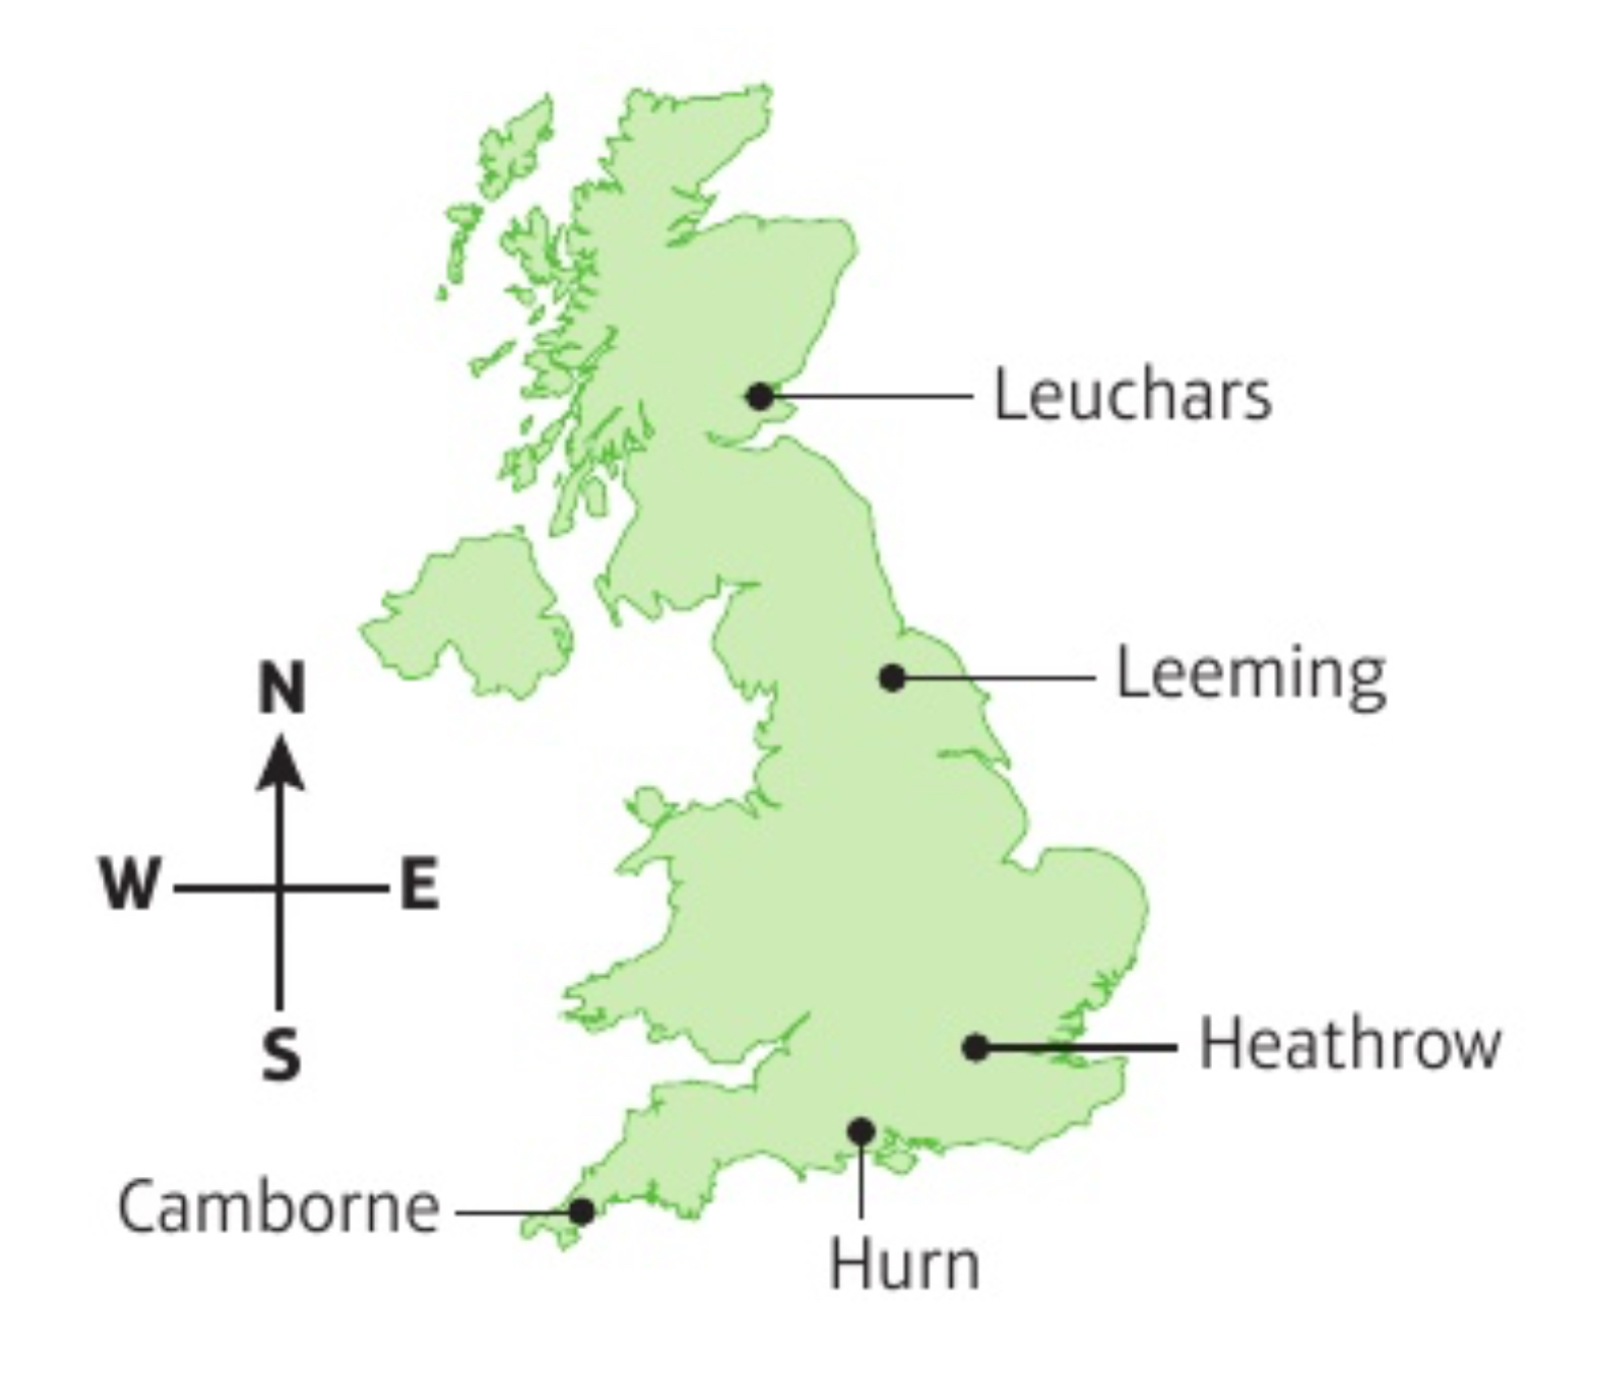
which UK weather station is the only one in Scotland and not in England?
Leuchars

what can be said about the coastal UK weather stations?
they are the stations that are most south and most north (Cambourne and Leuchars)
they are windier

as we move futher north, what happens during May to October?
temperature decreases
rainful increases
average amount of sunshine decreases
maximum hours of sunshine during the summer increases
as you go further above the equator, summer days are longer (and winter days are shorter)
what are the 3 international weather stations?
Beijing, China
Perth, Australia
Jacksonville, Florida, USA
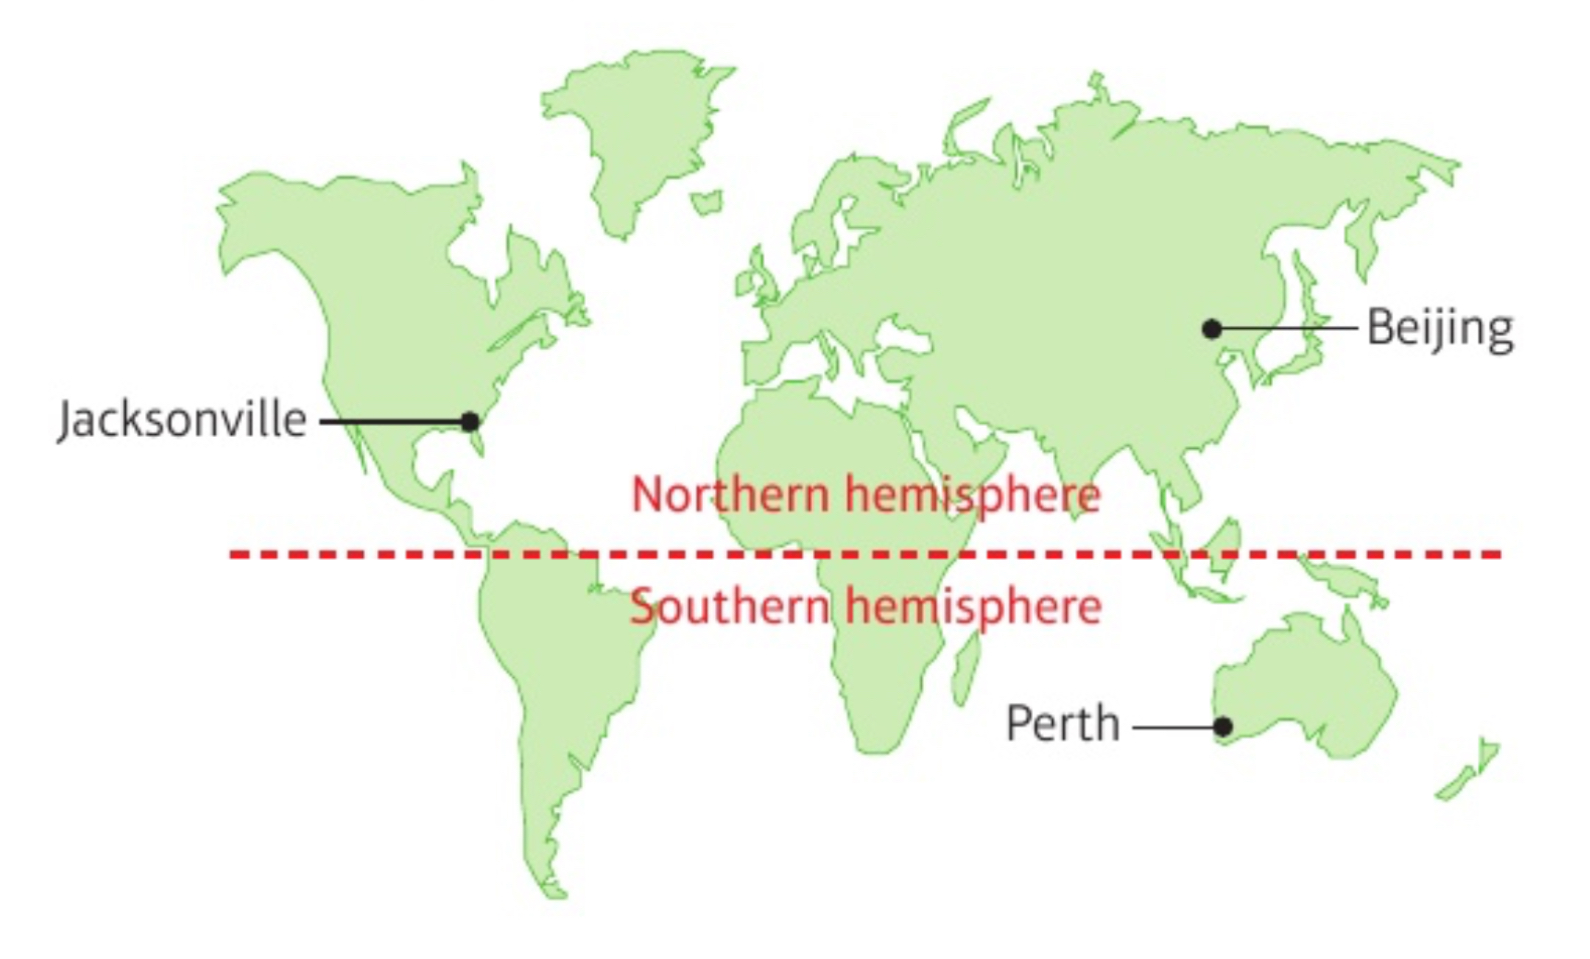
what are some characteristics of the 3 international weather stations?
Beijing
hotter, very rainy summers
colder winters
wide temperature range
Perth
not that hot
flipped seasons, cold and wet in summer months
very rainy some days
Jacksonville
hotter summers
wet
hurricanes in October (windspeeds still relatively low)

if temperature increases, then…?
amount of sunshine increases
amount of rainfall decreases
windspeed decreases
what does n/a mean?
not available
missing or unavailable data values
how is daily mean temperature recorded in the large data set?
in °C, to 1 dp
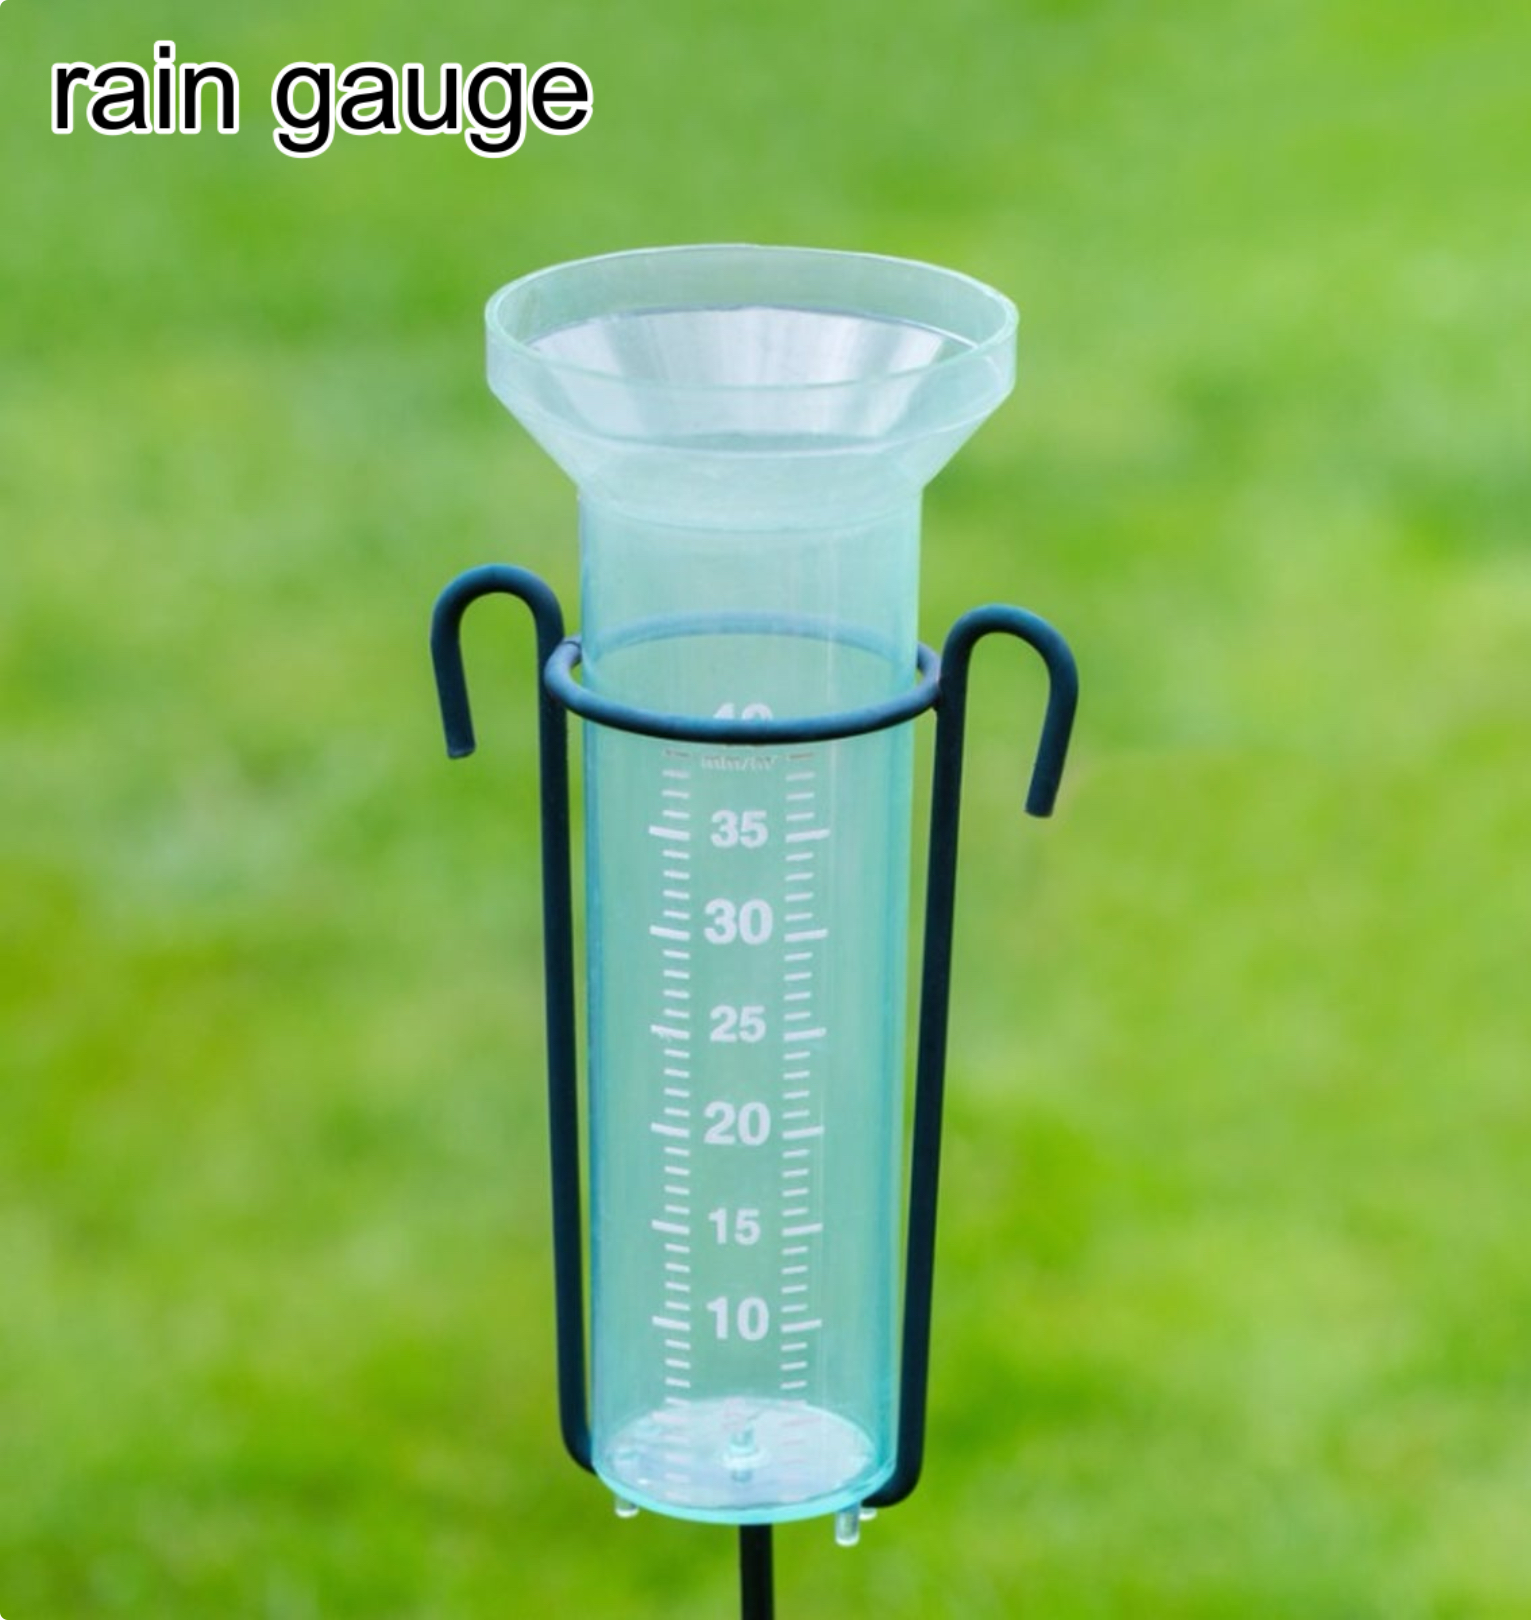
how is daily total rainfall recorded in the large data set?
in mm, to 1 dp

what does ‘tr’ mean?
trace
means there was a trace of water in the measuring instrument
rainfall < 0.05, but not equal to 0

what can be said about the distribution of data for daily total rainfall?
distribution is not symmetrical
many 0 and tr values
what does ‘cleaning’ the data mean?
replacing ‘tr’ with 0 mm or 0.025 mm
removing data entries if we have n/a and excluding it from calculations
how is daily total sunshine recorded in the large data set?
in hours, to 1 dp
what is cloud cover?
what fraction of the sky is covered by clouds
how is cloud cover recorded in the large data set?
in oktas, using integers between 0 to 8
what is humidity?
how much water vapor is in the air
how is humidity recorded in the large data set?
as a %, using integers
what is associated with humidity above 95%?
fog / mist
what is daily mean visibility?
how far into the distance can you see (a particular sized object)
how is daily mean visibility recorded in the large data set?
in Dm (decametres), rounded to the nearest 100
what is 1 Dm?
1 decametre = 10 metres
what is daily mean pressure?
how much of the atmosphere is pushing down
how is daily mean pressure recorded in the large data set?
in hPa (hectopascals), using integers
1 hPa = ?
1 hectopascal = 100 pascals
how is daily mean windspeed recorded in the large data set?
in kn (knots),
given as integers in the UK
given to 1 dp at international stations
1 knot = ?
1 knot = 1.15 mph
what is the Beauford conversion of windspeed?
conversion of windspeed from quantitative data to qualitative data
calm → light → moderate → fresh → strong
what is daily maximum gust?
the strongest gust of wind that day / the highest windspeed recorded that day
how is daily maximum gust recorded in the large data set?
in kn (knots), using integers
what is wind direction / gust direction?
which direction the wind is blowing from, not to
if you were to draw an arrow, the arrow would be in the opposite direction to the direction that the wind is blowing towards
how is wind direction / gust direction recorded in the large data set?
as a bearing in °, using multiples of 10 (cannot be 0) and given as 3 digits
or
using cardinal directions: N, SW, ENE
what is the typical range of daily mean temperature in the UK?
4.0 to 33.0°C
what is the typical range of daily total rainfall in the UK?
0 to 20.0 mm
0 to 60.0 mm
many 0 and tr values
what is the typical range of daily total sunshine in the UK?
0 to 14.0 hours
what is the typical range of cloud cover in the UK?
0 (min) to 8 (max)
what is the typical range of humidity in the UK?
70 to 100%
what is the typical range of daily mean visibility in the UK?
200 to 4000 Dm
what is the typical range of daily mean pressure in the UK?
1000 hPa is considered the average
below this is low pressure
above this is high pressure
typical range:
990 to 1040 hPa
what is the typical range of daily mean windspeed in the UK?
3 to 10 kn
3 to 19 kn
what is the typical range of daily mean windspeed on the Beaufort scale in the UK?
most days are Light, sometimes Moderate
what is the typical range of daily maximum gust in the UK?
8 to 50 kn
what is the typical range of wind direction / gust direction in the UK?
10° (min) to 360° (max)
cannot be 0°
what data is recorded overseas?
temperature
rainfall
daily mean pressure
daily mean windspeed
knots - written to 1 dp, rather than using integers like in the UK
Beaufort scale