anhb2215 graphs
1/7
There's no tags or description
Looks like no tags are added yet.
Name | Mastery | Learn | Test | Matching | Spaced | Call with Kai |
|---|
No analytics yet
Send a link to your students to track their progress
8 Terms
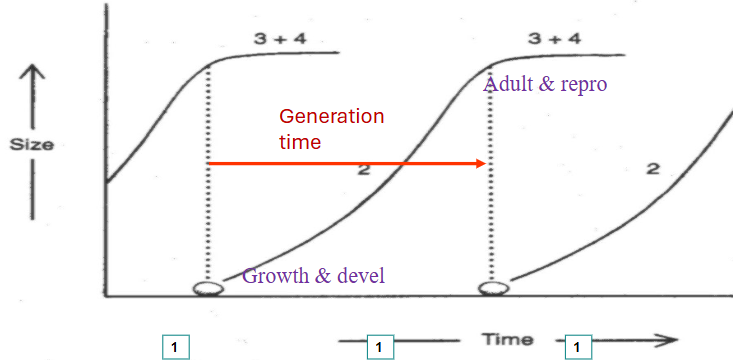
Graph is on uncertain futures
1 is juvenile period/genetic info received
2 is growth and development/ptential environmental change
3+4 is adult and reproduction
key point organism spends time in 2 before it knows exactly what adult environment it will face
Longer developmental time → greater potential environmental change → more selection for ability to respond developmentally
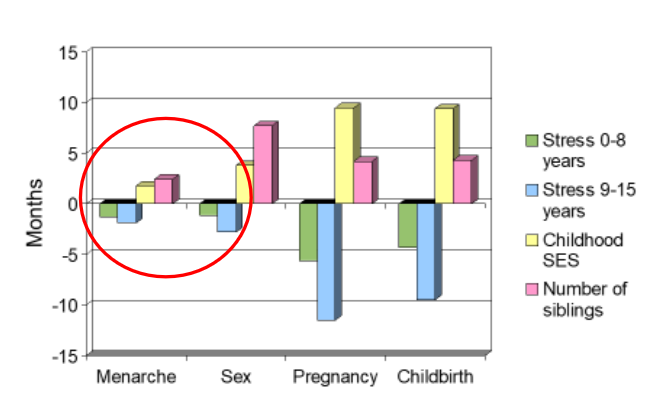
Effects of childhood stress in age of:
measure of fecundity and fertility
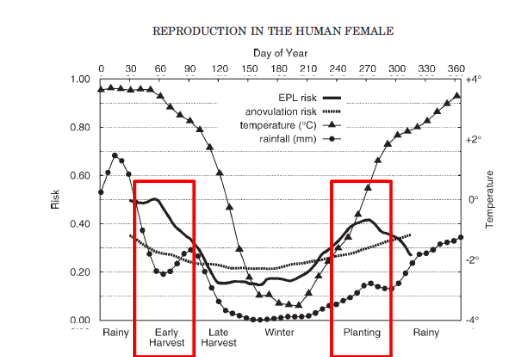
early harvest and planting have higher chances of no ovulation and pregnancy loss due to intense labour
rainfall indirectly influences through nutrition and labour
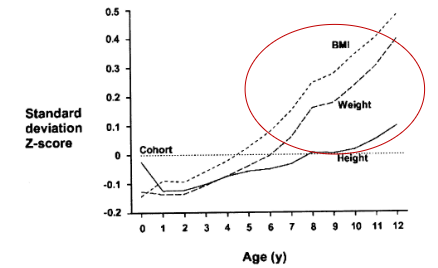
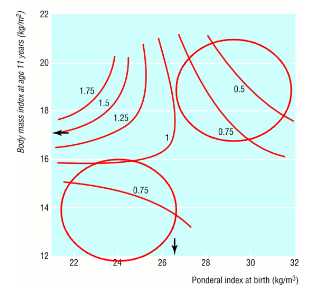
Hazard ratios for CHD
ponderal index X axis = measure of body condition
BMI Y at 11 axis
low ponderal + low BMI at 11 = low risk
low + high = high risk
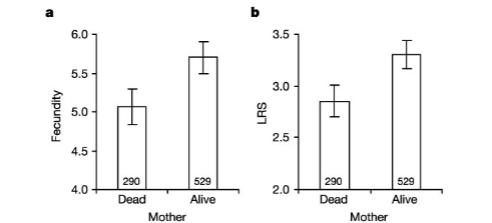
presence of post reproductive mother present at 1st reproduction
increased lifetime fecundity of offspring
increased lifetime reproductive success
through grandmoter hypothesis
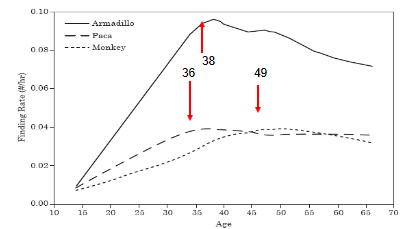
Knowledge economy/tracking efficiency by ache men
peaks at age 38
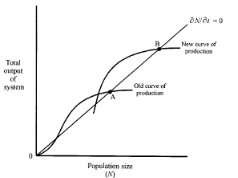
wood preindustrial demography model
innovations increased population from point A which is the original resource per person
pop move to point B same resource per person
better technology does not equal better wellbeing