Research Modules
1/45
There's no tags or description
Looks like no tags are added yet.
Name | Mastery | Learn | Test | Matching | Spaced | Call with Kai |
|---|
No analytics yet
Send a link to your students to track their progress
46 Terms
Construct
psychological concept
eg. happiness can be measured by observing smth like smiling which we think is indicative of happiness
Operational definition
Operationalisation is how we make a construct measurable (indirectly)
generally numerous ways
Research question + types
broad question/idea/problem we want to investigate - “eg. does happiness influence academic performance?”
Association question
Difference question
Prediction (example above)/ causation
These questions come from detailed literature reviews
Use research question to form hypothesis
should create a logical argument from literature review
must be narrow and specific
must be testable with observable/testable outcomes
should be refutable - data should either be able to support + refute hypothesis
should state that smth will happen - should never hypothesise that “no diff” - must be a positive statement
Variables
characteristic or condition that can vary amongst ppl
can be classified as IV or DV
continuous variable: allow decimals + fractions (distance, weight, time)
discrete variable: seperate indivisible categories/ whole values
Types of data
nominal
ordinal
interval
ratio
Nominal
categories without order
eg. different mental health disorders
Ordinal
categories with an order/hierarchy
eg. groups of intelligence levels (smart, average, dumb)
Interval data
numerical
No true 0 value
Equal interval between each number
eg. 1 degree to 2 degrees to 3 degrees
Ratio data
numerical
Does have a true zero
eg. height
Types of variables
discrete and continuous
Discrete
divisible
1,2,3 - no 1.5 etc.
eg. number of people
Continuous
not divisible cleanly
eg. height and weight - can be 10.5kg or 169.2cm
doesn’t have to be an option that ppl can pick but if averaged out, if it’s a meaningful number it’s fine
eg. people rating self esteem on scale 1-10, although 4.5 is not an option, it’s a meaningful value whereas averaging people 3.5 ppl is not meaningful
Study design
Descriptive research design
no experimentation - merely observe + record naturally occuring instances
eg. number of ppl sick in a class as percentage of class
Correlational research design
relationship bw two variables - would have to provide data for variable 1 and 2
eg. exercise + happiness - its about association NOT causation
Experimental research design
manipulation of IV
carefully controlled experimental conditions enhance internal validity
- decreases the likelihood of other explanations for results
eg. random assignment of treatment vs no treatment to determine whether treatment effect - rule out biases
Quasi-experimental research design
less stringent controlled conditions but still trying to determine causation
NO RANDOM ALLOCATION - eg. we use depressed ppl - we’re not causing the depression and manipulating IV - we’re using whats aready out there
Non-experimental research design
demonstrate relationship bw variables but don’t try to establish cause + effect
2 or more groups of ppl but one variable - eg. arts vs science students intelligence = faculty + intelligence but no causation
Population
everyone of relevance to a research study
group of ppl from population in research = sample
to be able to generalise findings from sample to pop sample must be representative
Probability sampling
simple random sampling: everyone in pop has equal chance of participating in study
often not possible
Non probability sampling
unknown population characteristics
Convenience sampling
accessing people who are easily accessible
likely to be biased so can set quotas for subgroups that need to be met in sample
Ethics
There’s a statement from the aus gvt (NHMRC)
research must has merit: benefits to knowledge, welfare, scientifically sound
literature review will occur to ensure merit
Integrity: honest reporting
justice: inclusion + exclusion of people is fair and no burden placed on one type of population, equitable access to benefits
beneficience: benefits outweigh/justify risks
respect: must respect their cutlure, autonomy, beliefs and allow them to make decisions regarding
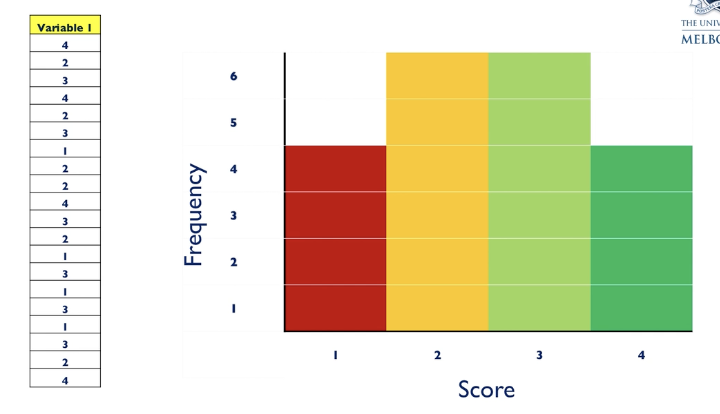
Frequency distribution graph: histogram
less ppl gave extreme responses
normally gives bell curve if netural = normal distribution
positively skewed = skewed to left
negatively skewed = skewed to right
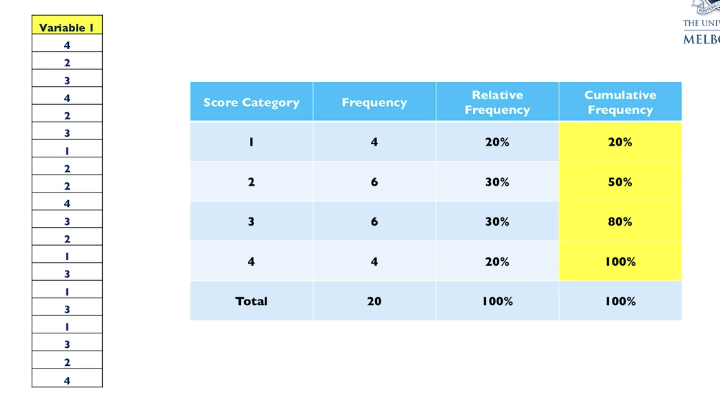
Frequency tables: cumulative frequency
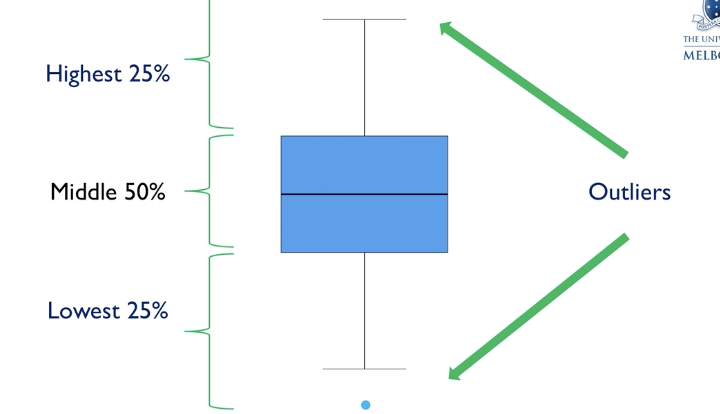
Box plot
lines are whiskers
Central tendency
what is most representative in a distribution/ what is most typical
Mean
the average
use with interval/ ratio data and normal distributions
Median
middle score
use with ordinal data and skewed distributions or when outliers are present
Mode
the most frequent score
use with discrete and nominal data
Variability
refers to how scores in a distribution differ or not
Measures of variability
range
inter-quartile range
standard deviation
Range
max score - min score
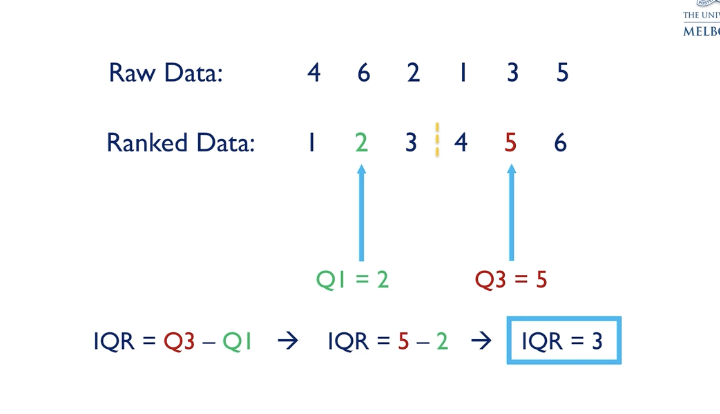
Interquartile range
rank data
split in halves and then get two middle values of each half and minus
can be used when mean used to measure central tendency
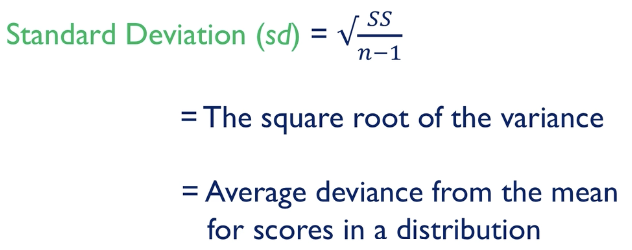
Standard deviation
the average amount that scores differ from the mean
Calculating standard deviation includes 3 steps
sum of squares (deviation scores squared added together)
variance
standard deviation
If we calculated all the deviation scores in distribution (how much each score deviated from mean)
would add to zero bc pos and neg cancel each other out
thats why we square them
Sum of squares
sum up the squared deviation scores (the top part of average for example)
Variance caclulation
this is dividing sum of squares by degrees of freedom to correct underestimation bias if we just used sample size
SS/n-1
Standard deviation final step
Take the square root of the variance
So square root(SS/n-1)
Logical reasoning
number of statements that are premises
Deductive arguments
start with broad/general premise to specific solution
valid =conclusion if guaranteed if all premises true
Inductive arguments
START FROM SPECIFIC
DOES NOT PROVIDE EXHAUSTIVE/ABSOLUTE SUPPORT FOR CONCLUSION
provides probable support
strong = premise provides good support
On JASP - what diff symbols mean
Ruler = ratio/interval
Bar chart = ordinal
3 circles = nominal
What to use on JASP for diff data
Radio and Interval: Histogram, Boxplot
Ordinal and Norminal: Bar chart, frequency table