3. Operations management
1/20
There's no tags or description
Looks like no tags are added yet.
Name | Mastery | Learn | Test | Matching | Spaced | Call with Kai |
|---|
No analytics yet
Send a link to your students to track their progress
21 Terms
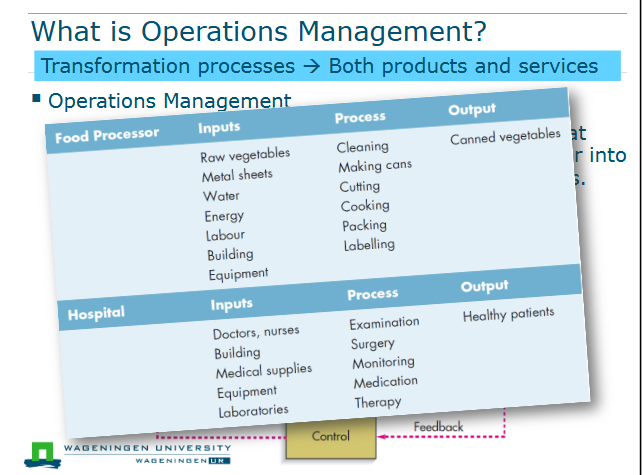
Operations Management
Management of the transformation process that transforms inputs such as raw material and labor into outputs in the form of finished goods and services.
Is transformation processes only for goods?
No for goods and services
Goal of operations management
The essence of the operations function is to add value during the transformation process: value-added is the term used to describe the difference between the cost of inputs and the revenue that is created by outputs.
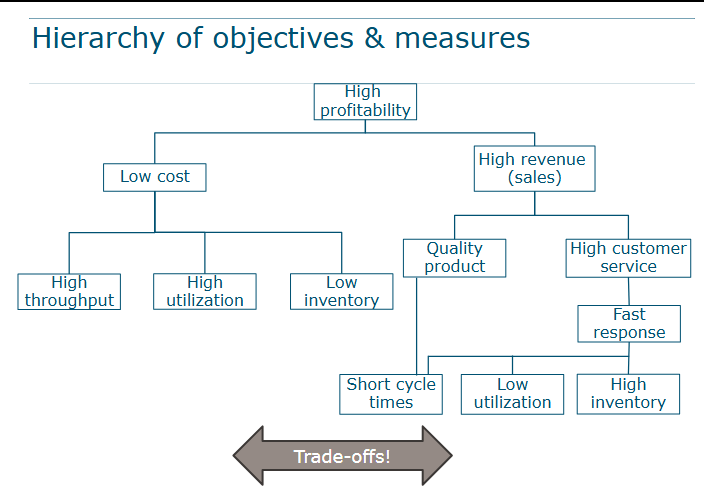
For most companies, profitability is a good measure for this value creation: profit = revneue - costs
Other ‘value’ measures are of course also relevant: quality, responsiveness, sustainability, resilience
Hierarchy of objectives & measures
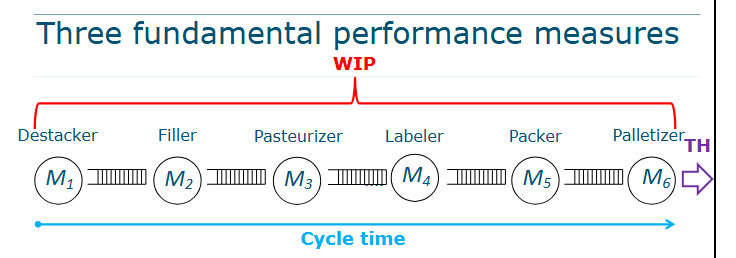
What are the three fundamental performance measures?
Throughput (TH): Number of good (quality) products processed per unit time, e.g. 8 bottles per second
Work in process (WIP): The inventory (number of products) in a line (machines and buffers), not including raw materials and finished goods inventory, e.g. 25,000 bottles
Cycle time (CT): time between the release of a product to the production line and its completion, e.g. 52 minutes
What is the correct relationship between average TH, CT and WIP?
Over the long-term, average work in process (WIP), throughput (TH), and cycle time (CT) for any stable process are related according to:
WIP = TH x CT
Known as Little’s law
How is the average computed for Little’s law?
TH = often: data on finished products over time
WIP = data on buffer/stock levels over time
CT = Often easiest: Compute TH and WIP using the data, and use Little’s law, WIP = TH x CT, to compute CT.
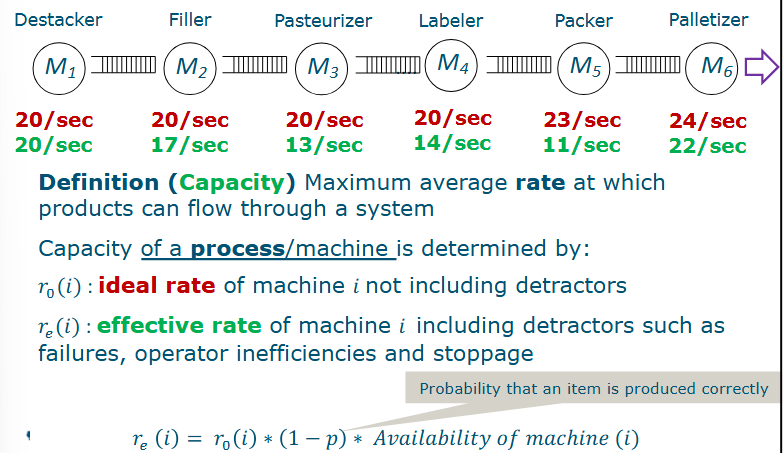
Capacity
Maximum average rate at which products can flow thorugh a system
What is the capacity of a process/machine determined by?
r0: ideal rate of machine i not including detractors
re: effective rate of machine i, including detractors such as failures, operator inefficiencies and stoppage
Bottleneck process
Constrains the capacity of the system
Bottleneck of a system: process with the highest utilization
Utilization
Throughput of machine = 8 bottles per second
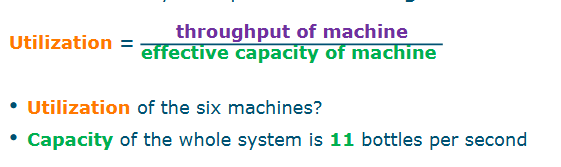
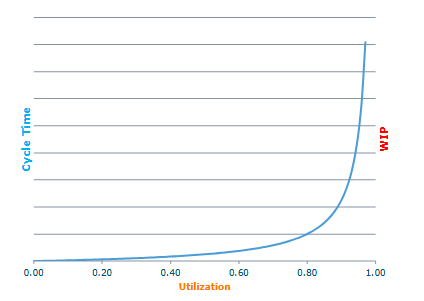
Utilization
Cycle time and average WIP increase with utilization in a highly nonlinear fashion
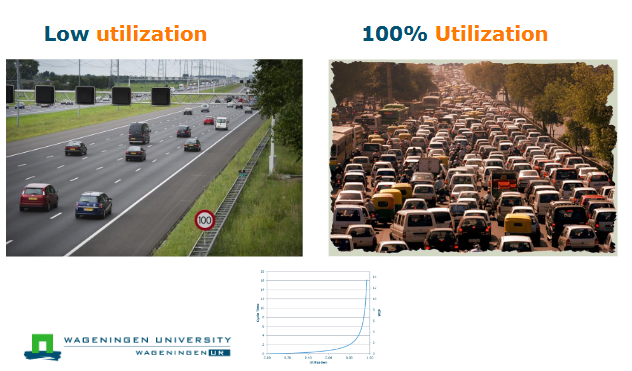
Utilization analogy
Capacity principle
Capacity in a steady state, the average output (throughput) of a system is strictly less than the average capacity
It cannot equal capacity due to variability
Key sources of variability in operations (processing time)
Variability in the processing time due to, e.g.:
Product variety
Operator speed
Quality problems
Failures
Setups
Key sources of variability in operations (times between arrivals)
Variability in the times between arrivals of entities to a process due to e.g.:
Customer decisions
Transportation delays
Quality problems
Upstream processing stops
Queueing
At a single processing station with no limit on the number of entities that can queue up, the waiting time (WT) due to queuing is a function of a variability factor (V), a utilization factor (U) and average processing time (T)
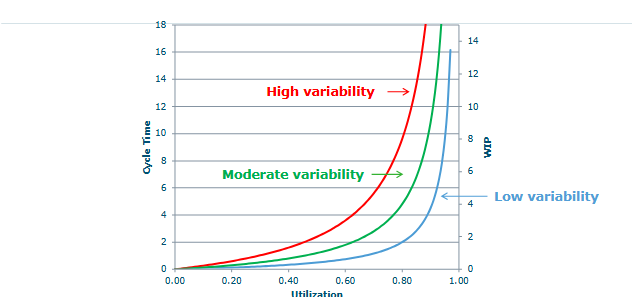
Influence of variability on cycle time and WIP
Utilization often has a much higher impact on cycle time/WIP than variability
However, increasing cpacity is costly, therefore high utilizaiton is desirable
Therefore variability reduction is often key to achieving high performance
Variability
Increasing variablity always degrades the performance of a (production) systme
Variability buffering
We often cannot completely get rid of variability.
Variability will then have to be buffered by some combination of:
Inventory (WIP)
Capacity
Time
The appropriate mix of variability buffers depends on:
Physical characteristics of the system
Strategy of the system
Afweging tussen variability of:
Larger inventory (WIP) level
Increased cycle times
Long lead times and/or poor customer service
Lost throughput
Underutilized (wasted) capacity