1.2.8 consumer and producer surplus
1/14
There's no tags or description
Looks like no tags are added yet.
Name | Mastery | Learn | Test | Matching | Spaced | Call with Kai |
|---|
No analytics yet
Send a link to your students to track their progress
15 Terms
What is consumer surplus?
Consumer surplus is the difference between the price consumers are willing to pay for a good and the price they actually pay in the market.
What is producer surplus?
Producer surplus is the difference between the price producers are willing to supply a good for and the price they actually receive.
What does consumer surplus represent?
It represents the welfare or benefit gained by consumers from buying a good at a market price lower than they were willing to pay.
What does producer surplus represent?
It represents the welfare or benefit gained by producers from selling a good at a market price higher than the minimum price they were willing to accept.
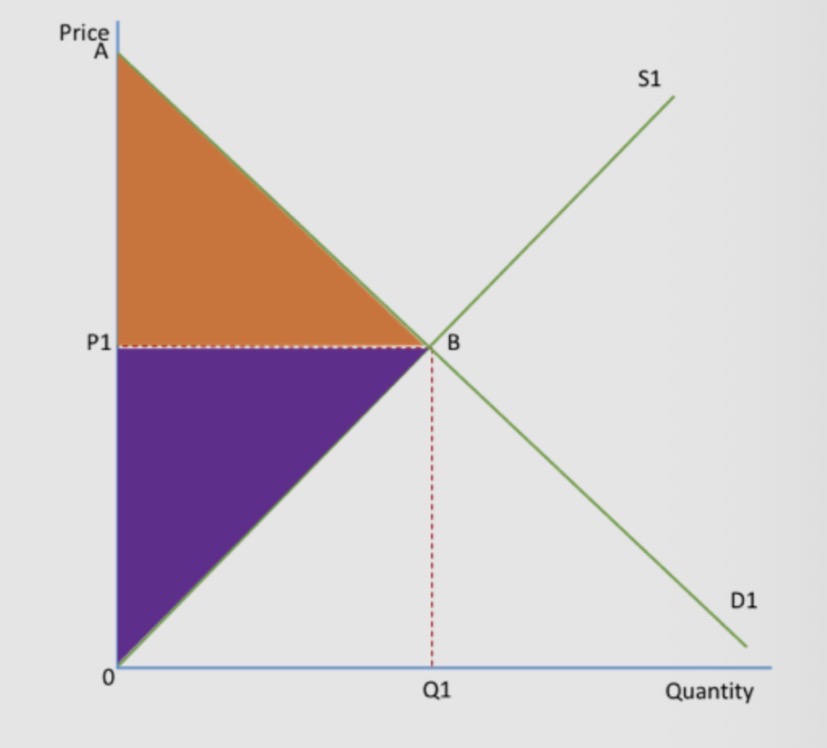
Draw and explain a consumer surplus diagram
Draw a demand curve and supply curve with equilibrium price and quantity. Consumer surplus is the triangular area above the market price and below the demand curve up to the equilibrium quantity.
Draw and explain a producer surplus diagram
Draw a demand curve and supply curve with equilibrium price and quantity.
Producer surplus is the triangular area below the market price and above the supply curve up to the equilibrium quantity.

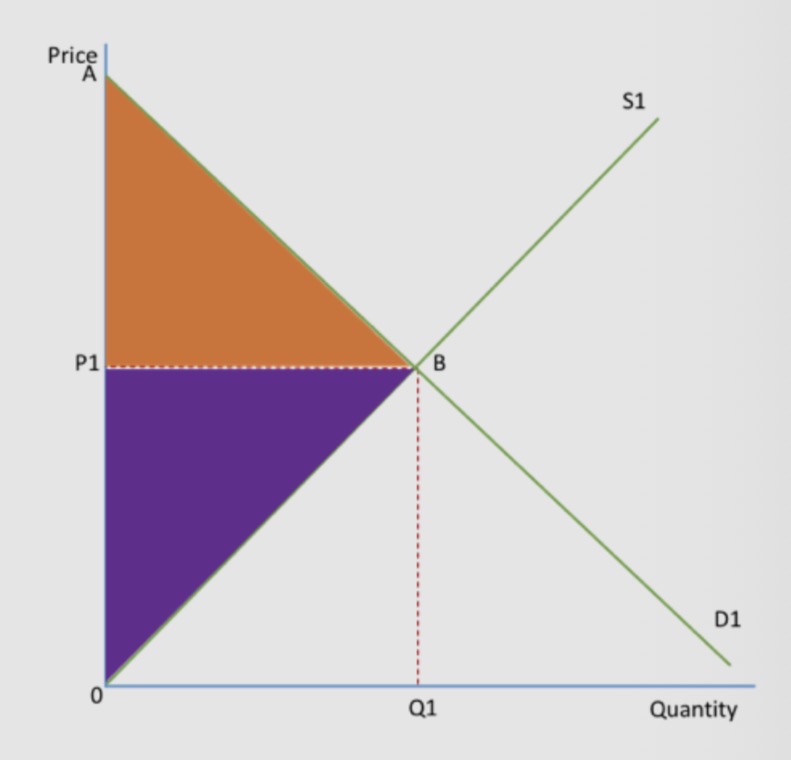
Draw and explain consumer and producer surplus on the same diagram
Draw demand and supply curves with equilibrium price and quantity. Consumer surplus is the area above the price and below demand, while producer surplus is the area below the price and above supply.
What is society surplus?
Society surplus is the total welfare in a market and= CS + PS
Why does equilibrium maximise community surplus?
At equilibrium the price mechanism allocates resources efficiently so total welfare (consumer surplus + producer surplus) is maximised.
What economic concept describes the price mechanism maximising welfare?
Pareto efficiency.
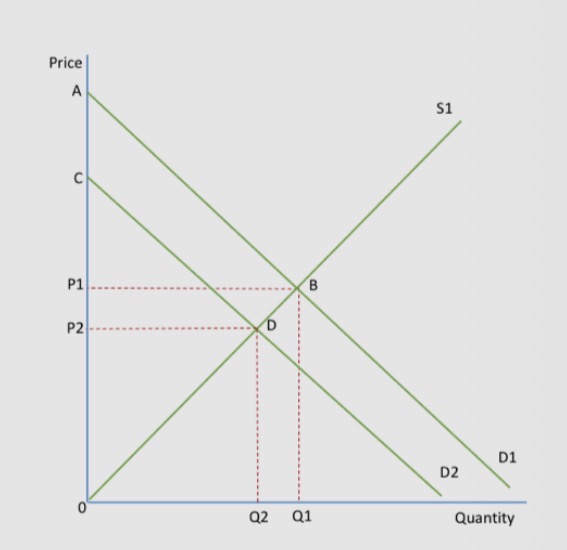
Draw and explain consumer and producer surplus with a decrease in demand
Draw a demand curve shifting left. Equilibrium price and quantity fall. Consumer surplus decreases and producer surplus also decreases.
Draw and explain consumer and producer surplus with an increase in demand
Draw a demand curve shifting right. Equilibrium price and quantity rise. Consumer surplus increases and producer surplus also increases.

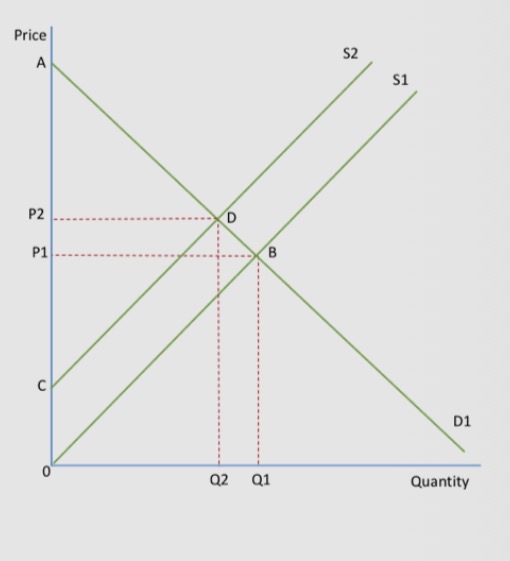
Draw and explain consumer and producer surplus with a decrease in supply
Draw a supply curve shifting left. Equilibrium price rises and quantity falls. Consumer surplus decreases and producer surplus decreases.
Draw and explain consumer and producer surplus with an increase in supply
Draw a supply curve shifting right.
Equilibrium price falls and quantity rises.
Consumer surplus increases and producer surplus increases.
How can consumer and producer surplus be used to evaluate policies?
Government policies such as taxes, subsidies and tariffs can be analysed by examining how they affect consumer surplus and producer surplus.