IBDP ECONOMICS Chapter 3: Elasticities
1/60
There's no tags or description
Looks like no tags are added yet.
Name | Mastery | Learn | Test | Matching | Spaced | Call with Kai |
|---|
No analytics yet
Send a link to your students to track their progress
61 Terms
What is price elasticity of demand (PED)?
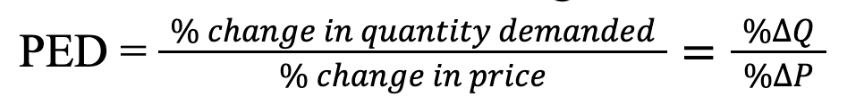
a measure of the responsiveness of the quantity of a good demanded to changes in its price. PED is calculated along a given demand curve. In general, if quantity demanded is highly responsive to a chagrin price, demand is referred to as being price elastic; if quantity demanded is not very responsive, demand is price inelastic
What is the formula that is used to calculate PED?
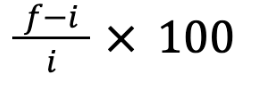
What is the formula that used to calculate % change?
“final minus initial, over initial”
Since price and quantity are ________ related, PED will be a ________ number. However, the common practice is to drop the minus sign and consider PED as a positive number.
negatively, negative
For what value of PED is demand price INELASTIC
0 < PED < 1
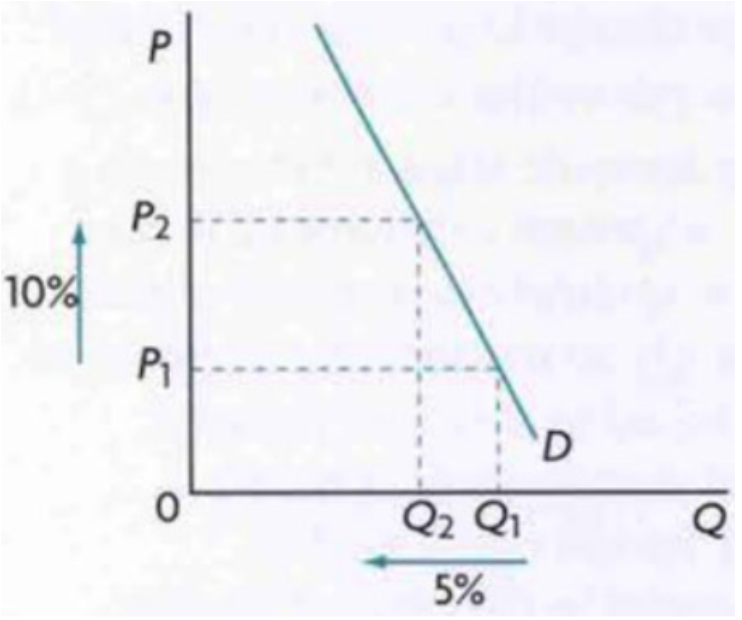
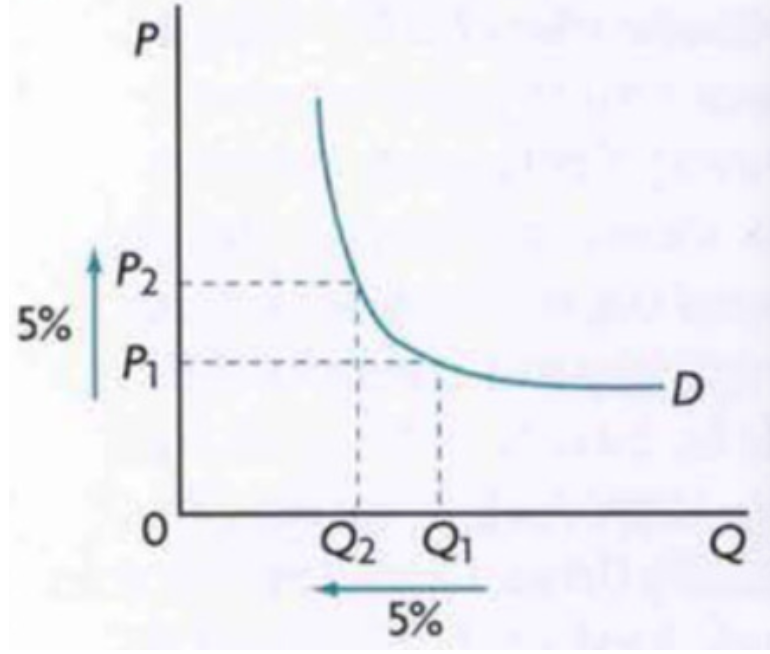
What does it mean when demand is price inelastic? Also, draw what this would look like as a demand curve.
The PED value less than 1 means that quantity demanded is relatively unresponsive to changes in price, making demand price inelastic.
For what value of PED is demand price ELASTIC
1 < PED < ∞
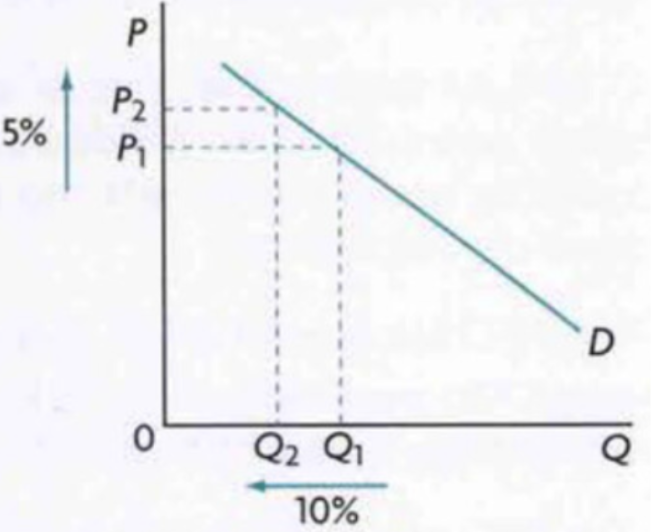
What does it mean when demand is price elastic? Also, draw what this would look like as a demand curve.
The PED value greater than 1 means that quantity demanded is relatively responsive to changes in price, making demand price elastic
what are the three special cases of PED?
unit elastic
perfectly inelastic
perfectly elastic
for what value of PED is demand unit elastic?
PED=1
What does it mean when demand is unit elastic? Also, draw what this would look like as a demand curve.
% change in quantity demanded = % change in price
for what value of PED is demand perfectly inelastic?
PED=0
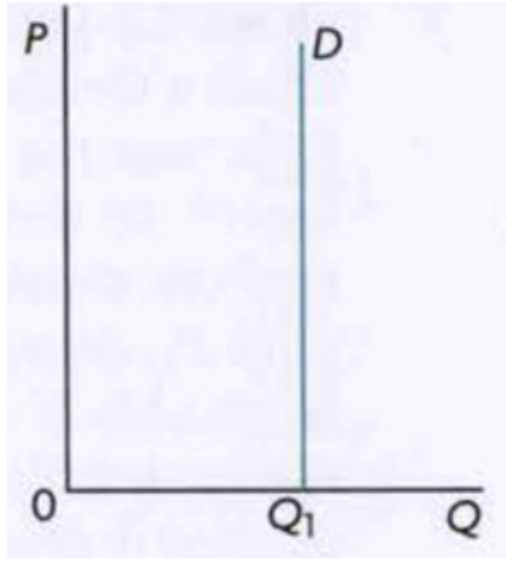
What does it mean when demand is perfectly inelastic? Also, draw what this would look like as a demand curve.
% change in quantity demand is 0.
When quantity demanded=0, that makes the numerator 0. This means that no matter what the % change in price is, the PED will equal 0, making demand perfectly inelastic
for what value of PED is demand perfectly elastic?
PED=∞
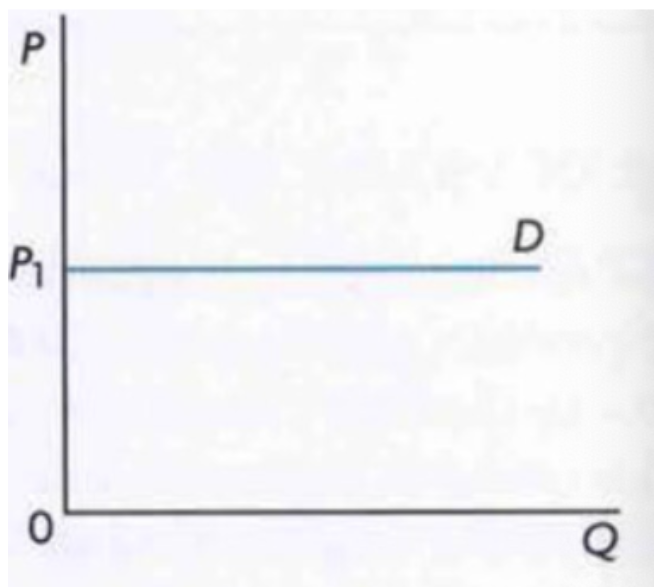
What does it mean when demand is perfectly inelastic? Also, draw what this would look like as a demand curve.
% change in price results in an infinitely large response in quantity demanded.
When there are increases in price, consumers are very responsive and quantity demanded will drop to 0. On the other hand, when price drops, there will be infinite quantity demanded. This situation represents a situation where demand is perfectly elastic
The steepness (slope) of teh demand curve can tell us if it is elastic or inelastic.
Flatter demand curve = more _____ demand
Steeper demand curve = more ______ demand
elastic, inelastic
but, you cannot solely rely on how steep a demand curve looks because depending on the scales, one may look steeper than another simply because its scale is more compressed on one graph, making it look more steep when it could in reality be of the same PED as a graph that looks flatter. You may look at steepness of demand curves when they intersect one another/are plotted on the same graph
What are the determinants of PED?
number and closeness of substitutes
necessities vs luxuries
length of time
proportion of income spent on goods
explain the following determinant of PED: number and closeness of subsitutes
the more substitutes a good has, the more elastic is its demand. If the price of a good with a lot of substitutes increases, consumers will switch over to that cheaper substitute. If a good/service has few or no substitutes, then an increase in price will likely lead to a very small drop in quantity demanded, meaning that demand is price inelastic
explain the following determinant of PED: necessities vs luxuries
necessities are goods/services that are considered essential to our lives. Luxuries are not necessary or essential. The demand for necessities is less elastic than demand for luxuries. If a good/service is a necessity, when the price increases, demand is likely to stay inelastic because no matter the price, it is still essential to our lives and we will continue to buy it. However, if a good/service is a luxury, we do not need it to live so if price increases, people will stop buying it, making demand price elastic
explain the following determinant of PED: length of time
the longer the time period in which a consumer makes a purchasing decision, the more elastic the demand. As time goes by, consumers have the opportunity to consider whether they really want to be good, and to get information about alternatives to the good in question. For instance, if there is an increase in the price of gas, there is little consumers can do to switch to a different alternative initially, but over time, they can switch to other fuels and demand for gas becomes more elastic
explain the following determinant of PED: proportion of income spent on goods
the larger the proportion of one’s income needed to buy a good, the more elastic the demand. A good such as a pen takes up very little income, whereas a card takes up a much larger proportion. For the same percentage increase in the price of pens and in the price of cars, the response in quantity demanded is likely to be greater in the case of the car than in the case of pens, making demand for cars more elastic and demand for pens more inelastic
What is total revenue and how do you calculate it?
total revenue is the total amount of money received by firms when they sell goods and services. It is calculated by multiplying the price of the good by the quantity of the good sold: TR=PxQ
When demand is elastic, an increase in price causes a _____ in total revenue. A decrease in price causes a _____ in total revenue.
When demand is inelastic, an increase in price causes an _____ in total revenue. A decrease in price causes a _____ in total revenue.
When demand is unit elastic, a change in price ________ change in total revenue.
fall, rise
increase, decrease
does not cause
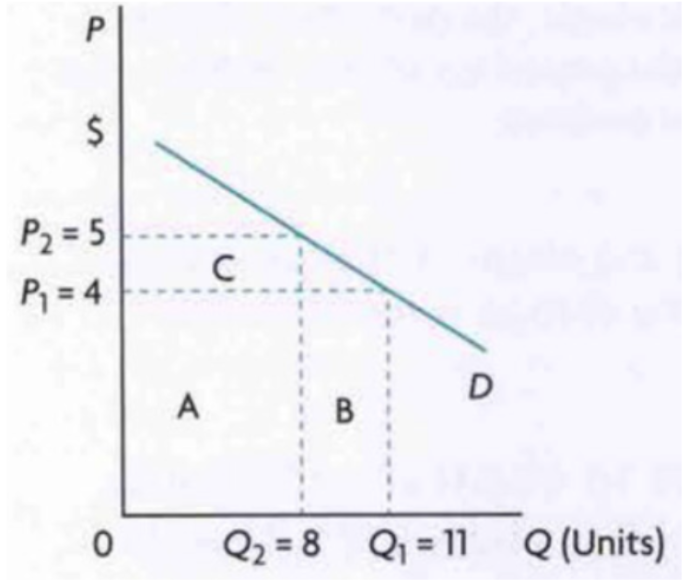
Using a diagram, explain what happens to total revenue when price increases for a good with elastic demand.
When looking at initial price and quantity (P1 and Q1), the total revenue is given by the product of the values at which P1 and Q1 sit (P1=4, Q1=11. 4 x 11 = 44). In the diagram to the right, this is the area of A and B.
When price increases to P2, quantity decreases to Q2. The total revenue is now given by the product of the values at which P2 and Q2 sit (P2=5, Q2=8. 5 x 8 = 40). In the diagram, this is the area of A and C. By increasing the price, area B was lost and area C was gained. However, area C is smaller than area B, therefore resulting in a total revenue fall
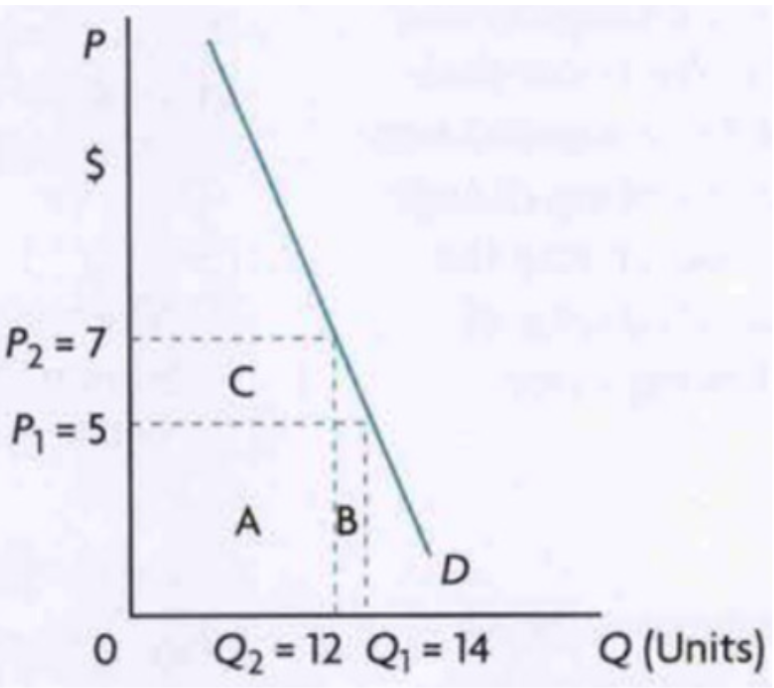
Using a diagram, explain what happens to total revenue when price increases for a good with inelastic demand.
When looking at the initial price and quantity (P1 and Q1), the total revenue is given by the product of the value at which P1 and Q1 sit (P1=5, Q1=14. 5 x 14 = 70). In the diagram to the right, this is the area of A and B.
When price increases to P2, quantity decreases to Q2. The revenue is now given by the product of the values at which P2 and Q2 sit (P2=7, Q=12. 7 x 12 = 84). In the diagram this is area A and C. By increasing the price, area B was lost and area C was gained. Because area C is larger than area B, there is an increase in total revenue
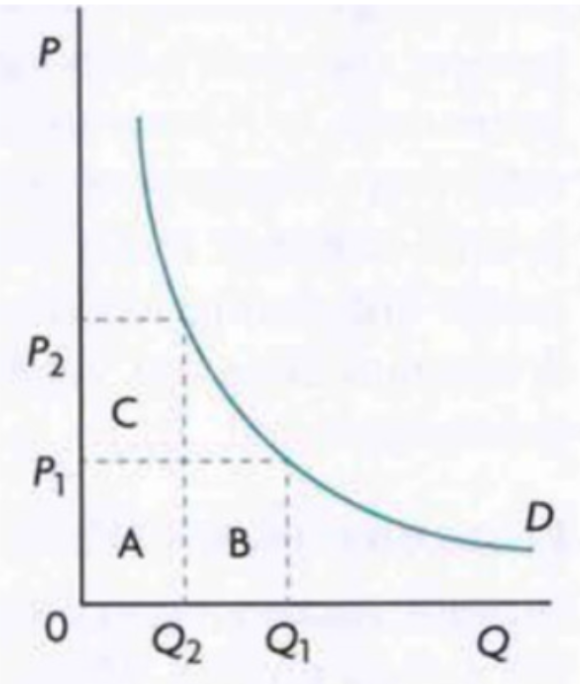
Using a diagram, explain what happens to total revenue when price increases for a good with unit elastic demand.
In unit elastic, as price and quantity change, the gain in total revenue is matched exactly by the loss, meaning that the total revenue remains unchanged. The total revenue is calculated the same way as above by taking the values at which P and Q sit and finding their product.
Why should a firm consider PED when trying to increase total revenue?
firms must take into account PED when considering changes in the price of its product. If a firm wants to increase total revenue, it must determine if its product is elastic or inelastic, and that will tell the firm whether they should drop or increase the price.
* Make sure to not confuse profit and total revenue.
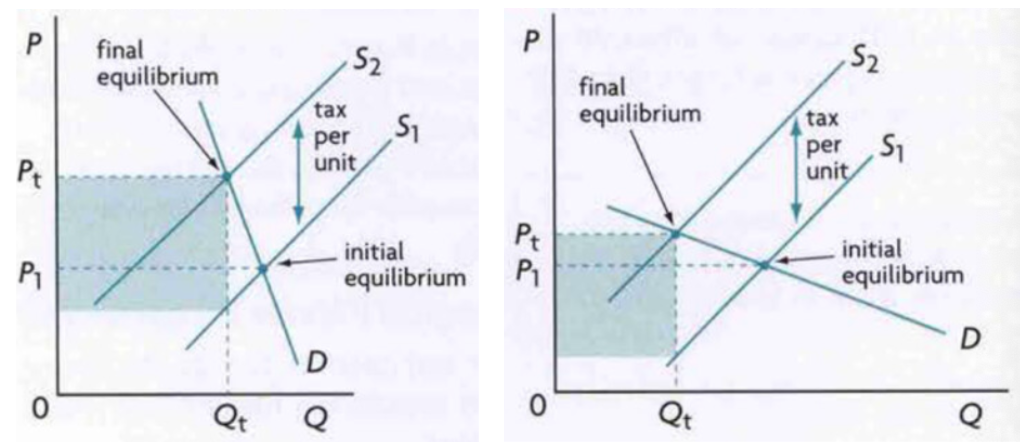
why should governments consider PED when trying to decide what to impose indriect taxes on?
The lower the price elasticity of demand for the taxed good, the more government tax revenue is produced.
Considering the diagrams. One represents a good with inelastic demand (right) and the other represents elastic demand (left). The shaded region shows government revenue. When there is inelastic demand, the government is able to collect more revenue. For this reason, indirect taxes are usually imposed on goods like cigarettes and gas which have low PED values
what are primary commodities?
Primary commodities: goods arising directly from the use of natural resources, of the factor of production land
Primary commodities have a _____ PED, which is usually ____ than the PED of manufacture products.
low, lower
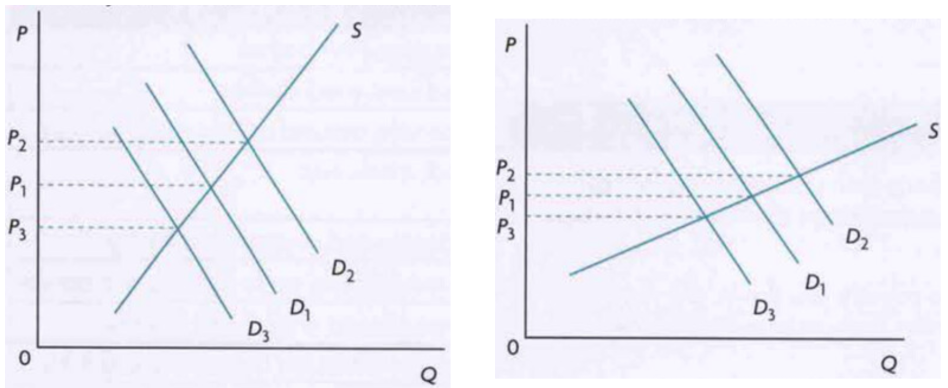
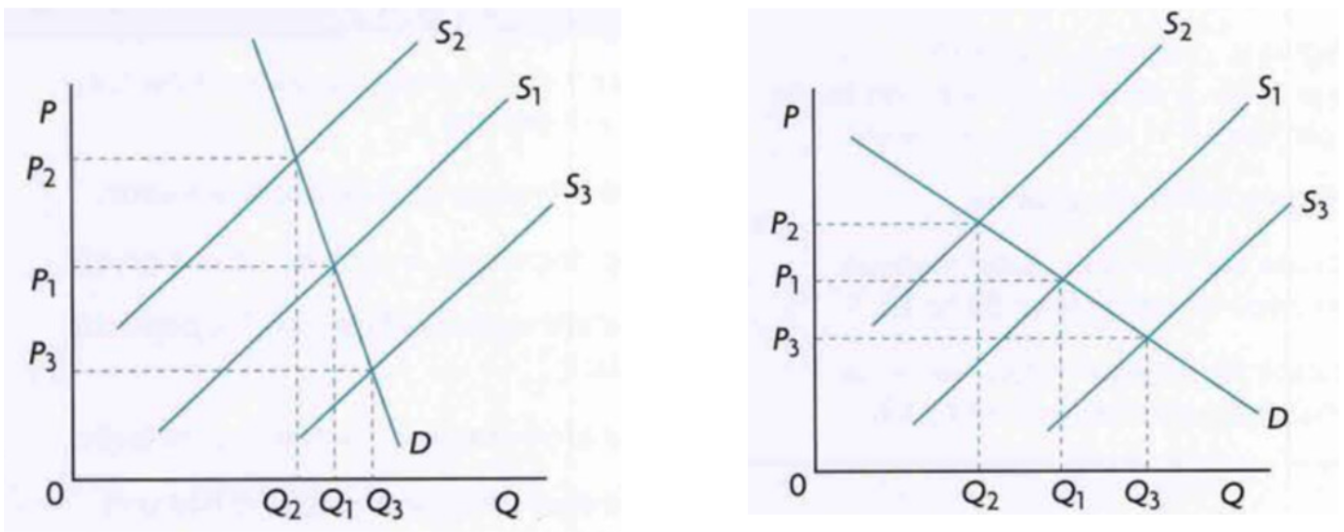
why is the inelastic demand for primary commodities an issue?
The inelasticity of demand for primary commodities actually creates a relatively large issue because there are large fluctuations in primary commodity prices, which also affects producer’s incomes. Look at the attached diagrams. The left graph is a product with inelastic demand. When the supply curve shifts, it causes dramatic changes in price (either increasing or decreasing it a lot). When looking at the right graph demonstrating a product with elastic demand, the same distance changes in the supply curve results in less dramatic changes in price in either direction.
What are manufactured goods?
goods produced by labor usually working together with capital and raw materials
Describe the elasticity for primary commodities (such as food and raw materials), and for manufactured products.
Food has a highly price inelastic demand because it is a necessity and it has no substitutes (you cannot eat wood or metal). The same applies for other primary products.
Demand for manufactured products tends to be more price elastic because these products, even if they may be necessities, usually have subsidies. Therefore, a price change causes a larger impact in the quantity demanded compared to price changes of primary commodities
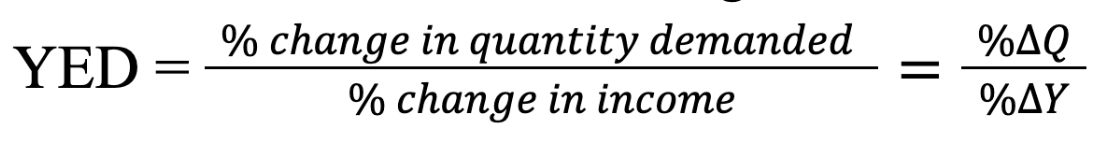
What is income elasticity of demand (YED)?
a measure of the responsiveness of demand to changes in income, and involved demand curve shifts. IT provides information on the direction of change of demand given a change in income (increase or decrease) and the size of the changes (size of demand curve shifts)
what is the formula for YED?
there are two different kinds of information the YED value provides. What are they?
The sign of YED tells us if the good is normal or inferior:
YED>0: a positive YED indicates that the good in question is normal. Demand for the good and income change in the same direction (both increase, or both decrease). Most goods are normal goods
YED<0: a negative YED indicates that the good in question is inferior. Demand for the good and income move in opposite directions (as one increases, the other decreases; as one decreases, the other increases)
The numerical value of YED tells us if the good is a necessity or a luxury:
YED<1: necessities. If a good has a YED that is positive but less than one, it has income inelastic demand. A percentage increase in income produces a smaller percentage increase in quantity demanded. Necessities are income inelastic goods.
Necessities like food, clothing, and housing tend to have a YED that is positive, but less than one (they are normal goods that are income inelastic). In the case of food, as income increases, people buy more goods but the amount of income spent on food increases more slowly than income.
YED>1: luxuries and services. If a good has a YED that is greater than on, it has income elastic demand. A percentage increase in income produces a larger percentage increase in quantity demanded. Luxuries and services are income elastic.
Luxuries, such as jewelry, expensive countries, private education, and eating at restaurants are income elastic. As income increases, the amount of income spent on such goods increases faster than income.
how is something deemed to be a luxery vs necessity?
What is considered a necessity vs a luxury depends on income level. For some people (with very low incomes), god can be a luxury. As income increases, certain items that used to be luxuries become necessities. For example, Coke and coffee for many poor people are considered luxuries, whereas for wealthier consumers they have become necessities
What is an engel curve? what is on the y and x axis? and what kinds of things are demonstrated on the engel curve?
The ENGEL CURVE is a much more accurate way of illustrating YED than demand curve shifts.
Y axis represents the income of a consumer per week
X axis represents quantity of something consumed
The Engel curve can demonstrate normal and inferior goods
The Engel curve can also demonstrate income inelastic or income elastic.
Engel Curve: show a continuum. At very low incomes a good may be a luxury, as income increases it becomes a necessity, and finally at high income levels it becomes inferior.
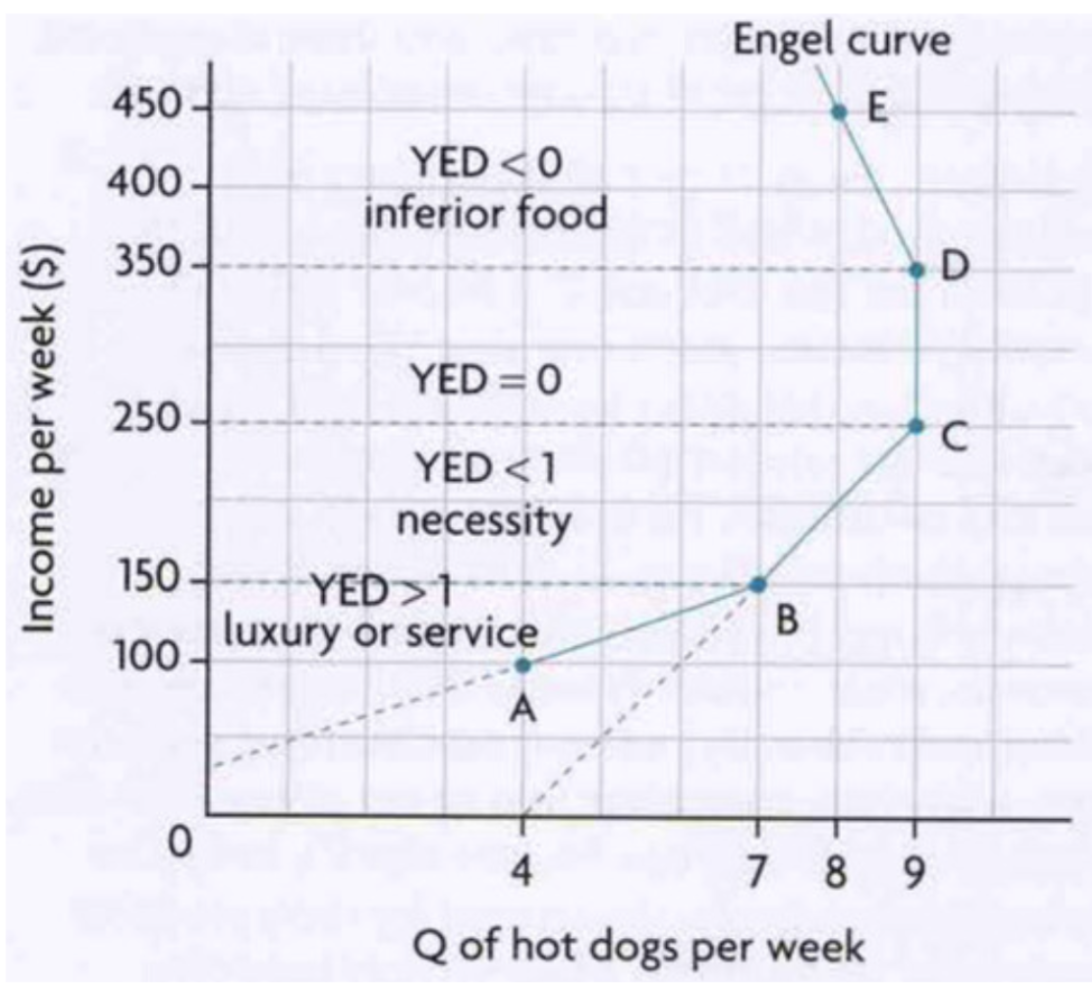
how does the engel curve represent normal and inferior goods?
YED>0 in the upward sloping part of the curve showing quantity and income both increasing, indicating the good is normal
YED<0 in the downward sloping part showing quantity decrease as income increases, indicating the good is inferior.

how does the engel curve represent luxuries and necessities, or income elastic and income inelastic?
To distinguish between a luxury and a necessity on the upward sloping part of the Engel Curve, imagine each segment of the Engel curve extends backward to touch either the vertical axis or the horizontal axis, as shown by the dotted lines in the diagram
YED>1 if the line touches the vertical axis, as with the line AB, so that is is a luxury or service
YED<1 if the line touches the horizontal axis, as with line BC, so that it is a necessity

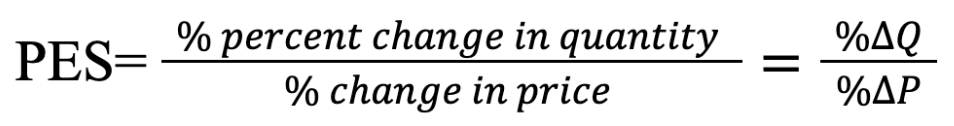
What is price elasticity of supply (PES)?
a measure of the responsiveness of the quantity of a good supplied to changes in its price. PES is calculated along a given supply curve. In general, if there is a relatively large responsiveness of quantity supplied, supply is referred to as being elastic. If there is a relatively small responsiveness, supply is inelastic
what is the formula for PES?
Because of the ______ relationship between price and quantity supplied, PES is a _____ value.
for what value of PES is supply relatively price inelastic?
PES < 1
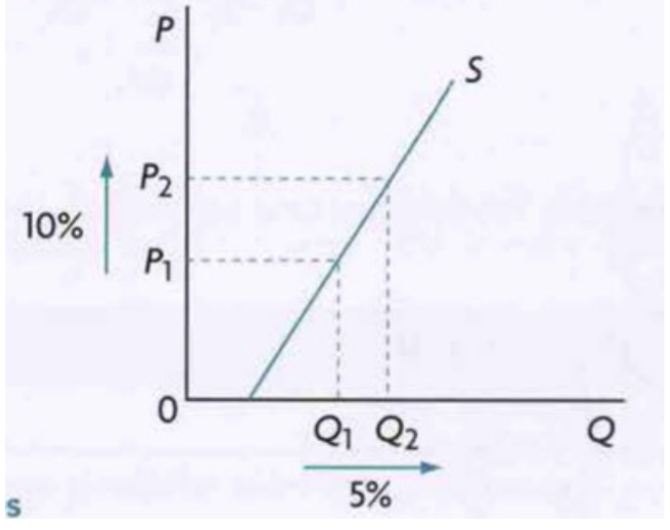
What does it mean when supply is relatively inelastic? Also, draw what this would look like as a supply curve.
% change in quantity supplied is smaller than % change in price
When the value of the PES is less than one, the quantity supplied is relatively unresponsive to changes in price, and supply is price inelastic or inelastic
for what value of PES is supply relatively price elastic?
PES > 1
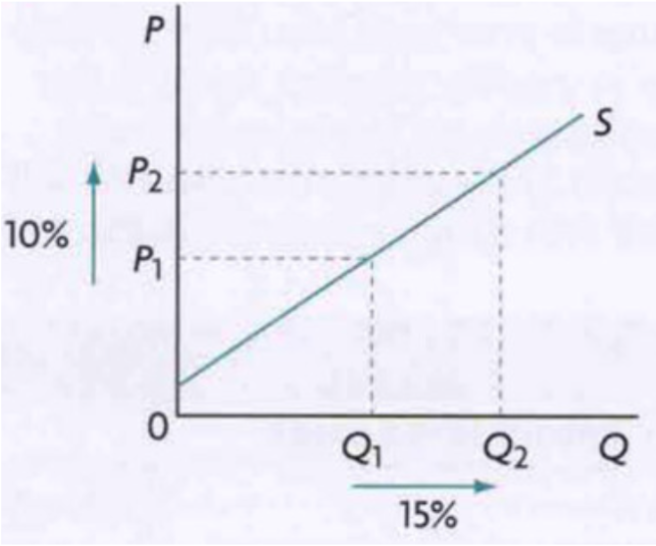
What does it mean when supply is relatively elastic? Also, draw what this would look like as a supply curve.
% change in quantity supplied is larger than the % change in price
When the value of the PES is greater than one, the quantity supplied is relatively responsive to price changes, and supply is price elastic or elastic.
for what value of PES is supply unit elastic?
PES = 1
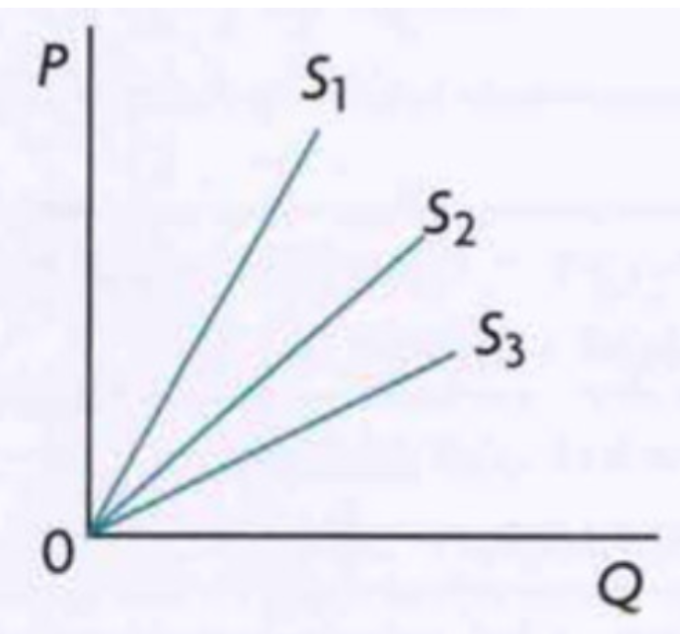
What does it mean when supply is unit elastic? Also, draw what this would look like as a supply curve.
% change in quantity supplied = % change in price
When the value of PES is equal to one, supply is unit elastic, meaning there is unitary PES.Any supply curve that passes through the origin has a PES equal to unitary. The reason for this is that along any straight line that passes through the origin, between any two points on the line the % change in the vertical axis is equal to the % change in the horizontal axis. Therefore, for the lines that pass through the origin, it is important not to confuse the steepness of the curve with the elasticity of the curve.
for what value of PES is supply perfectly inelastic?
PES = 0
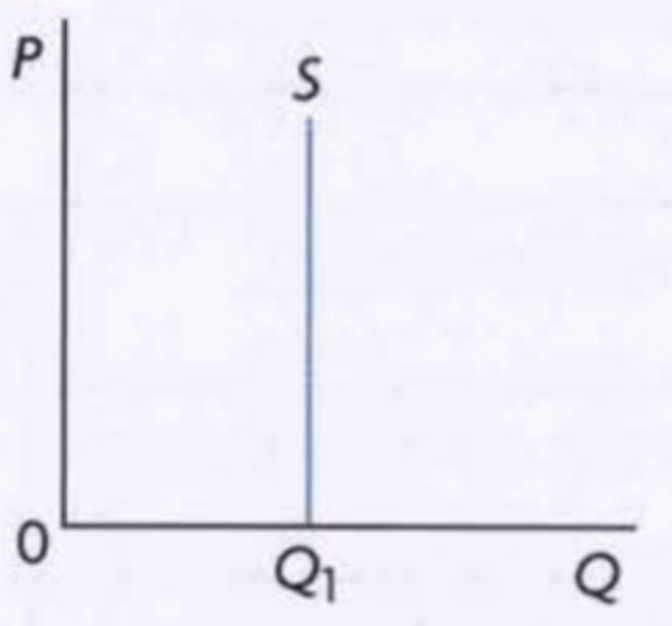
What does it mean when supply is perfectly inelastic? Also, draw what this would look like as a supply curve.
% change in quantity supplied is 0, so no matter the % change in price, the numerator is 0 and the PES will be 0.
When the value of PES is equal to 0, supply is said to be perfectly inelastic
for what value of PES is supply perfectly elastic?
PES = ∞
What does it mean when supply is perfectly elastic? Also, draw what this would look like as a supply curve.
% change in quantity is infinite. Any change in price leads to an infinitely large response in quantity supplied.
When the PES is equal to infinity, supply is said to be perfectly elastic.
List the determinants of PES.
Amount of time
mobility of factors of production
spare (unused) capacity of firms
ability to store stock
rate at which costs increase
explain the following determinant of PES: amount of time
the amount of time firms have to adjust their inputs (resources) and the quantity supplied in response to changes in price. Over a very short time, the firm may not be unable to increase/decrease any of its inputs to change the quantity it produces. In this case, supply is highly inelastic and may even be perfectly inelastic (PES=0). For example, when a fishing boat returns from a fishing trip, it only has so many fish in the boat to supply the market with. Even if the price of fish rises (and the fisherman wants to sell more fish) there can be no response in quantity supplied. AS the length of time that firms have increases, the responsiveness of quantity supplied to price changes begins to rise, and PES increases. Larger amount of time firms have to adjust their inputs=larger PES (more elastic)
explain the following determinant of PES: mobility of factors of production
the more easily and quickly resources can be shifted out of one line of production and into another (where price is increasing, the greater the responsiveness of quantity supplied to changes in price, and hence the greater the PES (more elastic). For example, a farm worker can move more easily from planting strawberries to corn than to moving to car production
explain the following determinant of PES: spare (unused) capacity of firms
some firms may have a capacity to produce that's not being used (i.e. machinery not being used during some hours of the day). If this occurs, it is relatively easy for a firm to respond with increased output to a price rise. But if the firm’s capacity is fully used, it will be more difficult to respond to a price rise. The greater the spare (unused) capacity, the higher the PES (the more elastic the supply)
explain the following determinant of PES: ability to store stocks
some firms store stocks of output they produce but do not sell right away. Firms that have an ability to store stocks are likely to have a higher PES for their products than firms that cannot store stocks
explain the following determinant of PES: rate at which costs increase
if the cost of producing extra output increases rapidly, then supply will be inelastic, as firms will have difficulty explaining their output since they are unlikely to want to incur large costs. On the other hand, if the costs of producing more output rise slowly, it will be easier for firms to expand their output so supply will be elastic
Generally, primary commodities have a _____ PES value than manufactured products. Why is this so?
lower; This is due to the time needed for quantity supplied to respond to price changes. In agriculture, it takes a long time for resources to be sifted in and out of agriculture. Farmers need at least a planting season to be able to respond to higher prices. In the case of other primary products like oil, natural gas, and minerals, time is needed to make necessary investments and to begin production. Because of costs associated with this process, firms do not respond quickly to price increases, and wait for a serious shortage in the commodity to arise before they take actions to increase production
Explain how inelastic supply is detrimental to short term price fluctuations and revenue for primary producers.
we know that price inelastic demand for primary products was an issue that contributed to short term price and revenue instability for producers. Inelastic supply of agriculture and other primary products also contributes to price and income instability for primary producers.
The diagram on the left shows a fluctuating demand curve with inelastic supply (more steep), which is the typical case of primary products. The diagram on the right shows a fluctuating demand curve with an elastic supply curve, which is more typical of manufactured products. Clearly, price changes are more dramatic in the case of inelastic supply and large price changes mean large revenue changes, or unstable revenue for producers of primary commodities