OM Week 2
1/76
There's no tags or description
Looks like no tags are added yet.
Name | Mastery | Learn | Test | Matching | Spaced | Call with Kai |
|---|
No analytics yet
Send a link to your students to track their progress
77 Terms
What was Dell’s solution to having no single source of truth?
Create two data foundations
Harmonize: consolidate sources
Visualize: single dashboard
Why can’t all companies require customers to pay upfront?
B2B Customers expect credit: Hospitals, governments, corporations demand Net 30/60/90
High Value Purchases: Boeing can’t ask airlines for $200M upfront
Competitive Pressure: If competitors offer financing, you must too
Industry Norms: Construction uses progress payments; restaurants buy ingredients before customers arrive
Trust and Brand Power: Unknown brands can’t demand upfront payment (Ex: A startup selling laptops - no chance)
Why did Dell’s Upfront Payment Model work?
Individual consumers (not B2B)
Affordable price points ($1-3K)
Strong brand trust
Competitors didn’t offer financing
Dell PC Assembly Process

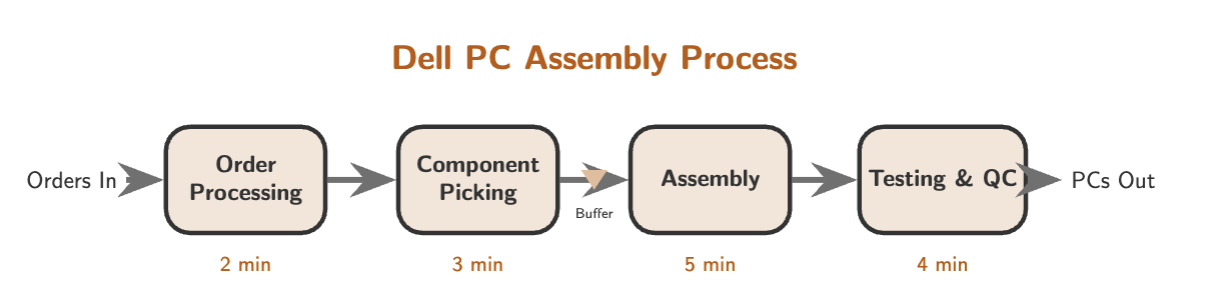
What is the bottleneck within Dell’s PC assembly process?
Assembly
Bottleneck
The step that limits process capacity and has the lowest output rate (longest cycle time)
Why is it important to identify the bottleneck of a process?
Bottleneck limits the entire system
Work piles up before it
Improving non-bottlenecks won’t help improves the processes effciency

What is the cycle time of the system?
5 minutes
Station CT Formula
Processing Time/# Resources
System CT Formula
Bottleneck’s CT (the max)
What is Cycle Time?
How often does a completed unit come off the production line?
The “Rhythm” of production
What is Throughput Time?
Total time for one unit through the entire process
How much time total does one unit take to be built?
Also called Flow time, Lead time
= Sum of all processing times
Rush Order Flow Time
Minimum throughput time (no waiting)
In an empty system, your unit takes the combined total time of each step within the system
Cycle Time and Throughput Time are independent of one another (True/False)
True
Cycle Time depends on the bottleneck only while Throughput Time depends on the number of steps (and total time of each step)
When you add more steps, CT stays the same (if the bottleneck is unchanged), however, the TT will increase
Output Rate Formula
Output Rate = 1/Cycle Time = 1/Bottleneck Time
Output is entirely set up by the bottleneck (True/False)
True
Speeding up other steps WON’T help
Process Capacity
Maximum output the process can produce
Process Capacity formula
Capacity = 1/Bottleneck CT
Actual Output (Flow Rate) Formula
Actual Output (Flow Rate) =. min(Demand Rate, Capacity)
If a system is Supply-Constrained:
What can we say about the relationship between demand and capacity
What can we say about the flow rate?
What is the limit of the system?
Demand > Capacity
Flow Rate = Capacity
The Process is the limit
If a system is Demand-Constrained:
What can we say about the relationship between demand and capacity
What can we say about the flow rate?
What is the limit of the system?
Demand > Capacity
Flow Rate = Demand
The Market is the limit
Utilization Formula
Utilization = Flow Rate/Capacity
Utilization is always <= 100% (True/False)
True
What is true about a Demand-constrained process
It has idle time
Time for Q Units Formula
Time = TT + CT x (Q-1)
Cost of Direct Labor Formula
CODL = Total Wages Per Hour/Flow Rate
What is true about Buffers when there is uncertainty in the bottleneck?
It will always be useful
Rush Order Flow Time assumes No Buffer (True/False)
True
Step Capacity
What ONE step can handle
System Capacity
What the WHOLE process can handle
System Capacity Formula
System Capacity = min(all Step Capacities)
Step Capacity Formula
Step Capacity = 1/Activity Time
Each step has its own capacity
Flow Rate is limited by Step or System Capacity?
System
Improving a bottleneck step does NOT increase system capacity
We assume no supply constraints
Utilization tells you…
Where your money is being wasted (idle resources) and where you’re maxed out (bottleneck)
Utilization
The fraction of capacity that is actually being used (How busy is the resource/)
Utilization reveals:
Waste: Low utilization = paying for unused capacity
Bottleneck: Highest utilization = the constraint
Imbalance: Big gaps in utilization = poorly designed process
Utilization Formula (2 ways)
Utilization of a Step = Flow Rate (System)/Capacity (Step)
Numerator = system output rate
Denominator = step’s max rate
Always works
Activity Time of Step/Activity Time of Bottleneck
Numerator = time at this step
Denominator = time at bottleneck
Restrictions apply
Only works when the system is capacity constrained and there is a single worker at each step (with parallel workers you must use Formula 1)
Step-by-step method for calculating utilization
Find the Flow Rate for the entire process: min(Demand, Capacity, Supply)
For each step, calculate: Utilization = Flow Rate/Step Capacity
The same Flow Rate goes through every activity (what goes in must come out)
Why can utilization never exceed 100%?
Bottleneck = step with the lowest capacity
System Capacity = Bottleneck Capacity
Flow Rate <= System Capacity
Therefore Flow Rate <= Bottleneck Capacity <= Any Step Capacity
So when you calculate Utilization = Flow Rate/Step Capacity
The numerator (Flow Rate) is always <= the denominator (Step Capacity)
Therefore, Utilization is always <= 100%
What happens to the bottleneck when the system is capacity constrained?
Bottleneck Utilization = 100%
Working nonstop and still can’t keep up
Limits the system
Improving the bottleneck increases capacity
No slack for variability
What happens to the bottleneck when the system is demand constrained?
Bottleneck Utilization < 100%
Not at limit BUT still the highest
What is true of steps that are not the bottleneck (don’t have the highest utilization)?
These steps have excess capacity
Improving these steps won’t help throughput
These steps have slack to absorb variability
What is the Cost of Direct Labor (CODL)?
The labor cost incurred to produce one flow unit
Why do managers obsess over CODL?
Pricing: CODL sets the floor for profitable pricing
Efficiency: Lower CODL = more efficient process
Comparison: Compare different process designs objectively
Decisions: Should we add workers? Combine tasks? Automate?
Every process change affects CODL (True/False)
True
Cost of Direct Labor (CODL) Formula
CODL = Total Wages per Hour/Flow Rate per Hour
Units: dollars per unit
Step-by-step method for calculating CODL
Count all workers in the process (every station)
Calculate Total Wages/hr = Sum(each worker’s hourly rate)
Find Flow Rate = min(Demand, Capacity, Supply)
Divide: CODL = Total Wages/Flow Rate
Include ALL workers who touch the process → even if they’re not busy 100% of the time
A higher flow rate leads to a [BL|ANK] CODL
Higher
Lower
Lower
You spread the fixed labor cost over more units
CODL goes DOWN when you (3 reasons)
Increase flow rate
Reduce wages
Improve bottleneck
CODL goes UP when you (3 reasons)
Add workers w/o more output
Demand drops
Overstaffing
Adding workers when demand constrained [BLANK 1] CODL because flow rate doesn’t change, you pay [BLANK 2] for the same output
Increases/Decreases
More/Less
Cost of Direct Labor (CODL) Daily Perspective Formula
CODL = Total Daily Labor Cost/Total daily Output
How does capacity change when you have multiple workers doing the same task?
It depends on the configuration
How does capacity change when you have multiple workers doing the same task?
“OR” configuration
Each flow unit goes to ONE worker
Workers work in parallel
Capacity = Sum of capacities
How does capacity change when you have multiple workers doing the same task?
“AND” configuration
Each flow unit needs ALL workers
Workers work together
Capacity = Min of capacities
“OR” Configuration Formula
Capacity = m/Activity Time
m = number of parallel workers
Adding parallel workers multiplies capacity
When you improve the bottleneck, the bottleneck often shifts to another activity (True/False)
True
You’ve fixed one constraint, but now another becomes the limiter
If the system is Demand Constrained
Adding workers increases cost without increasing output
Focus on reducing costs or finding more customers
Don’t expand capacity
If the system is Capacity Constrained
Adding workers at bottleneck increases output
Focus on expanding capacity at the bottleneck
Watch for shifting bottlenecks
Flow Time
The total time a flow unit spends in the process from entry to exit
Flow time includes:
Time being processed (activity time)
Time waiting between activites
Two Versions of Flow Time
Theoretical flow time (empty system): Just activity times, no waiting
Actual flow time (real system): Activity times PLUS waiting times
Theoretical Flow Time is also known as
Rush Order Flow Time
ROFT = Theoretical Flow Time = Sum of Activity Times
Theoretical Flow Time
Minimum Flow Time
Processing Time
Theoretical Flow Time
Time for ONE flow unit through entire process when system is empty
Step-by-step ROFT calculation
List all activities in sequence
Sum all activity times
ROFT [BLANK] change when you add parallel resources
Does
Does Not
Adding a second worker at Activity B doesn’t make B faster for any single unit (it just means B can handle more units per hour)
What is the key distinction between Cycle Time vs Flow Time
Cycle Time is the time between successive outputs while Flow Time is the time one units spends in the system
Cycle Time tells you the rhythm of the output while Flow Time tells you the customer experience
Throughput Time
The total time needed to complete all N flow units that arrive during a period
Once the process reaches a steady state, units exit at the
Flow Rate
Throughput Time Formula
Throughput Time (Time to Process N Units) = N/Flow Rate
Step-by-step Overtime Calculation Method
Count total units: How many flow units arrive during the shift?
N = Arrival Rate x Operating Hours
Calculate time needed: How long to process all N units?
Time Needed = N/Flow Rate
Calculate overtime: Compare to available hours
Overtime = max(0, Time Needed - Operating Hours)
If Time Needed <= Operating Hours, then Overtime =
0
When you change a process, what signals a Good/Bad Change:
Flow Rate
CODL (cost per unit)
Overtime
Utilizations
Meets demand?
Flow Rate
Good: Increased
Bad: Decreased or unchanged
CODL (cost per unit)
Good: Decreased
Bad: Increased
Overtime
Good: Decreased
Bad: Increased
Utilizations
Good: More balanced
Bad: More unbalanced
Meets Demand
Good: Yes
Bad: No
A good process improvement should (3 points)
Increase throughput
Reduce cost per unit
BOTH
Before recommending a change
Calculate Base Case (current state)
Bottleneck, capacity, flow rate
Utilizations at each step
CODL, overtime, total daily cost
Proposed Change
New bottleneck (did it shift?)
New capacity, flow rate
New utilizations, CODL, overtime
Compare
Did flow rate increase?
Did CODL decrease?
Did overtime decrease?
Does the system now meet demand?
The 7 Step Process Analysis Method
Define the flow unit: What moves through the process?
Measure activity times: How long does each step take?
Calculate capacity: Capacity = m/Activity Time
Find the bottleneck: The step with the lowest capcity
Determine flow rate: Flow Rate = min(Demand, Capacity, Supply)
Calculate utilization: Utilization = Flow Rate/Capacity
Calculate CODL = Total Wages/Flow Rate