Biostats Example Questions Part 2
1/24
Earn XP
Description and Tags
Test 2 Lectures 8-
Name | Mastery | Learn | Test | Matching | Spaced | Call with Kai |
|---|
No analytics yet
Send a link to your students to track their progress
25 Terms
Which hypothesis depicts the research hypothesis, or the statement that we hope to demonstrate is true?
A. Null hypothesis
B. Alternative hypothesis
B. Alternative hypothesis
Lecture 8 Slide 8
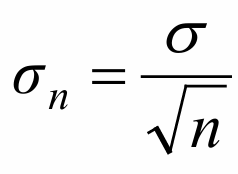
Uncertainty decreases by a factor of _ by making four times as many measurements and by a factor of _ by making 100 times as many measurements
2
10
Lecture 8 Slide 18
when do you use z-distribution vs t-distribution
If we know the 𝜎, standard deviation of the population, we use the normal distribution, or z-statistics
If we don’t know 𝜎𝜎, then we use the t-distribution
The t-distribution is used when n is small and 𝜎 is unknown
Lecture 8 Slide 19
A technician determines the concentration of calcium in milk using two instrumental methods. If Fcalculated > Ftable for the two sets of calcium data, what conclusion(s) can the technician make?
The difference in standard deviations for the two instrumental methods is significant.
The difference in standard deviations for the two instrumental methods is not significant.
The data comes from populations with the same standard deviation.
The data does not come from populations with the same standard deviation
The difference in standard deviations for the two instrumental methods is significant.
The data does not come from populations with the same standard deviation
Lecture 8 Slide 26
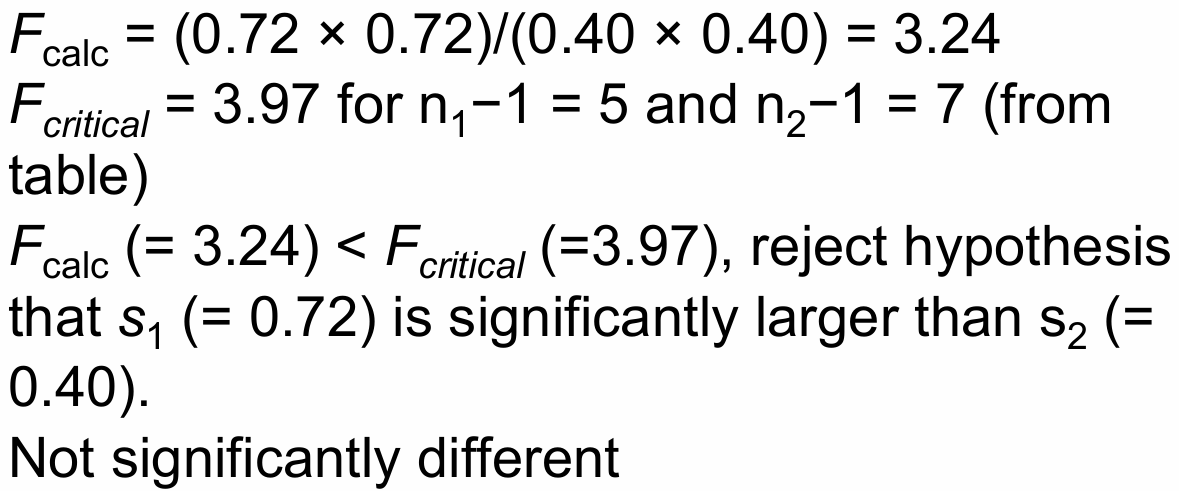
A technician determines the concentration of calcium in milk using two instrumental methods. For method A, ̅x = 95.03 ppm, s = 0.40 (n = 8) and for method B, ̅x = 94.96 ppm, s = 0.72 (n = 6). Is the difference in standard deviation significant at the 95% confidence level?
Not significantly different
Lecture 8 Slides 27-28
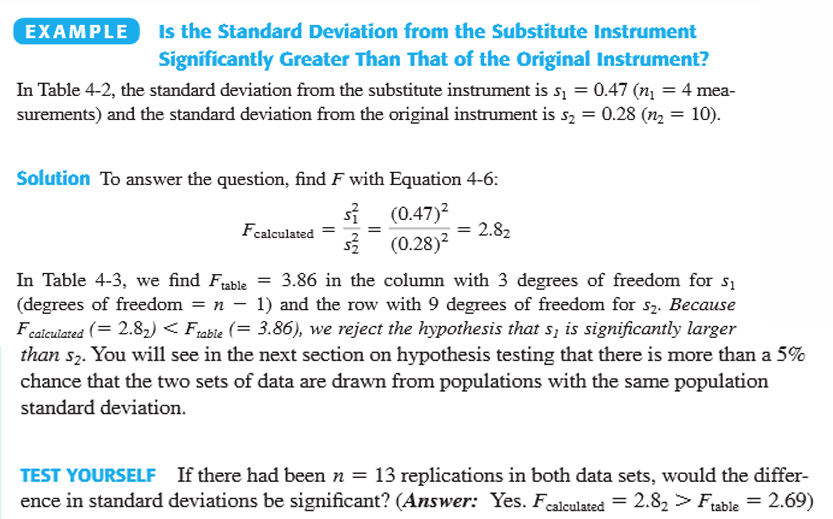
Is the standard deviation from the substitute instrument significantly greater than that of the original instrument?
Not significantly different
Lecture 8 Slides 29-30
For the statements below, which is/are TRUE for confidence intervals?
As the percentage confidence increases, the confidence interval range decreases.
Confidence intervals are calculated using the calculated mean and standard deviation of a set of n measurements; and the results of the F test.
The 95% confidence interval will include the true population mean for 95% of the sets of n measurements.
The 95% confidence interval will include the true population mean for 95% of the sets of n measurements.
Lecture 8 Slides 36
Determine the critical t value:
95% Confidence, n = 15
Two-tailed
df =n–1=14
α(Two-tailed): 1 – 0.95 = 0.05.
Use the two-tailed 0.05 column
Result: The critical value is 2.145
Lecture 8 Slide 45
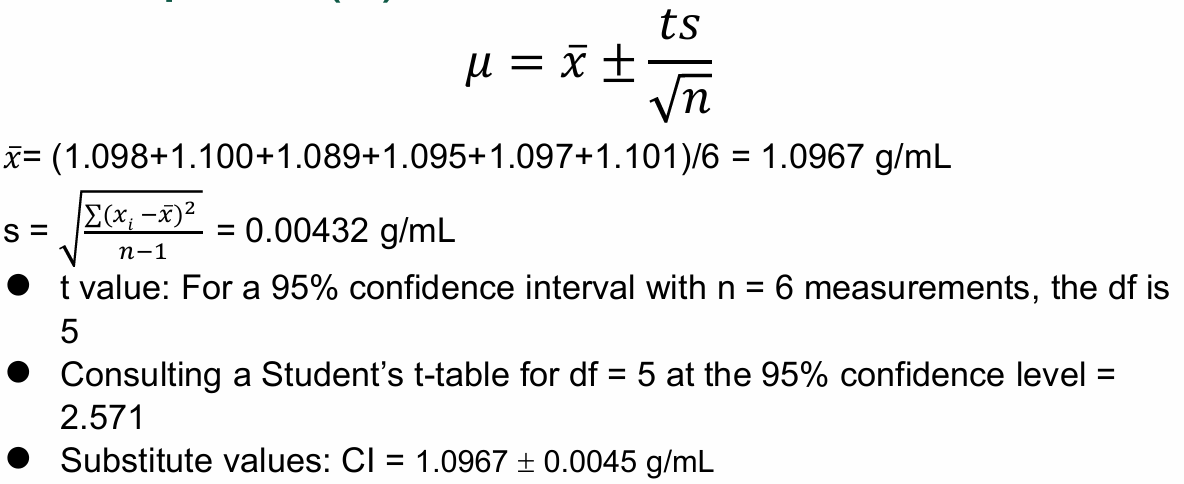
The density of a solution is measured six times with the results of 1.098, 1.100, 1.089, 1.095, 1.097 and 1.101 g/mL. Calculate the 95% confidence interval for the density.
1.0967 ± 0.0043 g/mL
1.0967 ± 0.0038 g/mL
1.0967 ± 0.0041 g/mL
1.0967 ± 0.0045 g/mL
1.0967 ± 0.0039 g/mL
CI = 1.0967 ± 0.0045 g/mL
Lecture 8 Slides 46-47
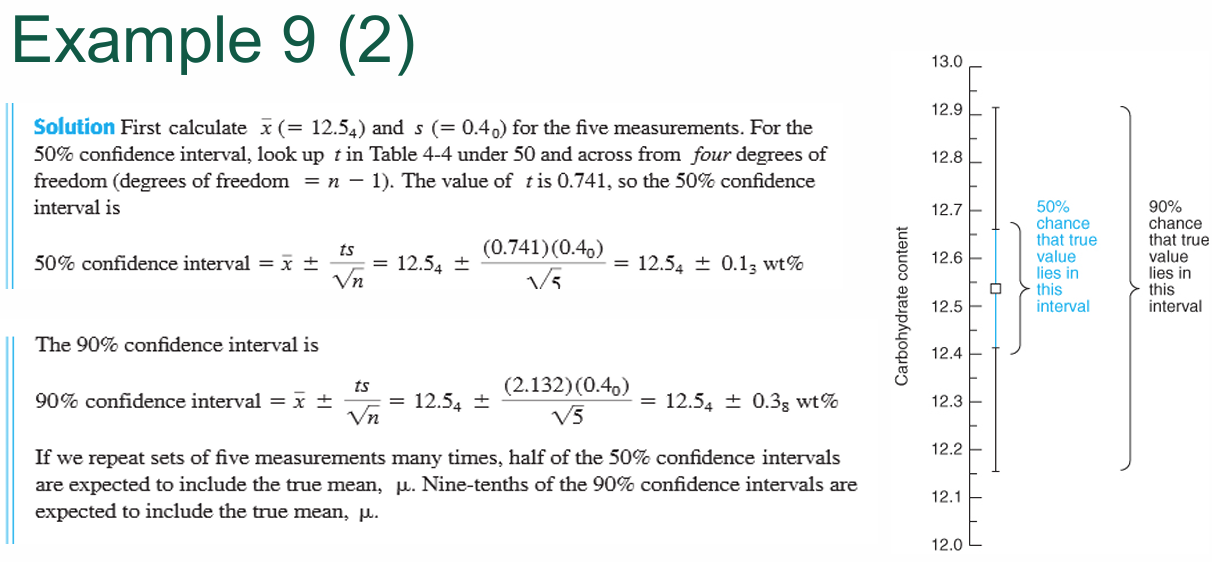
The carbohydrate contents of a glycoprotein is found to be 12.6, 11.9, 13.0, 12.7, and 12.5 wt% (g carbohydrate/100g glycoprotein) in replicate analyses. Find the 50% and 90% confidence intervals for the carbohydrate content
Lecture 8 Slides 48-49
Hypothesis testing: Steps
State the problem
Establish the null and alternative hypotheses
Test statistics
Establish p-value
Use p-value to establish the significance level
*p<0.05 (>95% chance that parameters differ)
**p<0.01 (>99% chance that parameters differ)
○ *** p<0.001 (>99.9% chance that parameters differ)
○ **** p<0.0001 (>99.99% chance that parameters differ)
First, we will need to know what significance levels and p-values are
Lecture 8 Slides 50
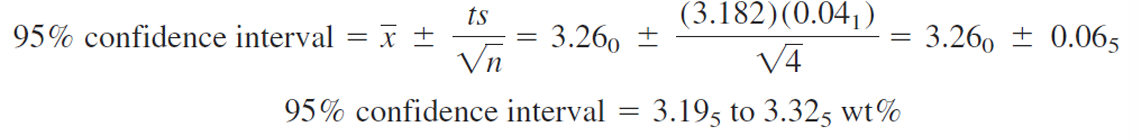
You purchase a Standard Reference Material coal sample certified by the National Institute of Standards and Technology to contain 3.19 wt% sulfur. You are testing a new analytical method to see whether it can reproduce the known value. The measured values are 3.29, 3.22, 3.30, and 3.23 wt% sulfur.
What is the mean and standard deviation?
Does your answer agree with the known value?
The known answer is just outside the 95% confidence interval. Therefore, we conclude that there is less than a 5% chance that our method agrees with the known answer.
Lecture 8 Slides 56-57
Lecture 8 Slides 23-24
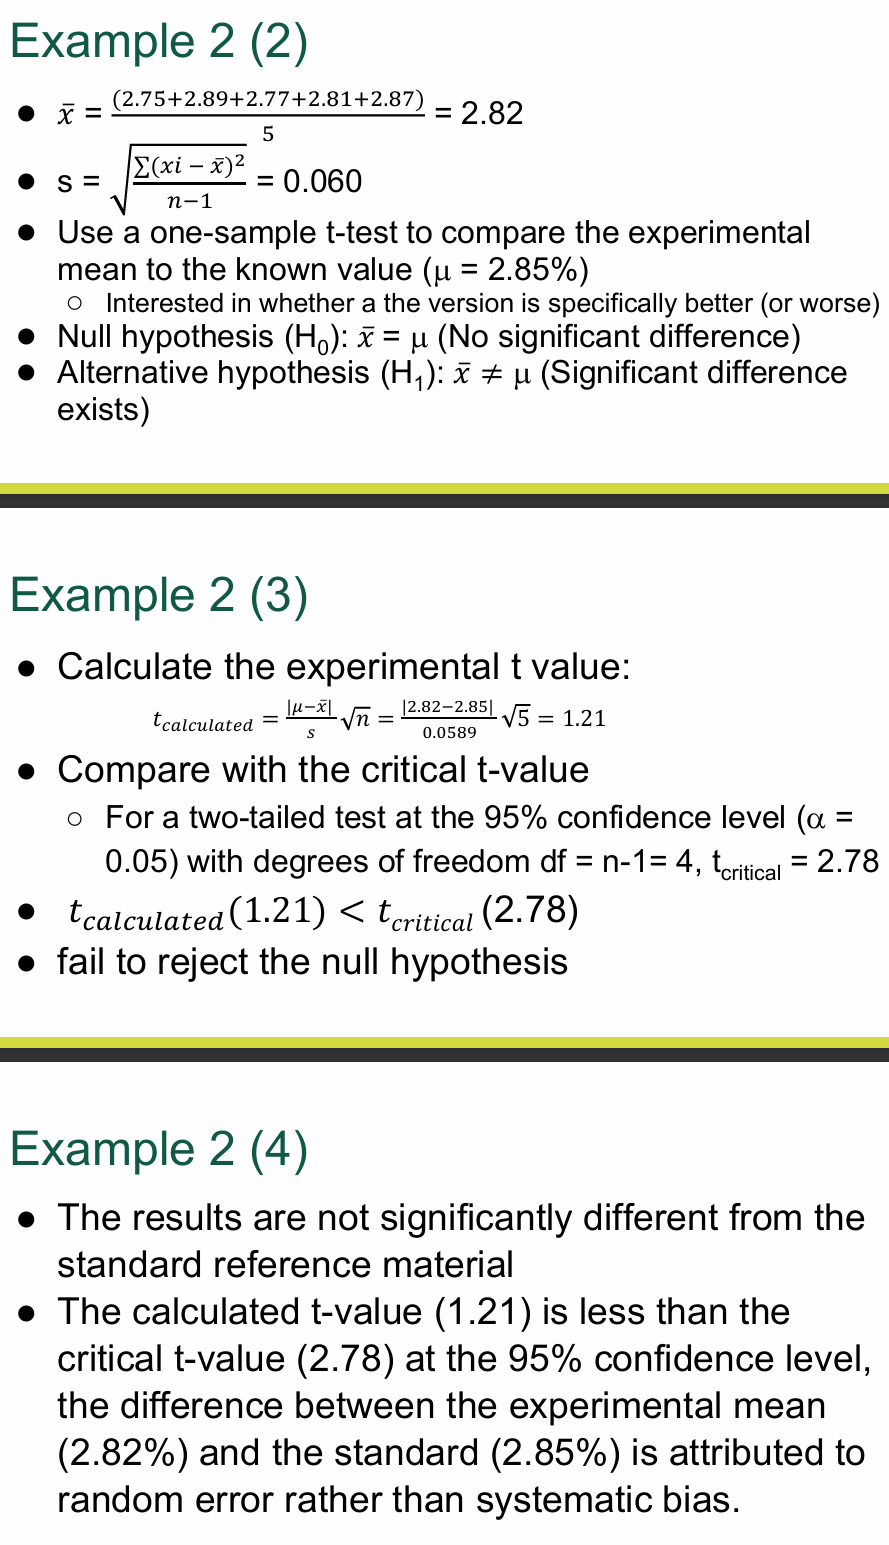
A researcher has developed a new analytical method to determine the percent by mass of iron in solids. To test the new method, the researcher purchases a standard reference material sample that is 2.85% iron by mass. Analysis of the iron standard returns values of 2.75%, 2.89%, 2.77%, 2.81%, and 2.87%. Are the results of the new method significantly different from the standard reference sample?
Lecture 8 Slides 58-59
Lecture 9 Slides 25-28
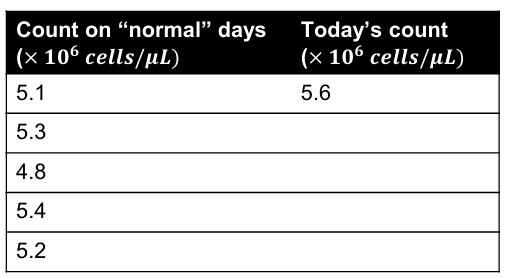
Is the red blood cell count high today?
Lecture 8 Slides 60-61
Lecture 9 Slides 29-31
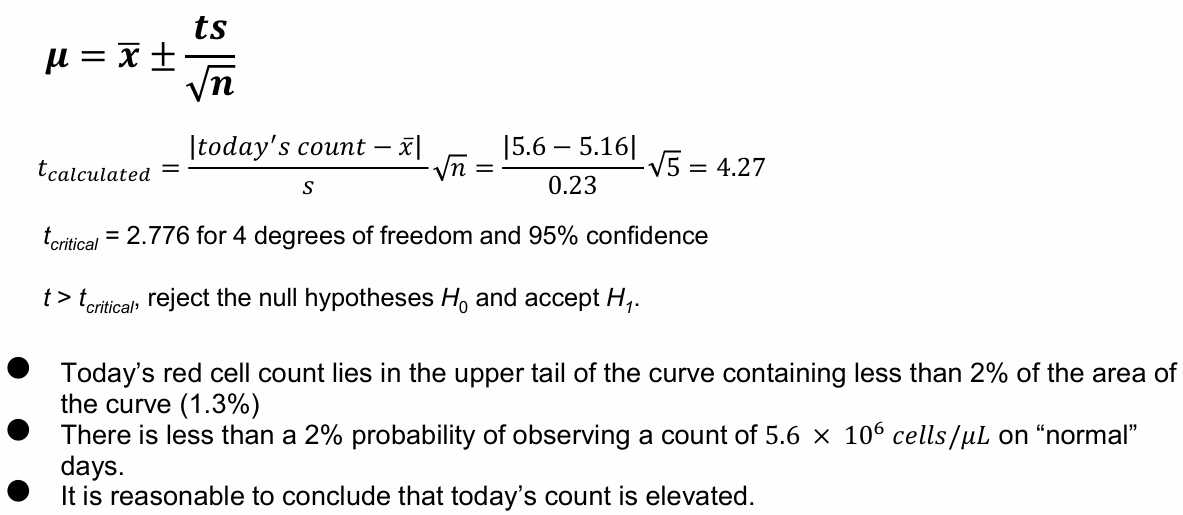
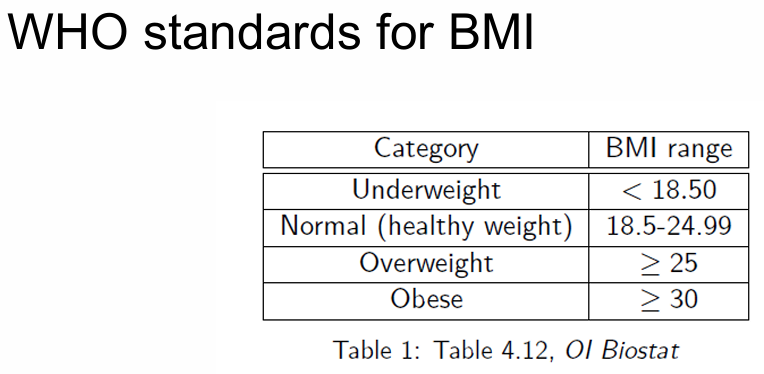
Do Americans tend to be overweight?
Body mass index (BMI) is an approximate scale used to assess weight status that adjusts for height.
When weight is measured in kg and height in meters:
BMI = weight/(height2)
When weight is measured in lbs and height in inches:
BMI = (weight/(height2))(703
This is a 19 slide question that makes with no obvious questions (lecture number 9)
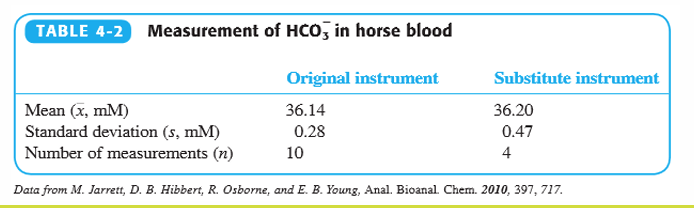
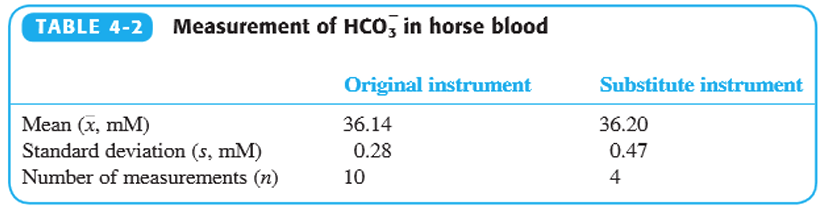
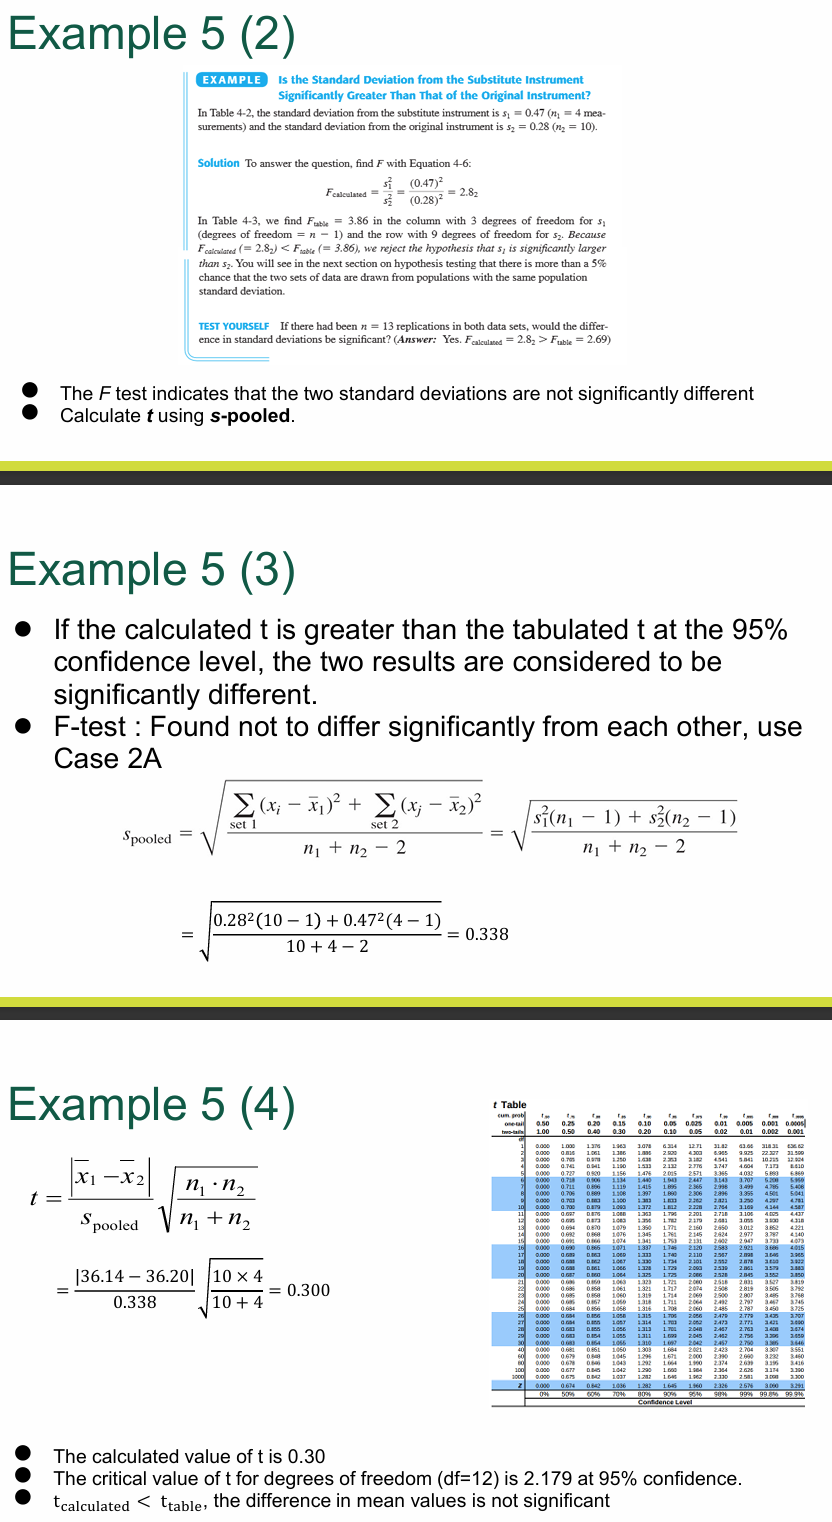
Are 36.14 and 36.20 mM significantly different from each other? Do a t-test to find out.
The F test indicates that the two standard deviations are not significantly different
Calculate t using s-pooled.
If the calculated t is greater than the tabulated t at the 95% confidence level, the two results are considered to be significantly different.
The calculated value of t is 0.30
The critical value of t for degrees of freedom (df=12) is 2.179 at 95% confidence.
tcalculated<ttable, the difference in mean values is not significant
Lecture 9 Slides 57-60
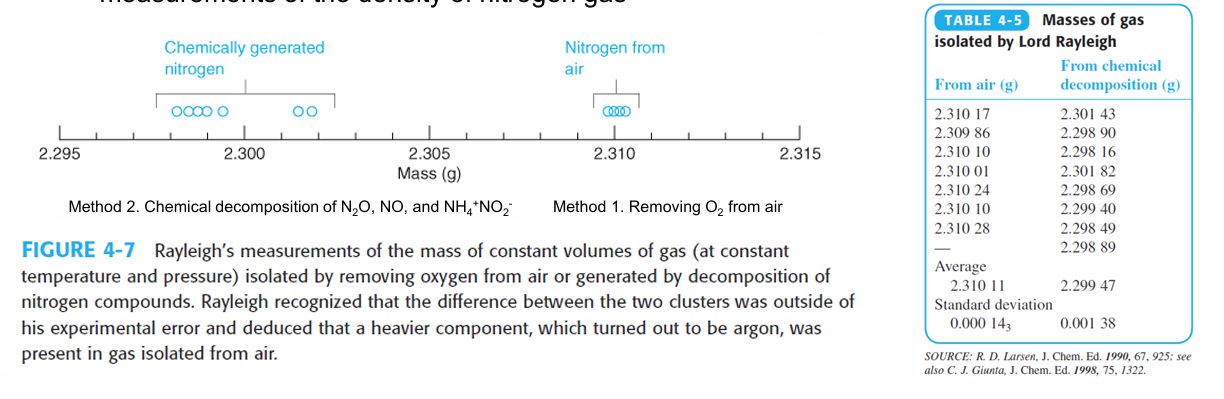
Example comes from the work of Lord Rayleigh (John W. Strutt)
His Noble Prize in 1904 was received for discovering the inert gas argon
This discovery occurred when he noticed a small discrepancy between two sets of measurements of the density of nitrogen gas
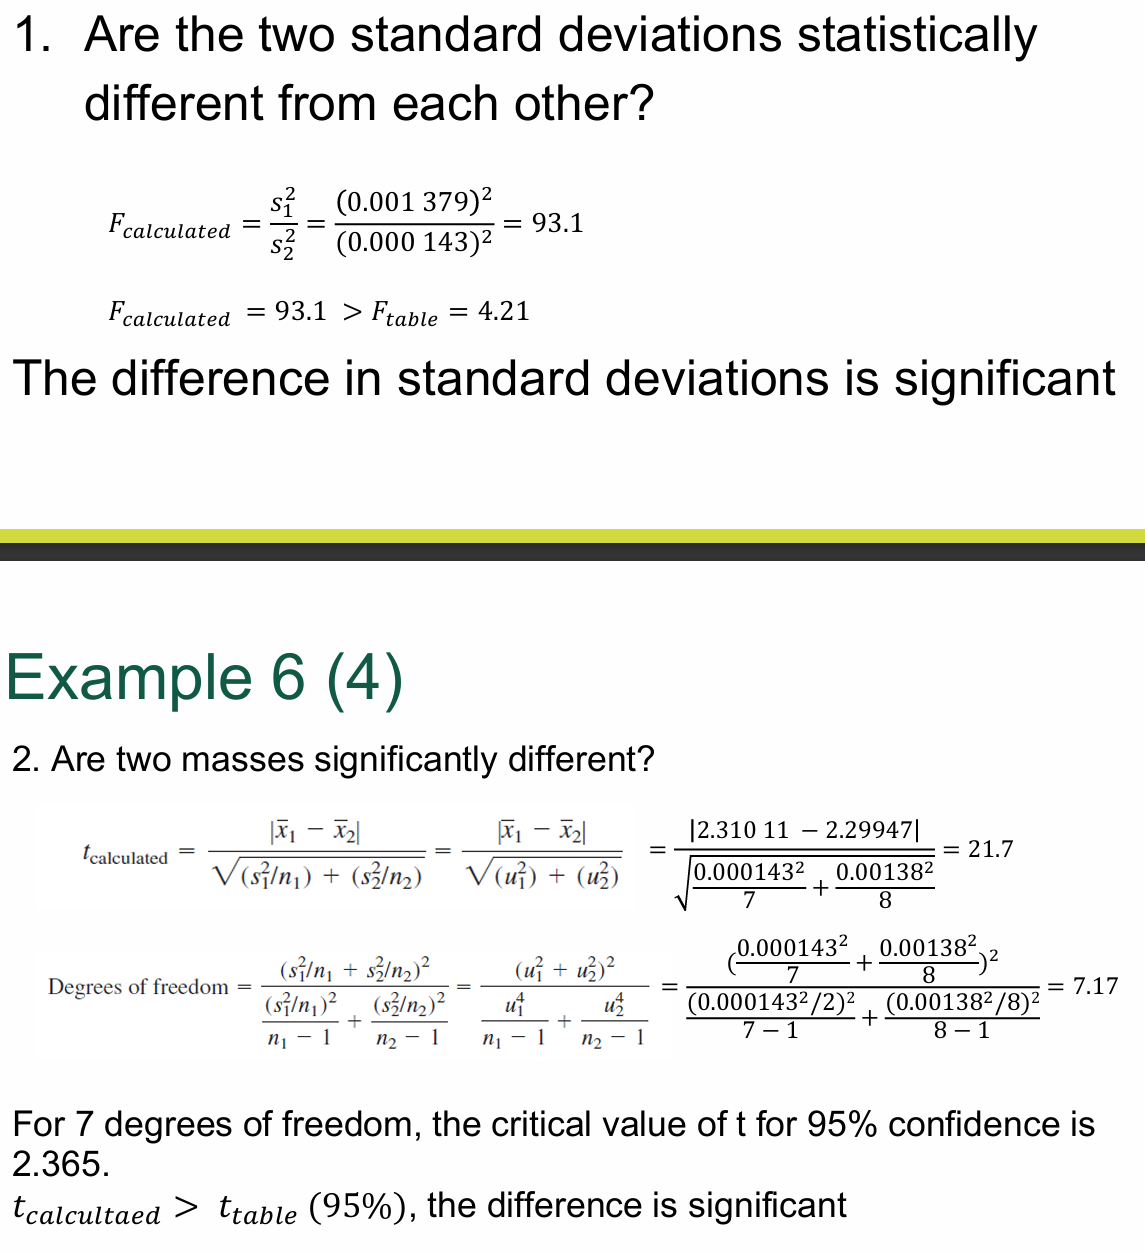
Are the two standard deviations statistically different from each other?
Are two masses significantly different?
The difference in standard deviations is significant: Fcalculated = 93.1 > Ftable=4.21
tcalculated>ttable(95%), the difference is significant
Lecture 9 Slides 61-68
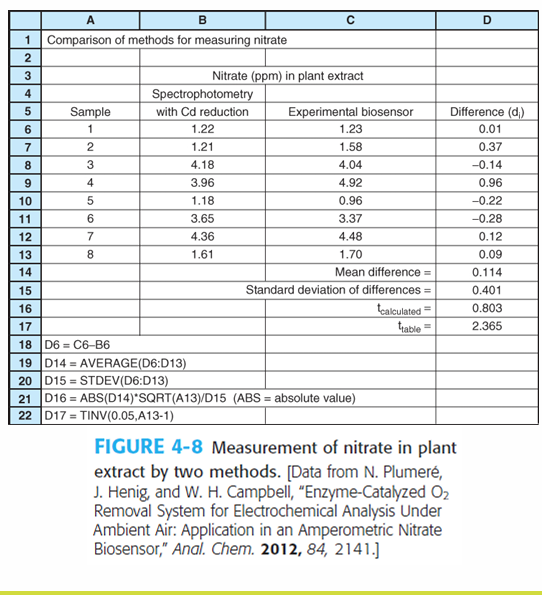
Nitrate concentrations in eight different plant extracts were measured using two different methods (shown in columns A and B)
Is there a significant difference between the methods?
Hint:
di = difference between the two results for each sample (Column D)
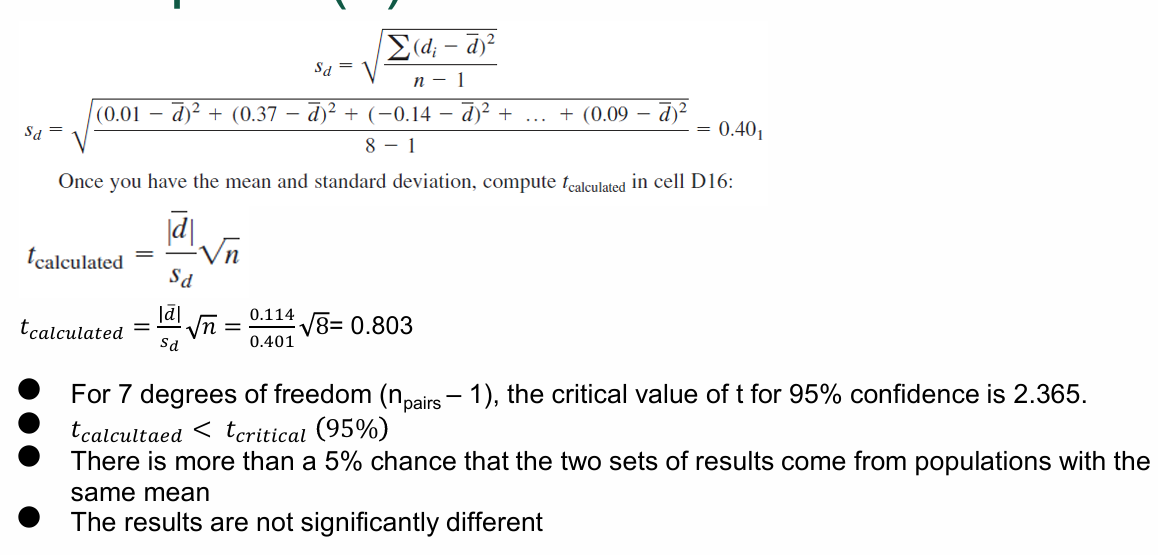
dbari the mean of the 8 differences = 0.114
sd =the standard deviation of the 8 differences = 0.401
There is more than a 5% chance that the two sets of results come from populations with the same mean
The results are not significantly different
Lecture 9 Slides 71-74
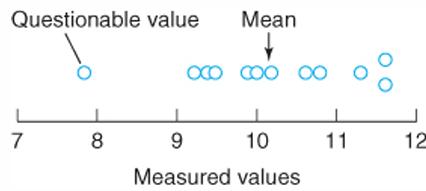
Students dissolved zinc from a galvanized nail and measured the mass lost by the nail to determine how much of the nail was zinc. The mass loss from 12 galvanized nails was measured.
Mass loss (%): 10.2, 10.8, 11.6, 9.9, 9.4, 7.8, 10.0, 9.2, 11.3, 9.5, 10.6, 11.6;
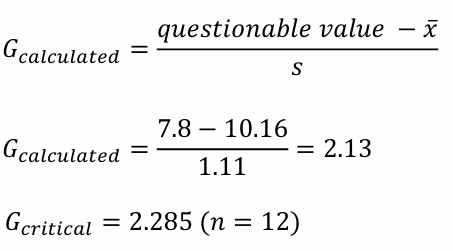
( ̅x = 10.16, 𝑠 = 1.11)
Average and standard deviations are calculated including the questionable value
Should the value 7.8 be discarded or retained?
Gcalculated < Gcritical the questionable point should be retained
There is more than 5% chance that the value 7.8 is a member of the same population as the other measurements.
Lecture 9 Slides 76-77
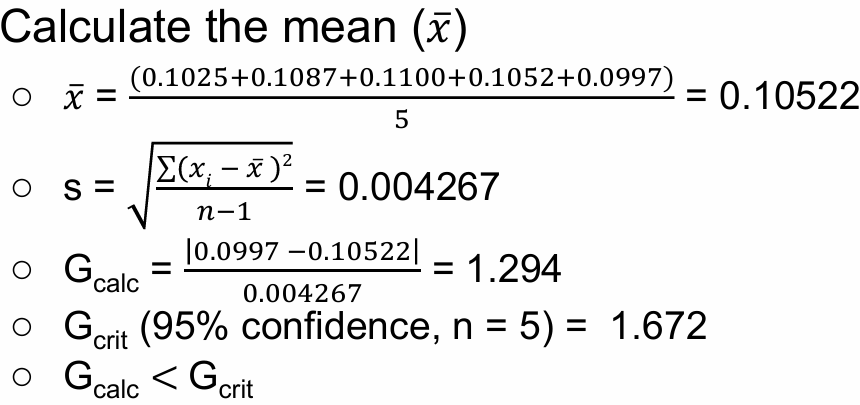
The molarity of a sodium hydroxide solution was determined by titration against KHP to be 0.1025 M, 0.1087 M, 0.1100 M, 0.1052 M, and 0.0997 M for pooled class data. The TA suspects that 0.0997 M is an outlier. Can the TA throw out the data point?
The data point cannot be thrown out
Lecture 9 Slides 79-80