Lectures 4 & 5 - Biopotentials & ECGs
0.0(0)
Studied by 2 peopleCard Sorting
1/59
Earn XP
Description and Tags
Last updated 10:13 PM on 5/18/23
Name | Mastery | Learn | Test | Matching | Spaced | Call with Kai |
|---|
No analytics yet
Send a link to your students to track their progress
60 Terms
1
New cards
What does the Hodgkin & Huxley model show?
Shows electrical characteristics of excitable cells
2
New cards
What is the source of biopotentials?
- Electrical signals that originate within biological tissue as a result of electrochemical activity of excitable cells
- This excitation causes a change in electric field properties propagating through the body
- Action potentials can be measured and are the source of biopotentials
- This excitation causes a change in electric field properties propagating through the body
- Action potentials can be measured and are the source of biopotentials
3
New cards
Define biopotential
- Electric potential that is measured between points in living cells, tissue and organisms which accompanies all biochemical processes
- Transfer of information between and within cells
- Transfer of information between and within cells
4
New cards
Name three examples of biopotentials
- ECG
- EEG
- EMG
- EEG
- EMG
5
New cards
What does an ECG show?
- Recording of the electrical activity of the heart and is an important diagnostic tool in cardiology
- Signal originates from action potentials of cardiac muscle cells
- Relates mechanical and electrical activities of the heart
- Signal originates from action potentials of cardiac muscle cells
- Relates mechanical and electrical activities of the heart
6
New cards
What does an EEG show?
Recording of neuronal electrical activity in the brain
7
New cards
What does an EMG show?
Recording of the electrical potential generated by the contractions of skeletal muscle cells
8
New cards
Name three characteristics of biopotentials?
1. Almost all biopotentials are in the low frequency range
9
New cards
Name the four chambers of the heart
1. Right atrium
2. Right ventricle
3. Left atrium
4. Left ventricle
2. Right ventricle
3. Left atrium
4. Left ventricle
10
New cards
What is the difference between diastole and systole?
Diastole - the resting phase where the heart muscle relaxes and the chambers fill with blood
Systole - The pumping phase where the heart muscle contracts and pushes blood out into the blood vessels
Systole - The pumping phase where the heart muscle contracts and pushes blood out into the blood vessels
11
New cards
What are the five main components in the conduction system?
1. Sinoatrial SA node
2. Atrioventricular AV node
3. Bundle of His
4. Bundle branches
5. Purkinje fibres
2. Atrioventricular AV node
3. Bundle of His
4. Bundle branches
5. Purkinje fibres
12
New cards
Describe the three phases of heart conduction
Phase 1. Spontaneous depolarisation of SA node
Spread of depolarisation signal to atria then to AV node
Phase 2. SA repolarisation
Depolarisation of Bundle of His and then Purkinje fibres = ventricles contract and atria relax
Phase 3. Repolarisation of AV node, bundle of His and Purkinje fibres
Ventricles relax
Spread of depolarisation signal to atria then to AV node
Phase 2. SA repolarisation
Depolarisation of Bundle of His and then Purkinje fibres = ventricles contract and atria relax
Phase 3. Repolarisation of AV node, bundle of His and Purkinje fibres
Ventricles relax
13
New cards
On an ECG grid, what does each square represent?
x - axis
Small square - 1mm in length = 0.04 seconds
Larger square - 5mm in length = 0.2 seconds
y axis
Small square - 1 mm in length = 0.1mV
Larger square - 5mm in length = 0.5mV
Small square - 1mm in length = 0.04 seconds
Larger square - 5mm in length = 0.2 seconds
y axis
Small square - 1 mm in length = 0.1mV
Larger square - 5mm in length = 0.5mV
14
New cards
Describe how ECG recordings are picked up
- Physiological potentials that arise from ionic movement create a measurable potential difference (voltages) on the skin surface.
- These voltages can be measured with a transducer.
- These voltages can be measured with a transducer.
15
New cards
What does a transducer do?
Converts ionic potentials to electrical potentials
16
New cards
What does an electrode do?
Measures potential difference between two points on the body
17
New cards
What are the two main types of electrodes?
Describe how they behave
Describe how they behave
- Polarisable
Behave as capacitors
- Non-polarisable
Behave as resistors
Behave as capacitors
- Non-polarisable
Behave as resistors
18
New cards
In electrocardiology, what does a vector represent?
Both the magnitude and direction of the action potential generated by an individual cardiac muscle
Sum of all the individual vectors generated by depolarisation waves make up the electrical axis
Sum of all the individual vectors generated by depolarisation waves make up the electrical axis
19
New cards
When the depolarisation wave travels towards a recording lead, which way do the results deflect?
Positive/Upward
20
New cards
When the depolarisation wave travels away a recording lead, which way do the results deflect?
Negative/Downwards
21
New cards
How is the overall magnitude of the heart's electrical potential measured?
From leads at different angles and is recorded over a period of time
22
New cards
Name three considerations during ECG measurement
1. Lead positioning
2. Skin-electrode contact
3. Shielding from interference
2. Skin-electrode contact
3. Shielding from interference
23
New cards
Horizontal axis
Rhythm
Vertical axis
Base line
Calibration
Several lines
Pattern
Patients condition
Rhythm
Vertical axis
Base line
Calibration
Several lines
Pattern
Patients condition
Time
Frequency of the beat
Voltage
No peaks
Rectangles at the edges
12 lead ECG
Small or larger peaks
Normal or abnormal
Frequency of the beat
Voltage
No peaks
Rectangles at the edges
12 lead ECG
Small or larger peaks
Normal or abnormal
24
New cards
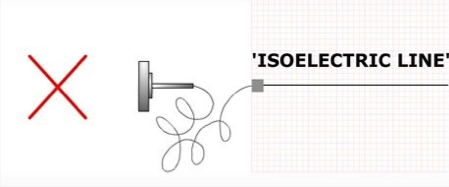
No electrical activity
25
New cards
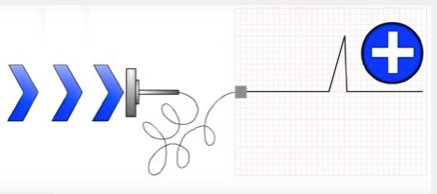
Depolarisation travelling towards sensor
26
New cards
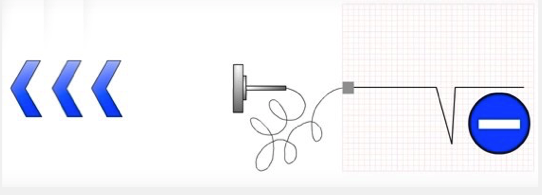
Depolarisation travelling away from the sensor
27
New cards
Repolarisation travelling towards the sensor
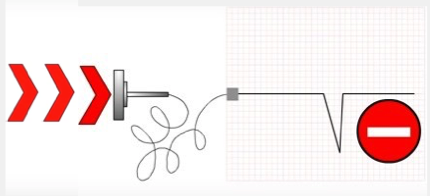
28
New cards
Repolarisation travelling away from the sensor
29
New cards
Einthoven's triangle
30
New cards
31
New cards
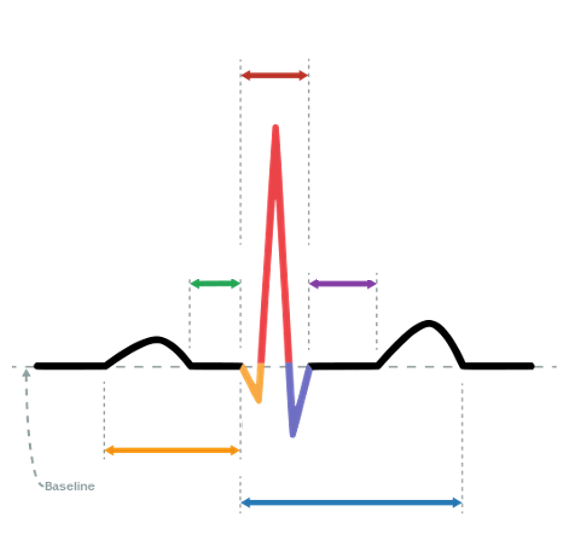
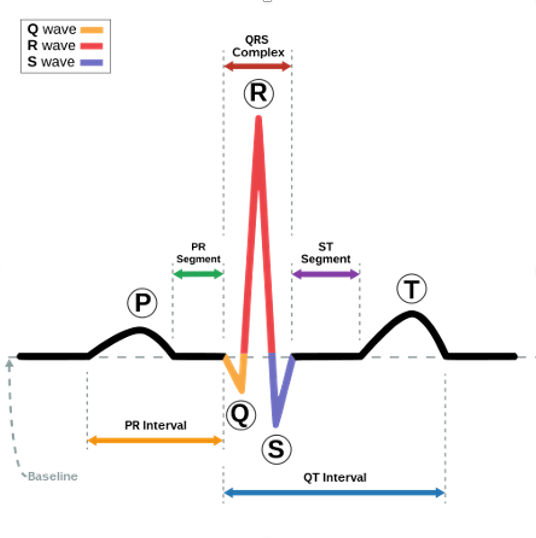
What does the P wave reflect?
Atrial depolarisation
32
New cards
What does the PR interval represent?
- Distance between the onset of the the P wave to the onset of the QRS complex
- Determines whether impulse conduction from the atria to the ventricles in normal
- Determines whether impulse conduction from the atria to the ventricles in normal
33
New cards
What does the PR segment reflect?
- Slow impulse conduction through the AV node
- Serves as a baseline
- Serves as a baseline
34
New cards
What does the QRS complex represent?
Depolarisation of the ventricle
35
New cards
Define the QRS duration
Time interval from the onset to the end of the QRS complex
36
New cards
What does the T wave represent?
Rapid repolairsation
37
New cards
What does the QT interval represent?
Ventricular activation and recovery
38
New cards
Define left ventricular hypertrophy
Enlargement and thickening of the walls of your heart's main pumping chamber
39
New cards
Why can left ventricular hypertrophy develop?
In response to a factor such as high BP or a heart condition that causes the left ventricle to work harder
40
New cards
State the stages of ECG signal processing and analysis
1. Signal amplification
2. Analogue to Digital conversion
3. Noise reduction
4. Data compression
5. Feature selection
6. Signal classification
7. Interpretation
2. Analogue to Digital conversion
3. Noise reduction
4. Data compression
5. Feature selection
6. Signal classification
7. Interpretation
41
New cards
How is ECG amplification achieved?
Instrumentation amplifier
42
New cards
What are the requirements for the instrumentation amplifier?
- High amplification
- High input impedance
- Ability to reject electrical interference
- High input impedance
- Ability to reject electrical interference
43
New cards
What is used for ADC?
State the specs
State the specs
ΣΔ ADCs of high resolution and a low noise level
44
New cards
What are the stages of ADC?
1. Sampling
2. Quantising
3. Coding
2. Quantising
3. Coding
45
New cards
What is meant by sampling in ADC?
- Analogue signal is sampled whilst the intermediate values of the signal are discarded
- Number of values within a time period constitutes the sampling rate
- Number of values within a time period constitutes the sampling rate
46
New cards
Define the Nyquist thereom
- When samples are taken below a certain rate, the samples may not adequately capture the characteristics of the signal.
- The “characteristics” are related with the frequencies of the signal and the rate should be double of the maximum frequency
- The “characteristics” are related with the frequencies of the signal and the rate should be double of the maximum frequency
47
New cards
State the Shannon-Nyquist Thereom
- In order to reconstitute a digitised sine wave signal it is necessary to take at least 2 samples per cycle of the signal
- This means that the minimum sampling frequency must be greater than twice the highest frequency component in the signal
- This means that the minimum sampling frequency must be greater than twice the highest frequency component in the signal
48
New cards
What is the formula for praction sample frequencies, fs?
5 x fmax to 20 x fmax
49
New cards
What is meant by quantisation in ADC?
- The Voltage Amplitude of the analogue signal is quantised or sliced up into discrete digital levels
- Each voltage must be represented by one of these quantised levels after conversion
- The number of digital levels available depends on the number of bits of the converter
- A 3-bit converter would slice the voltage range into 8 discrete levels numbered 0 to 7
- Each voltage must be represented by one of these quantised levels after conversion
- The number of digital levels available depends on the number of bits of the converter
- A 3-bit converter would slice the voltage range into 8 discrete levels numbered 0 to 7
50
New cards
Define resolution in ADC
- Indicates the number of discrete digital values that an ADC can produce at its output
- Expressed as the number of bits of the converter
- Expressed as the number of bits of the converter
51
New cards
Define voltage resolution in ADC
Full input voltage range of the ADC divided by the number of discrete intervals on digitisation
52
New cards
Describe coding in ADC
Each level is allocated a binary digital number
53
New cards
Where does high frequency noise arise from?
- Overlap of ECG and EMG signal frequencies (20-80Hz)
- Power supply interference (50 or 60Hz)
- Neighbouring high-powered devices
- Power supply interference (50 or 60Hz)
- Neighbouring high-powered devices
54
New cards
Where does low frequency noise arise from?
- Results from patient movement
- Changes in body electrode contact
- Changes in body electrode contact
55
New cards
Define data transformation
Process of data compression, where information is reduced to a limited number of discriminatory features
56
New cards
Define feature extraction
Process where important features are extracted from the ECG signal
57
New cards
Define ECG signal classification
Process involves discrimination of PQRST complexes by means of analysing its shape
58
New cards
ECG atrial fibrillation detection
59
New cards
What are the four classifications for the analysis of the heart rhythm disturbances?
1. Irregular rhythms
2. Substitute rhythms
3. Premature stimulations
4. Tachyarrhythmias
2. Substitute rhythms
3. Premature stimulations
4. Tachyarrhythmias
60
New cards
What is the objective of ECG interpretation?
Understand the results of ECG testing and offer an interpretation in order to provide diagnosis and consider further testing