4.1.7.1 - The distribution of income and wealth
1/16
There's no tags or description
Looks like no tags are added yet.
Name | Mastery | Learn | Test | Matching | Spaced | Call with Kai |
|---|
No analytics yet
Send a link to your students to track their progress
17 Terms
Wealth =
Stock of assets that have value accumulated over time
e.g. property, shares, pensions, physical items
Income =
Flow of money/earnings into one's finances
e.g. wages, salaries, interest from capital
Distribution of Income =
How income is shared out between individuals, households and groups
Distribution of Wealth =
How wealth is shared out between individuals, houesholds and groups
Relationship between wealth and income
Positive correlation between wealth income
Virtuous circle - higher wealth results in higher incomes and vice versa
Because:
Wealth can be used to generate income (e.g. through investing, renting out property)
As incomes rise, marginal propensity to consume falls, so save proportionately more and more → further gains of wealth
UK Statistics for Household Income Distribution
Richest 10% make 28% of income
Median Household Income greatest in South-East England, lowest in Yorkshire and the Humber
Distribution of Income has remained mostly stable since 2000, with none of highest income groups seeing a significant change.
UK Statistics for Household Wealth Distribution
Richest 10% hold 50% of wealth - wealth much more unequally distributed than income
London has comparatively low median household wealth when it has one of the highest median incomes
Wealth increases with age, peaking at 65-74, then starts to fall
Factors influencing the Distribution of Income
Distribution of FoP within economy:
Land owners tend to receive higher incomes than workers offering Labour.
→ unequal distribution
Wealth:
Wealthier individuals can generate more ‘unearned’ income (money earned passively through investments, interest), which adds to their ‘earned’ income (money from active work).
This increases their income past those who don’t have any wealth to add additional income.
→ unequal distribution
Wage & Salary Differentials:
Forces of supply & demand in labour markets for different jobs →
Jobs that produce higher MRP and jobs with more inelastic supply (high-skilled jobs) result in higher wages than low-skilled jobs
→ different salaries → unequal distribution
Globalisation & Migration of workers:
Inward migration → ↑Supply of low-skilled workers → Downward pressure on wages for already low-income workers → Lowers wages of low-skilled/low-income workers
Factors influencing the Distribution of Wealth
Unequal Incomes:
Income inequality → Wealth inequality
Higher income individuals have lower MPC → save more of their income → Wealth accumulates faster than low income
low income individuals have high MPC → spend most of their income so low savings → wealth does not grow
Capital Gains:
When the value of an asset you own rises (house, shares)
Wealthier people have more assets, so have more ability to benefit from capital gains, while those without assets do not see any gains.
→ Already wealthy get wealthier → widening wealth inequality
Inheritance & gifts:
Personal wealth passed down through generations in the form of inheritance
→ wealth remains in family → wealth inequality maintained
Wealth taxation vs taxation of income:
More tax is generated by gov through taxes on income sources compared to wealth
Why is Wealth more Unequally Distributed than Income?
Cumulative Nature of Wealth - Higher income people have less MPC, so have more excess income to purchase further assets → further increase in wealth.
Asset Prices rise faster than Income
Wealth is less easy to distribute
Equality =
Concerned with sameness. Whether everyone gets exactly the same income/wealth
Equity =
Concerned with fairness.
requires value judgement
Equality vs Equity
Equality can be measured, equity requires a value judegement.
Equality about sameness, equity about fairness.
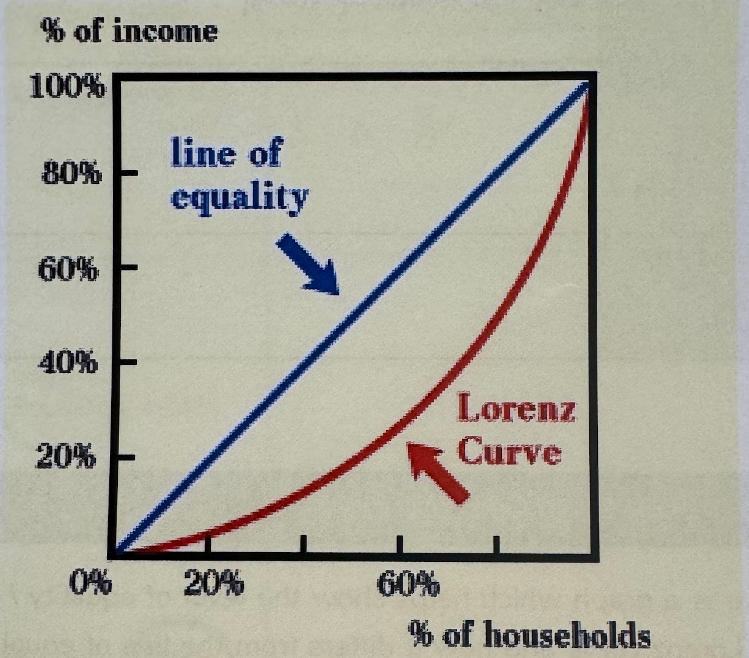
Lorenz Curve
Cumulative & of total income plotted against cumulative % of population (ranked in increasing size of share)
The extent to which the curve dips below a straight diagonal line indicates the degree of inequality of distribution
Gini Coefficient
Measures the extent to which the distribution of income/wealth deviates from a perfectly equal distribution.
Value of 0-1 where 0 is perfect equality, 1 is maximum inequality
Benefits of Greater Equality
Faster Economic Growth:
Lower income earners have higher MPC → ↑C → ↑AD → SREG
Greater Equality of Opportunity:
Increases social mobility (better access to education, qualifications, skills) → More higher-skilled workers (better quality labour) → boosts productivity → ↑LRAS
Decreases Poverty:
Decreases relative poverty → improves living standards
Costs of Greater Equality
Reduce Incentives:
More progressive taxation + higher benefits → less incentive to work → poverty trap → less available labour → lower EG
+ tax rev might fall (laffer curve)
Trickle-down Effect:
Rising inequality, but lowest earners are still better off
Entrepreneur sets up business → becomes millionaire, widening inequality → But he also created jobs and provided incomes for other workers → Lowest earners still better off with entrepreneur
Brain Drain / Capital Flight:
High progressive tax → rich & talented people leave overseas to countries with lower tax