Continuous Probability Distributions
1/13
Earn XP
Description and Tags
Discrete vs continuous probability distributions, application to normal distributions, use of range from a continuous probability distribution
Name | Mastery | Learn | Test | Matching | Spaced | Call with Kai |
|---|
No analytics yet
Send a link to your students to track their progress
14 Terms
What are the visual differences in plots between discrete and continuous probability distributions?
Discrete = jagged
Continuous = smooth
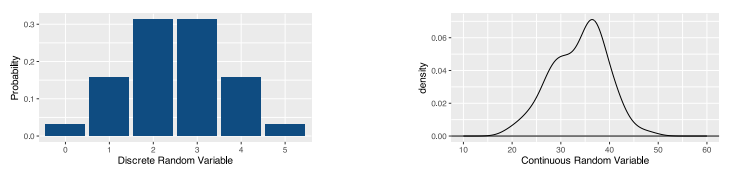
What are the 2 main ways in which CPDs differ from DPDs?
P(X = x) = 0
The probability of any single value is 0
CPDs are described using the probability density function (not probability mass function)
What is the most widely used continuous probability distribution?
Normal distribution AKA Gaussian distribution → is uni-modal (1 peak) + symmetrical
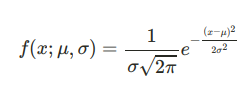
What is the probability density function equation for normal distributions?
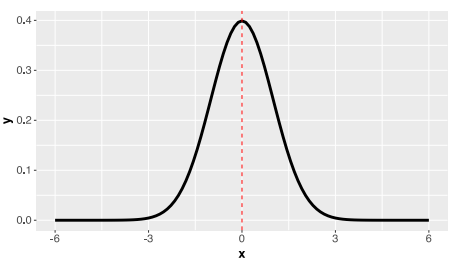
What are the key aspects of a standard normal distribution?
Mean = 0
SD = 1
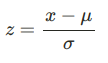
What are standard normal distributions also known as and why?
z-distributions
Presented in terms of z-scores
Standardise values of x
Numerator: converts x to deviations from the mean
Denominator: scales these deviation values based on the SD of the variable
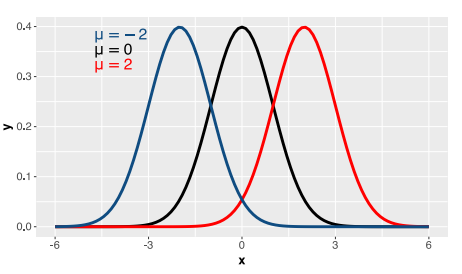
What happens when the mean changes in a standard normal distribution?
Adjusts where the curve is centred on the x-axis
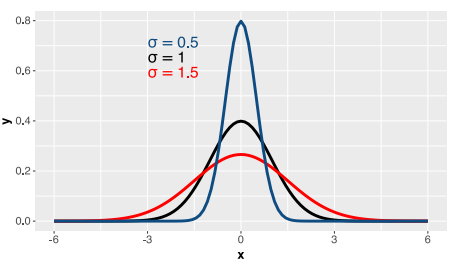
What happens when the SD changes in a standard normal distribution?
Adjusts the shape of the curve
What are the properties of any normal distribution?
Around 68% of area falls under 1 SD on either side of mean
Around 95% of area falls under 2 SD on either side of mean
Exactly 95% falls under +/- 1.96 SD
Around 99.75% of area falls under 3 SD on either side of mean
Integral equation
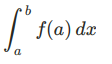
How can the integral value (when calculating the area under a curve) be calculated?
Using the PDF
What is the code for calculating the probability density function of the normal distribution?
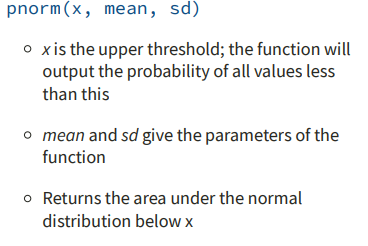
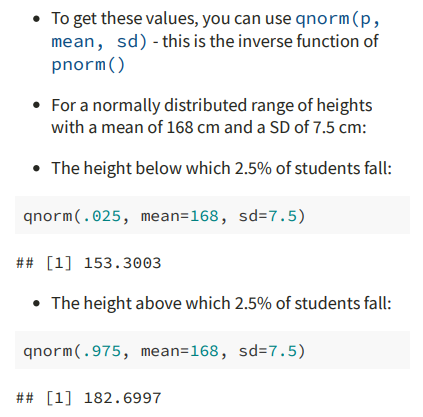
What is the code for calculating where x% of the most extreme values in a normal distribution fall?
How does the t-distribution compare to the normal (z) distribution?
When calculating t, we replace the population SD with the sample SD → tails are slightly higher to account for extra variability from using an estimate (vs actual population value(