PSYC2012
1/59
There's no tags or description
Looks like no tags are added yet.
Name | Mastery | Learn | Test | Matching | Spaced | Call with Kai |
|---|
No analytics yet
Send a link to your students to track their progress
60 Terms
What is empiricism
reliance on systematic evidence
What is a hypothesis?
generalised claim about the world, testable statement
What is a prediction?
precise, accounting for the details of content, expectation of the study, operation and result.
Theory
Set of ideas intended to explain facts or events, broad, existing findings, underlying mechanisms
Claim
assertion that something is true
What is a variable and it's role in psychology?
anything that varies, allowing for measurement, manipulation and relationships between behaviour, cognition and emotion.
What is a dependent variable?
outcome or response
What is a independent variable?
Potential cause for the dependent variable
What is a construct?
mental processes, behaviours or traits that cannot be directly observed
Operationalisation
procedures designed to represent a construct
What are the 4 scales of measurement and their definition?
1. Nominal - Categories only
Data are grouped into labels with no order.
Example: Eye colour, gender.
2. Ordinal - Ordered categories
Categories have a ranking, but the differences between them are not equal.
Example: Satisfaction ratings (poor, fair, good).
3. Interval - Equal intervals, no true zero
Differences between values are meaningful, but zero does not represent the absence of the quantity.
Example: Temperature in °C.
4. Ratio - Equal intervals with a true zero
Has all the properties of interval data, plus a meaningful zero point.
Example: Height, weight, age, reaction time.
What is reliability?
degree of stability of measurement outputs across time or context
Types of reliability
Internal Consistency - Consistency among items measuring the same construct.
Test-Retest Reliability - Stability of scores over time.
Inter-Rater Reliability - Agreement between different raters or judges.
What is validity?
the degree to which a claim is correct?
Psychometric validity definition
attributes exist, variations in the attribute casually produce variation in the measurement outcomes
What are the types of vakidity and there definitions
1. Convergent Validity - The degree to which a measure correlates highly with other measures of the same or related constructs.
2. Divergent (Discriminant) - Validity The degree to which a measure has low correlations with measures of unrelated constructs.
3. Criterion Validity - The degree to which a measure correlates with an external criterion or outcome.
4. Concurrent Validity - A type of criterion validity in which a measure correlates with another measure assessed at the same time.
5. Predictive Validity - A type of criterion validity in which a measure predicts future outcomes or behaviour.
6. Content Validity - The degree to which a measure adequately represents all aspects of the construct or content domain being assessed.
7. Construct Validity - The degree to which a measure accurately assesses the theoretical construct it is intended to measure
What are the different types of patterns?
1. Bell shaped
2. Skewed (left, right)
3. Unfiform ( the bars are =)
4. Bimodal (2 peaks)
What is central tendency?
what value best represents a typical vaue/centre of distribution
Measures of central tendency
1. Mode - score with the highest frequency
2. Median - score the divides the distribution in 2 equal parts
3. Mean - average
4. Range - difference between largest ad smallest value
5. IQR - difference between the upper and lower quartile
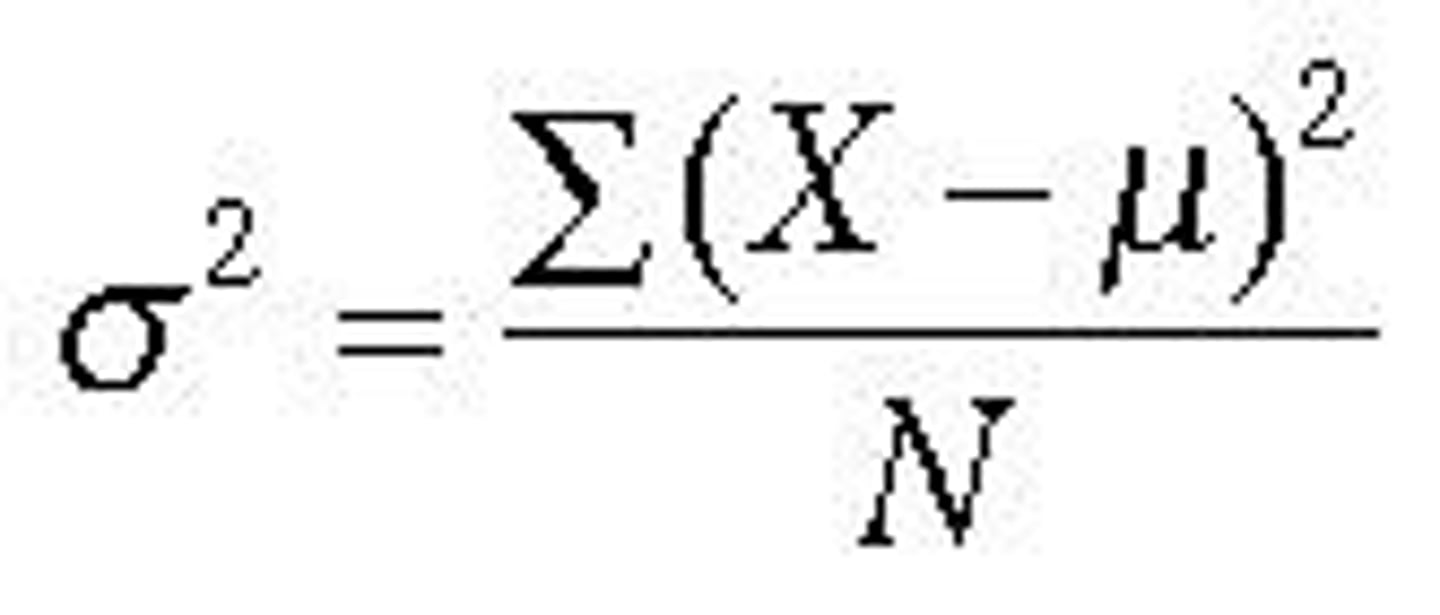
Variance
Considers all values
deviation score =
score - meam
What does squaring each deviation score do?
means that all values are positive, providing mor e weight to larger deviations. - outliers affect variance more
Variance =
mean squared deviation - add all sqaured deviations together and divide by the number of scores
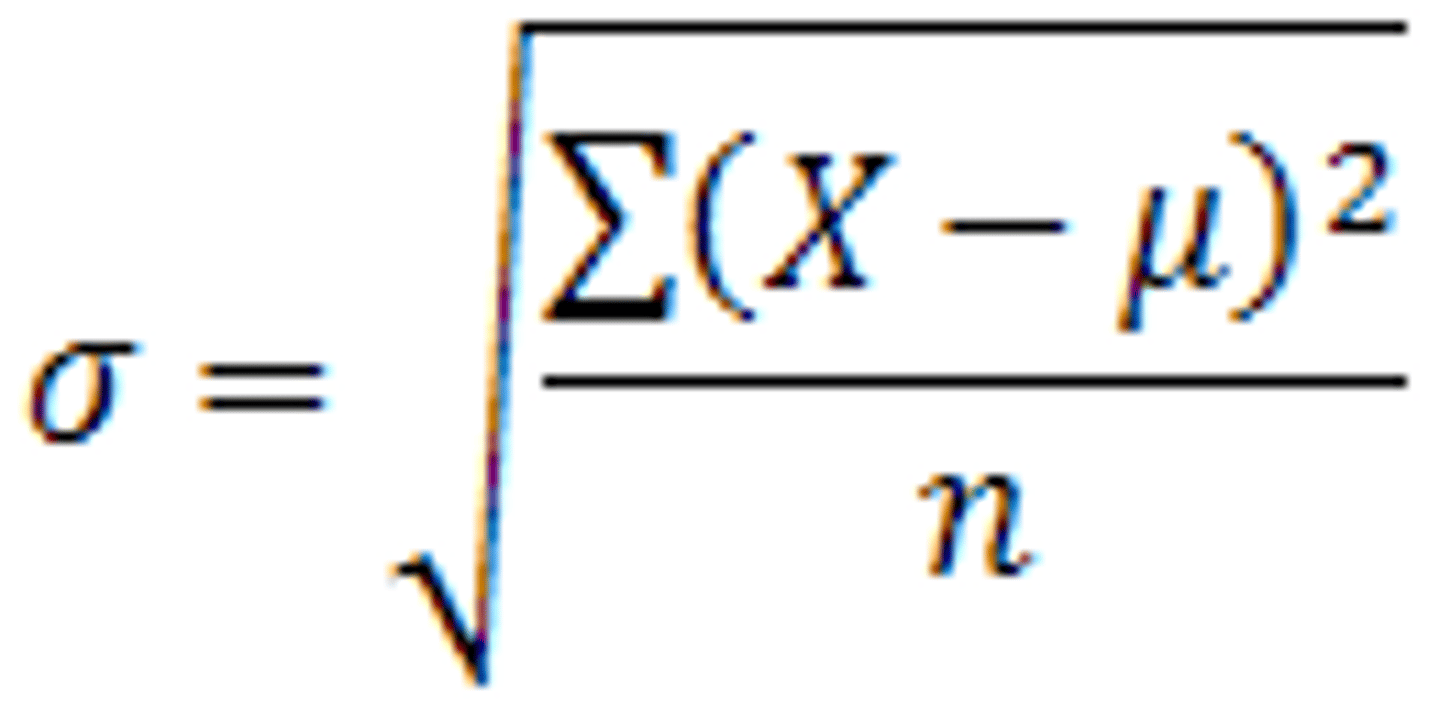
Deviation =
to obtain the original units - take the squareroot
Relative scoring
interpret a score with respect to it's relation to the mean
Standardization
converting raw data into a z-score
How to get a z-score?
Divide the deviation scores by the standard deviation
- how many standard deviatrions a value is
Proporties if the stanard normal distrubution
1. mean = 0
2. DS = 1
3. Total area = 1
4. mean, median, mode = nearly the same
Population
o all cases with the target characteristic

Sample:
o subset of the population
o Purpose of statistical methods is to allow us to confidently generalise from our samples to the population
methodological processes involved in testing a research hypothesis.
o Start with the assumption that there is no effect/association = null hypothesis.
o Seeking evidence against the null hypothesis
o H0 = Null hypothesis
1. Devise the intervention: operationalise the independent variable
2. How to assess the dependent variable: operationalise the dependent variable
3. Determine how to judge whether the intervention was effective: select a comparator-effective compared to what?
4. Collect data from people who have completed the intervention
5. Run a statistical decision
6. Draw a conclusion
After attaching a probability to results, if they are unlikely, what are the two possibilities?
(1) The null hypothesis is true and our results are unusual
(2) The null hypothesis is false
o The probability we use is the P value
Why try to find evidence against a null hypothesis rather than evidence for a research hypothesis?
falsifiability (stronger than confirmation)
What s a P-value
o Probability of obtaining to observed results if the null hypothesis is true
o If this probability is small = reject the hypothesis
o Not small, we retain the null hypothesis
o Small means <.05
Variance of the sampling distribution = σ ²/x̄ = σ² / n
σ²x̄ = variance of the sampling distribution of the mean
σ² = population variance
n = sample size
Standard deviation of the sampling distribution of the mean =
σx̄ = squareroot σ 2/x = σ 2/x /N - standard error of the mean
what does standard error of the mean do
- This gives us an indication of how much (on average) we expect each sample mean to vary from another sample mean of the same sample size (N)
Shape-the Central Limit Theorem
as the sample size becomes large, the sampling distribution of the mean will have an approximately normal (bell-shaped) distribution, regardless of the shape of the original population distribution.
Critical x̄ approach
determine whether to reject the null hypothesis by comparing the sample mean to critical values.
One tailed vs two-tailed test
One tailed = directional HA
Two tailed = non-directional HA
Types of qualitative data analysis
1. Thematic - themes/patterns
2. Grounded theory
3. Interpretative phenological analysis- how individuals experience and make meaning of it
4. Narrative - personal stories
Data collection methods
Semi-structures interview - open-ended
Structured interview - set questions, limited range response
Unstructured interview- opening statement
In depth interview
Focus groups - group interview
Observational - enthrograghy
What do t-tests do?
Determine whether differences in means are statistically signficant
One-sample t-test
Compare the mean of one sample to a known/hypothesised mean
Related-samples t-test
sam participants measured twice. mean difference between 2 mesurements
Independent samples t-test
2 unrelated group means comapred
Results of a t-test
1. t-value- size + direction of difference
2. degrees of freedom (n observations - n estimations)
3. p-value
Common effect size (Cohen's d)
A measure of effect size that indicates how large/meaningful the difference between two means is
- how much of the variance in the outcome can be explained by group differences
0. 2 = small
0.5 = medium
0.8 = large
What are confidence intervals and their role in statistical inference?
range of values likely to contain the population mean. 95% = common
If the CI does not contain the null value, the results = significant
Counterbalancing
varying the order of conditions across participants to prevent order effects from influencing results - imrpoves interval validity
Problem with repeated measures design
results can be influenced by order effects- better practise, fatigue etc.
When is one-way analysis of variance appropriate?
1. 1 IV with multiple levels
2. 1 continuous DV
3. Testing for overall group differences
What do the results of one-way analysis of variance tell us
1. F-test
2. Does not tell you which groups differ
What is the Mean squared within?
An estimate of population variance based on the combined influence of treatment effects and sampling variability on the group means.
eta squares (n2)
How much variance is explained across all groups (3+)
n2 = SSB/SST
SST = total sum of squares)
SSB = sum of squares between groups
Internal validity
The extent a study accurately estabkishes a causal relation between IV and DV. - threatened by confounding variables
External validity
ability to apply findings beyond the conditions of research
Differences between One-Way ANOVA and Two-Way
One Way =
effects of a single IV on the DV
Two Way =
effect of 2 IV's, their interaction and one DV
Accounts for more variability in DV
Interaction =
effect of one IV depends on the other IV vise versa
How to calculate components of an ANOVA table?
Factor A - main effect of IV 1