[L9] Soil composition & classification 1
1/65
There's no tags or description
Looks like no tags are added yet.
Name | Mastery | Learn | Test | Matching | Spaced | Call with Kai |
|---|
No analytics yet
Send a link to your students to track their progress
66 Terms
Engineering examples where soil analysis is important
earth dams (strong, low permeability, minimise settlement)
backfilling / pipeline trenching
offshore pipelines
retaining walls
road embankments
Nature
= essential characteristics or basic qualities of soil
= assessed via intrinsic (= essential / natural) parameters
Examples: quartz sand is always made of quartz
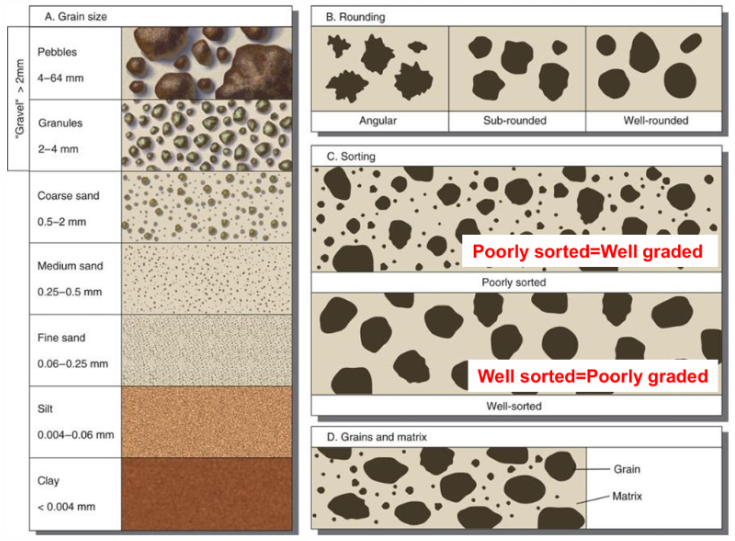
Particle sizes
Particle shapes
Mineralogy (plasticity)
Plastic limit
Liquid limit
Plasticity index
Grain sizes
PSD methods
Sample preparation
Riffling (= machine) or Quartering (=dividing circle)
Sieving methods → COARSE or Sedimentation methods → FINE
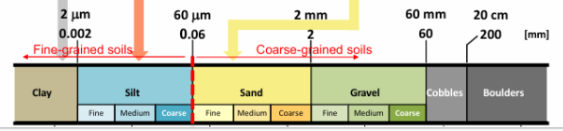
Particle size boundaries
fine-grained soils < 0.06mm < coarse grained soils
Sieving methods
Dry sieving or Wet sieving
aperture size
mass retained
% passing
Sedimentation methods
Hydrometer or Pipette
sedimentation
settling velocity
dispersing agent
PSD coarse fraction → dry sieving or wet sieving?
Dry sieving ➞ only suitable for soils w/ insignificant quantities of silt & clay, mainly used for coarse-grained soils
Wet sieving ➞ significant fines
Sieving
pre-wash & break clumps (matrix suction) before to prevent sticking
class what goes through sieve at each aperture size
source of error: shape of grains (not all square)
Example: m>75mm = particles bigger than mesh size of 75mm don’t pass
Aperture size
size of holes in sieve
Sedimentation techniques
for fine particles <425 microns
pipette
hydrometer
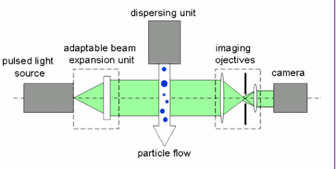
laser diffraction
Settling velocity
The speed with which particles of a certain diameter settle out from a fluid
Dispersing agent
Added to soil/water solution to prevent particles from sticking together (laser diffraction)
Hydrometer
= device that measures density of a fluid
graduated stem + glass bulb
placed in sample to be tested
water level read off the scale (bottom of meniscus)
Hydrometer → Stoke’s law
Applied to:
smooth spherical particles
laminar flow
not applicable to particles <0.2 microns in diameter
→ describes settling velocity
Real soils:
range of roughness
non-spherical
<0.2 microns
➞ causes particles to move faster than w/ Stoke’s law
Brownian motion = random movement of microscopic particles suspended in a fluid caused by collisions w/ surrounding molecules
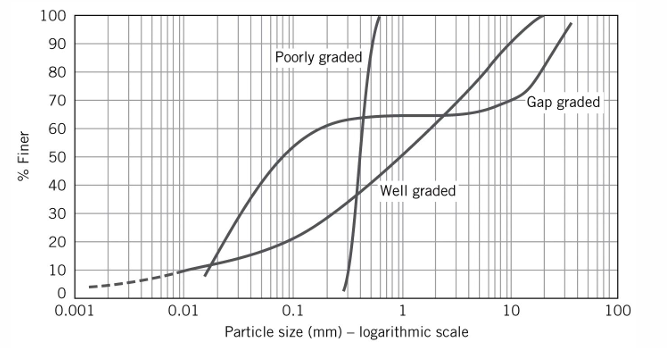
PSD plot
x - Particle size in log10 scale (mm)
y - Percentage passing in linear scale
Sieve range
0.075mm to 4.75mm = fine, medium & coarse sand
Hydrometer range
0.001mm to 0.075mm = clay & silt (fine-grained)
PSD Grading descriptions
Uniform (all similar size)
Gap graded
Well-graded
Poorly-graded
d50
particle size such that 50% of the particles are smaller than d50 (mm)
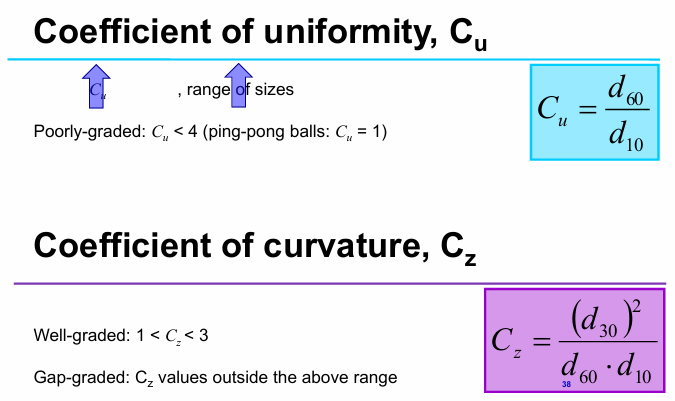
PSD intrinsic parameters
Coefficient of uniformity Cu
Cu=d60/d10
Cu < 4 = poorly-graded
➞ describes range of sizes
Coefficient of curvature Cz
Cz=(d30)2/d60*d10
1 < Cz < 3 = well-graded
other = gap-graded
State
= physical conditions in which soil exists
= quantified via state variables
depends on its depositional and stress histories
Examples
Water content
Void ratio
Liquidity index LI
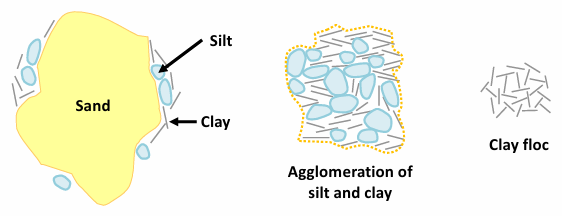
Clay structure
Example: dense or loose soil
Three phases in soils
SOLID
Soil particles: minerals, organic matter
VOID
Liquids:
Water
Gas:
Air
Soil matrix
= interconnected structure = solid particles + voids
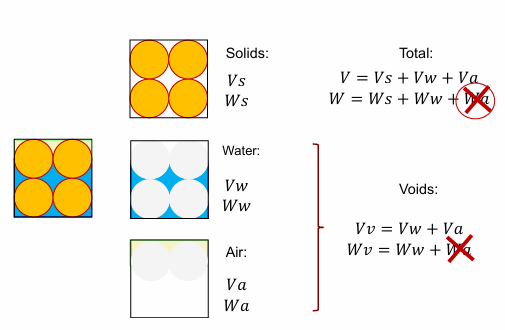
Soil volume S
V=Vv+Vs
with
Vv=Va+Vw
Soil mass S
M=Mw+Ms
(Ma=0)
Density of water N
1000 kg/m3
Density of solids N
Ms/Vs kg/m3
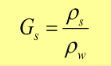
Specific gravity N
density solid / density water
Water content S
= ratio of the weight of water to the weight of solids in percentage (%)
w = Ww/Ws = Mw/Ms
Void ratio S
= ratio of the volume of voids to the volume of solids (dimensionless)
e = Vv/Vs = (Vw+Va)/Vs
Min e and max e ➞ determined w/ given test methods
Packing density S
based on void ratio
Dense ➞ e = 0.2
Loose ➞ e = 1.45
Density of solids N
= mass per unit of volume in kg/m3
ρ = M/V
Degree of saturation S
= volume of water over volume of voids in percentage (%)
S = Vw/Vv = (w*Gs)/e
Relative density S
Same soil can have different arrangements ➞ max and min densities soil can have
tells us how dense the soil is relative to its limits
Dr = (emax-e)/(emax-emin)
(for sands)
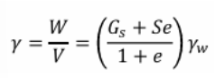
Unit weight S
𝛾 = ρ*g = M/V*g (bulk density)
𝛾w = 10 kN/m3
Bulk density S
ρ = Mtot/Vtot
Specific gravity N
= ratio of the density of solids to density of water (dimensionless)
typically between 2.6-2.7
Gs = 𝛾s /𝛾w = ρs / ρw = Ws/(Vs*𝛾w)
Bulk unit weight S
= a portion of voids is filled by water & other by air (partial saturation)
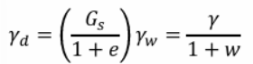
Dry unit weight S
= all the volume of voids is filled by air
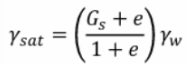
Saturated unit weight S
= all the volume of voids is filled by water (S=1)
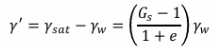
Effective unit weight S
= weight of soil solids in a submerged soil per unit volume = weight of soil - buoyancy force exerted on it
𝛾d ? 𝛾 ? 𝛾sat
𝛾d < 𝛾 < 𝛾sat
Min void ratio N
emin
Densest soil packing that can be determined with a given testing method
Max void ratio N
emax
Loosest soil packing that can be determined with a given testing method
Soil life cycle
Natural state (in situ)
Deposition
Genesis
Formation of fabric
Burial
Overburden
Development of bonds
Consolidation
Erosion
Unloading
Swelling
Over-consolidation
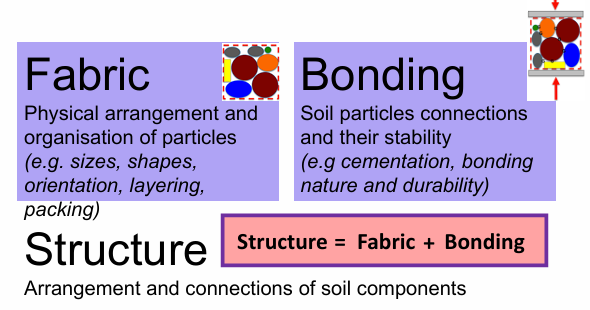
State structure
arrangement & connections of soil components
Fabric + bonding
Undisturbed soil
Soil sample in its natural state
Remoulded soil
Soil sample that has been disturbed from its natural state with some or most of its natural structure removed due to mechanical means
Reconstituted soil
Soil sample that has all of its natural structure removed due to mechanical mixing e.g. at ~1.5 to 2 times its liquid limit
Intact soil
somewhat disturbed, some structure lost
Atterberg limits
classifying ‘fines’ fraction of soil
Plasticity
= soil’s ability to undergo irrecoverable deformation without cracking/crumbling
Plastic limit (wp or PL) N
= lowest water content at which the soil remains deformable without cracking/crumbling
= empirically established water content at which the soil becomes too dry to be plastic
Test:
Soil shears both longitudinally and transversely when rolled to about 3 mm in diameter after 5 – 10 hand movements
subjective results
Liquid limit (wL or LL) N
= lowest water content at which the soil cannot maintain its shape
Tests:
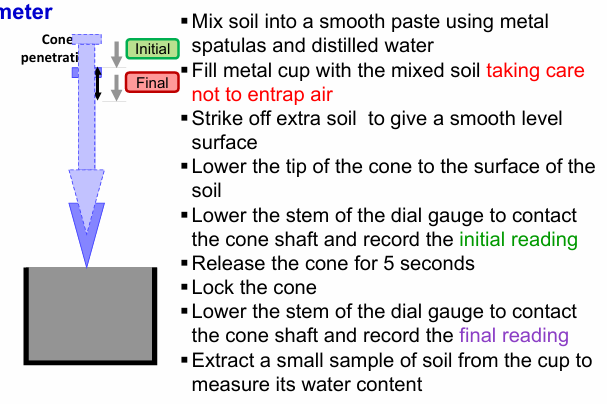
cone penetrometer
Casagrande cup
Cone penetrometer
simple apparatus
less affected by operator
less subjective
→ more repeatable/reproducible results
Liquid limit = water content corresponding to a cone penetration of 20mm
Minimum of 4 evenly distributed readings ranging from 15 to 25 mm penetration
Casagrande cup
simple apparatus
operator dependant
subjective
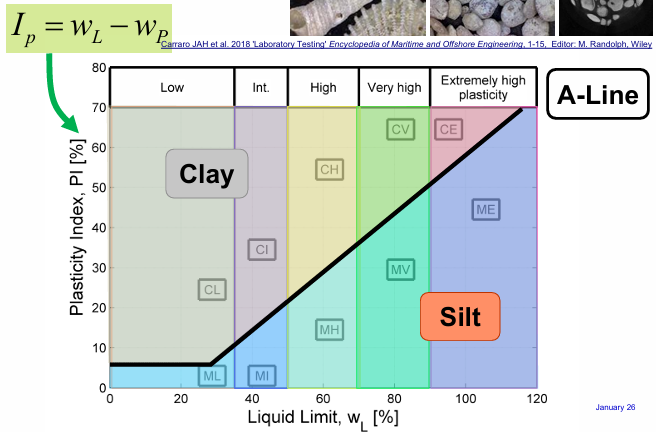
A-line chart
Ip =wL-wP
Plasticity index = liquid water limit - plastic water limit
A-line: IP=0.73(wL−20)
does not always work (offshore sediments, fly ash etc)
Liquidity index S
IL = (w - wp) / (wL - wp)
Activity
A = IP / C
C = clay fraction
IP = plasticity index
Clay fraction
= % (by dry mass) of particles < 2 micrometers
Nature and state examples for clay vs sands
Clays
Nature
Mineral composition
Plastic limit
Liquid limit
Plasticity index
State
Water content
Void ratio
Liquidity index LI
Clay structure
Sands
Nature
Mineral composition
Particle size distribution
Min void ratio emin
Max void ratio emax
State
Grain structure
Void ratio
Relative density
State parameter
IL=0?
at plastic limit

IL=1
at liquid limit
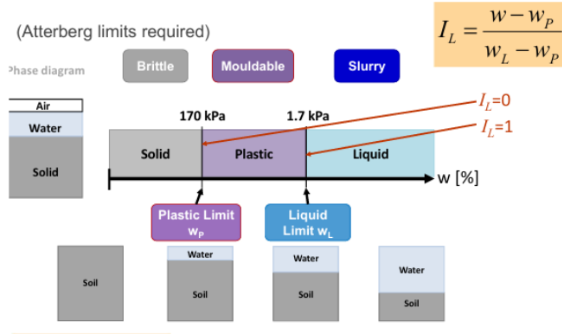
Solid ? Plastic ? Liquid ?
