Investments Test #2
1/34
There's no tags or description
Looks like no tags are added yet.
Name | Mastery | Learn | Test | Matching | Spaced | Call with Kai |
|---|
No analytics yet
Send a link to your students to track their progress
35 Terms
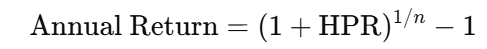
How to find annual return with holding return/period
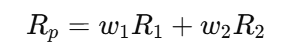
Portfolio return given weight and return
What is the expected risk regarding CAL?
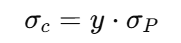
Op = standard deviation
y= weight in the risky portfolio
What are the 3 variables for HPR?
Price Paid
Price Received
Income
HPR
HPRs do not include compounding, and HPRs of two investments are directly comparable when their holding periods are identical.
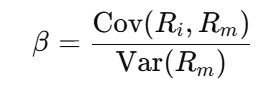
How to find beta given covariance and excess returns
Beta when given weights and betas
Neglected firm effect
stocks of companies that receive little analyst coverage tend to earn higher returns than well-followed companies.
January effect
a market anomaly where stock prices—especially small-cap stocks—tend to rise more in January than in other months
covariance
A measure of comovement between a pair of risky assets, measured on a scale ranging from negative to positive infinity, is called
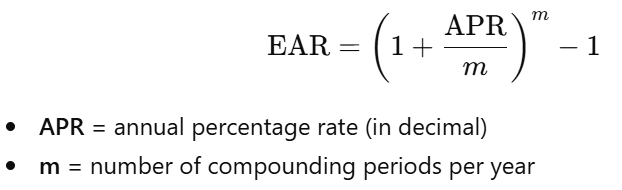
EAR
Return difference and whether it is undervalued, overvalued, or properly valued
subtract given expected return - calculated return
Calculate total return for following months
How to determine if a stock dominates
Higher return + lower risk → dominates
Same return + lower risk → dominates
Higher return + same risk → dominates
Nonstationary beta problem
The beta estimated today differing from the estimation a year from now refers to which problem
Market index bias
The presence of which of these makes it imperative that beta comparison among individual companies reflect identical and appropriate market benchmarks?
when a stock’s beta (or performance) depends on which market index you use as the benchmark.
Time interval bias
happens when a stock’s beta (or risk estimates) change depending on the data frequency used
An adjusted closing price is adjusted for the effects of
dividends paid and stock splits.
The anticipated rate of return when either the beta is 0 or the market rate of return is equal to the risk-free rate is called
alpha
What are the stock's deviations from an expected 4-Factor model return if the realized return is 1%?
Step 1: plug in all #s into CAPM equation
Step 2: Convert to total expected return
R=Rf+(R−Rf)
Step 3: Compute deviation
Deviation (or realized alpha)=Realized Return−Expected Return (from model)
Paco currently has a portfolio with an expected return of 10.25% and a standard deviation of 13.75%. He is wondering if he should reallocate 50% of his current portfolio to an asset class that has an expected return of 15% and a standard deviation of 12%. The correlation between his current portfolio and the other asset class is 0.8. What would be Paco's new return, and by how much would it increase or decrease?
E(Rp) = weight * expected return
subtract new expected return from expected return
Which return/standard deviation could be most stale?
includes outdated, abnormal data that no longer reflects current performance.
What are arithmetic averages better for?
for estimating next-period expected return
What is geometric averages good for?
for measuring actual performance (accounts for compounding); performance evaluation
When should you use population σ or sample σ?
Historical returns are sample (N-1)
Population only for probabilistic scenarios where all outcomes and probabilities are explicitly enumerated (N)
How to solve a multi period HPR problem

Income yield
Income/Price paid
capital gains yield
= (P₁ − P₀) ÷ P₀
Expected return, Required return, and Realized return
Expected: probability weighted forward looking estimate (before the fact)
Required: minimum return investor demands given the risk (before the fact); depends on risk aversion and systematic risk
Realized return: actual return earned - calculated after the fact
Total return
income + capital appreciation
HPR return
total return (income + price change) / beginning price
How to find EAR from APR
Strong, Semi-strong, Weak form
Strong: Current prices reflect all public information and non-public information. All trading rules are pointless
Asset allocation and portfolio construction
Semi-strong: Current prices reflect all public information. All trading rules based on public information are ineffective.
Fundamental analysis with private information, asset allocation and portfolio construction
Weak: Current prices reflect all public information. All trading rules based on public information are ineffective.
Fundamental analysis, asset allocation and portfolio construction
Data snooping
you search through a dataset until you find patterns that look significant—but are actually just random noise
EMH Paradox
Markets are only efficient because people try to beat them—but if everyone believed markets were perfectly efficient, no one would try, and markets would become inefficient.