PSYC 2017 Final Exam
1/56
There's no tags or description
Looks like no tags are added yet.
Name | Mastery | Learn | Test | Matching | Spaced | Call with Kai |
|---|
No analytics yet
Send a link to your students to track their progress
57 Terms
Describe the relationship between two variables by scatterplot or bar graph
Interrogate the statistical validity of an association claim, asking about features of the data that might distort statistical findings
Interrogate the external validity of an association claim by asking to whom the association can generalize
Bivariate association
Relationship between exactly two (likely measured) variables. An experiment may or may not have happened
Continuous variable
A variable with an “infinite” number of possible values. Height (0’0 to 7’0 or taller), age, anything that can be denoted with a number
Categorical Variable
A variable with non-numerical categories as possible values. Ex: Class standing, ethnicity, experimental treatment, political belief
Pearson’s R
A measure of linear association between two continuous variables. Ranges between -1 and 1. The sign determines the direction, the magnitude determines the strength of the correlation
Scatterplots don’t show continuous-categorical associations very well
True
Sometimes one variable is categorical (Ex: meeting location) and the other variable is continuous (Ex: marital satisfaction)
True
What type of plot better depict continuous-categorical associations
Bar plots
Correlation study
Type of study with no manipulated variables. Non-experiments and doesn’t establish temporal precedence. Struggles to address other variables
Internal Validity
Can causal inferences be made?
External Validity
To whom or what context can an association be generalized?
Construct validity
How well was each variable measured?
Statistical validity
How well does the data support the conclusion?
Association Claims - Construct Validity
Data for first variable must be valid and reliable, then data for second variable must be valid and reliable. If not, none of the proposed associations matter
Effect size
Describes the strength of the association. Computation of effect sizes allows comparability across studies —> comparisons to “benchmarks”. Different statistics will have different effect size benchmarks
Linearity
Is the assumption of linearity satisfied? (statistical validity)
Association Claims - Statistical Validity
Effect size, precision, replication, linearity, outliers, restriction of range?
Precision of the Estimate
The statistics we calculate are estimates of the population values we actually care about. We don’t care about r, we care how well r estimates p
Confidence Interval (CI)
Range of values for a statistic in which there is some probability (typically 95%) of containing the true population value. As sample size goes up, certainty goes up, and CI width narrows and goes down
How to read CI
{stat} = ##, 95% CI [{lower ##}, {upper ##}]
Ex: r = -.57, 95% CI, [-.77, -.37]
An estimate is statistically significant if the probability of it occurring under the null hypothesis is less than same maximally acceptable cutoff
p < .05
Statistical Significance or non-significance
Determining the likelihood that a sample statistic would be selected if the hypothesis regarding the population parameter were true
As sample size goes up, certainty goes down
False
Replication
Studies and results should be replicated or conducted again. Multiple studies act like multiple participants. Ex: meta-analyses
Outliers
Values that are more extreme than expected or deviate substantially than expected from the rest of the sample. Could bias the observed relationship between two variables. Most problematic with small sample size
Outliers can be removed if its due to an error
True
Restriction of Range
When certain range of a variable is artificially excluded from the data. When range is restricted, the observed correlation may be attenuated (lowered) Ex: If a college doesn’t admit students with an SAT score lower than 1200, there is no data/no range to see how well students with an SAT under 1200 perform in college GPA.
Spurious Associations
Association due to difference in means among subgroups.
Association Claims - External Validity
Cares about for whom or in what context. Ex: “depends on..”, “especially for…”. Does the association change with the context?
Interaction/Moderation effects
Degree to which the relationship between a predictor and outcome depends on another predictor. Not unique to experiments!
Moderator
A variable that changes the relationship between two other variables (external validity)
Association Claims - Internal Validity
Not a high priority, but… unaccounted explanatory variables still a concern
A researcher studies the relationship between daily caffeine intake and test performance, finding a Pearson's r of .01. However, the scatterplot shows that students with moderate caffeine intake score perfectly, while those with zero or massive intake fail. What explains this near-zero correlation?
When a researcher is examining the bivariate association between exactly one categorical variable and one quantitative variable, which visualization is required?
A study reports a moderate positive correlation between video game hours and aggressive behavior. Further analysis reveals this correlation is strong for children who play alone, but completely non-existent for children who play with their parents. In this scenario, the playing context (alone vs. with parents) acts as a?
An organizational psychologist is hired to determine if typing speed predicts coding efficiency. They test 200 Senior Software Engineers at a highly competitive tech firm and find a correlation of r =.03. Which statistical validity threat is most likely responsible for this near-zero correlation?
A university sends out a cross-sectional survey to its alumni. The results show a moderate negative correlation (r = −.42) between “current student loan debt” and “reported life satisfaction”. The university's financial office releases a statement saying “Having debt actively ruins our graduates' happiness”. What is the primary flaw in this causal claim?
What is the relationship between moderators and external validity?
RESEARCH STUDY 8.1: Dr. Guidry conducts a study examining the relationship between the number of friends one has and the experience of daily stress and life satisfaction. She randomly samples 1,500 elderly men and women in Nashville, Tennessee (the state capital), located in the southern United States. Below are her findings:
◦Life satisfaction and experience of daily stress: r = –.57, 95% CI [–.77, –.37]
◦Number of friends one has and experience of daily stress: r = .09, 95% CI [–.27, .45]
◦Number of friends one has and life satisfaction: r = .36, 95% CI [.12, .60]
•In determining whether the relationship between two of Dr. Guidry’s variables was statistically significant, which of the following must be considered?
Explain how multiple-regression analyses help address internal validity (the third-variable problem)
Explain the purpose, similarity, and differences in mediators and moderators
Explain how longitudinal correlational designs can establish temporal precedence
Experiments must satisfy three criteria for causal claims:
Experiments establish covariance
Experiments establish temporal precedence
Well-designed experiments establish internal validity
Why not to do an experiment?
Might be impossible to manipulate a variable (Ex: can’t force someone to be a narcissist).
Might be unethical to assign to certain conditions (Ex: Can’t assign children to potentially harmful outcomes long-term)
Third-variable Problem
When an explanatory variable is excluded that would otherwise explain the relationship between two variables. Results in a “spurious association”
______ allows us to assess the relationship between a predictor and outcome while controlling for other variables
Multiple regression
Multiple Regression Example
Exposure to sexual TV content —→ pregnancy risk
Pregnancy risk —→ exposure to sexual TV content
Possible third explanation: age. As people get older, women are more likely to get pregnant, and people are more likely to watch sexual TV content
Beta coefficient (β)
Standardized regression coefficient. Similar to a correlation coefficient ( r )
Unstandardized Coefficients
Standardized Coefficients
Interpreting Coefficients
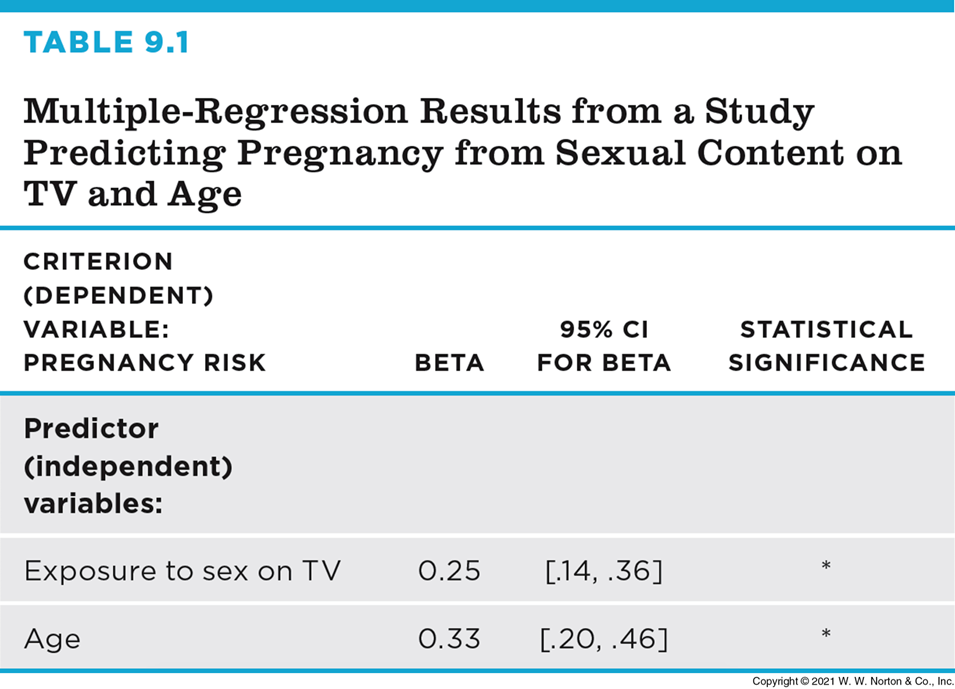
For one SD increase in TV exposure, pregnancy increases by .25 standard deviation while controlling for age
For one SD increase in age, pregnancy risk increases by .33 standard deviations, holding TV exposure constant
Limitations for Internal Validity
Multiple regression can: establish covariance, rule out confounding variables (assuming they have been measured)
Multiple regression cannot: establish temporal precedence
… which is a known predictor of marital satisfaction. If Dr. Finkel conducts his study again and asks people to report on how many years they have been married as well, which of the following statements is true?
Mediation
Explains a relationship between two other variables in that one variable is hypothesized to cause the mediator which then causes the other variable
Sounds like “median” which means middle. Answers “why”
Moderation
Alters the strength of a relationship of two other variables depending on its own value
Sounds like “modification”. Answers “for whom or what type”