the psychology of educational inequality
1/32
There's no tags or description
Looks like no tags are added yet.
Name | Mastery | Learn | Test | Matching | Spaced | Call with Kai |
|---|
No analytics yet
Send a link to your students to track their progress
33 Terms
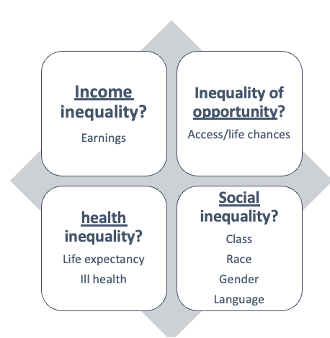
social inequality
The state of not being equal, especially in: status, rights and access to opportunities
Eg women’s healthcare - if from lower ses/ethnic minority, treated dif when pregnant
examples of where social inequality can arise
gender, lack of education, quality of education (teachers aren’t as good, less resources), ethnicity etc Housing (eg clean air, access to green spaces), Social class, Income, Employment, Low pay, Disabilities and health, Age
why are psychologists concerned about inequality
Results in lower self-esteem, lack of belonging, frustrated, angry, sad, disappointed
Gender - 80% UG psychologists are women, most professors are men, why
Autism - if ethnic minority less likely to access services - what are the barriers
Education - educational healthcare plans for SEN students, way document is enacted isnt legally enacted, even though it should be. Also could be in a type of school not app for child’s needs
impact on areas of psychology
affects the five pillars
bio, cog, dev, social and personality, mental and physical health
Further psychological impact of inequality
Negative emotional consequences of inequality
Stigmatization
Perceived injustice, not fair, how do you react to when its unfair
Lower self esteem
Lower health—(linked to emotions and self), if not feeling good emotionally, affects you physically
data surrounding inequality in education
may want to compare groups in performance and developmental milestones
evaluate educational programmes, come up with recommendations etc
data for educational inequality across the world
pos correlation between gdp and education index
gapminder used
can see dif continents, population etc
Nations with high levels of education result in people earning lots of money, or nations with more money can invest in education
allows us to see the interaction
Distribution of education levels across the globe
our world in data
can use a map to portray the different levels by using colours
europe = lots of time in education
africa etc much less time
gender gap in fear of failure
most countries very unequal
If someone is concerned about failure, may not take risks which are necessary for growth, how they engage with school etc
In the UK gender gap is quite large - could be because girls are more open about it or there could be a real gender gap
Gender gap in attitudes towards competition
Boys are much happier to compete than girls, impacts how you engage in other aspects of life
If young girls less happy to compete and more fearful of failure, will they put themselves forward to apply for competitive places at uni/jobs/promotions
most countries are unequal
most boys are more happier to compete
What can be done to reduce educational inequality?
contextual offers
free school meals
stormzy + hsbc, getting black students into cambridge where there is a big underrepresentation
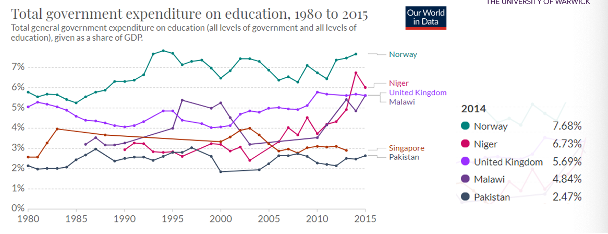
Public spending on education
schools only get 5.5% of the budget (2014)
education, inequality and money
Not simple to put forward interventions as have to think about where the money is coming from
So want to support interventions with best success rate and most research
So psychologists may test two interventions for supporting students with dyslexia, cheap vs expensive, similarish impact but the more expensive one is better, will probably suggest cheaper one
So best interventions cant always be delivered
spending compared to other countries
Spend a similar amount to other countries which may have very dif outcomes
structural inequality
A social structure that has inequality already “built in”. Eg education, police - racism misogyny etc is institutionalised
Hierarchical differences between people that affects access to resources (unequal opportunities).
Structural inequality lies in the way in which the dimensions interact one with another.
impacts of education and inequality
If experience some of these inequalities early on, can impact how much you earn, life expectancy and other things shown in the diagram
Education also influence health and life expectancy through indirect channels
Stereotypes we have may impact the way toddlers play, stem subject access, ethnicities treated differently
Why is there education inequality in the UK
economic disadvantage,
ethnicity,
gender,
whether a child has been in care,
or has special educational needs and disability (SEND).
There is also regional variation in the average size of the disadvantage gap - eg access to health services in rural vs built up areas
factors relating to inequality which affect each other
life expectancy
mental health
levels of violence
drug abuse
the educational performance of school children
the strength of community life
income inequalities
The more unequal a society is, the more ill health and social problems it has.
We measure how unequal a society is using the gini index
The greater the number, the more unequal a society is
uk is quite unequal
how has inequality changed in the uk
gap has widened
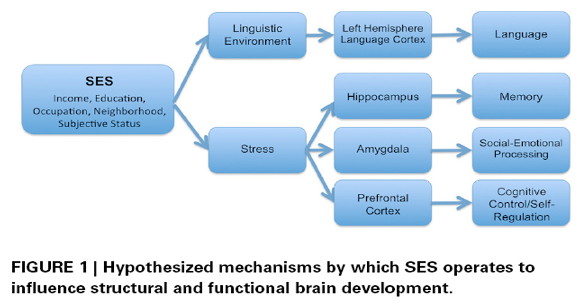
associations between socioeconomic status (SES) and brain development
If have lower income, poorer education, more stressful environment
May not have access to play, linguistic differences not exposed to rich language
May impact brain development
inequality impact on childhood education
By age three, being in poverty makes a difference equivalent to nine months’ development in school readiness. (behind by 9 months), relates to social abilities etc eg still in nappies
During their years at school, children in receipt of free school meals (a key indicator of poverty) do progressively worse on average at school than their peers.
Children who do badly at primary school are less likely to improve at secondary school if they are poor.
further education and inequality
Children from poor families are more likely to have poor qualifications.
Young people with parents in manual occupations are far less likely than others to go to university and only 1 in 6 of students at top universities come from lower socio-economic backgrounds.
The school a child attends makes a difference of between 10 and 20% between pupils’ academic results. Source: Centre for Economic and Social.
program to help reduce education inequality
Surestart - located in poorer areas, supported families with accessing health, education (including outside of the school system), parenting skills
gcse performance and ses
- the poorer an area the pupil comes from, the worse their GCSE performance, but the picture is dif in london
- eg poorer do better in gcses
area impacts it
intersectionality
gender, ses and ethnicity influence gcse scores
how these come together is what intersectionality is
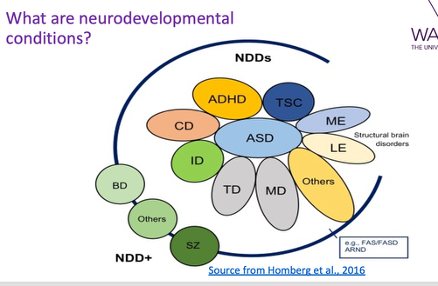
examples of neurodevelopmental conditions
adhd statistics
Overall prevalence 3% to 10% in school-aged children
Diagnosed in boys 3 to 4 times more often than in girls, diagnostic criteria is very male eurocentric, women often misdiagnosed with bipolar, anxiety
Now seeing more adults being diagnosed, more women, some of the ways it might manifest in women may be different, not just a childhood condition
Persists in 30% to 50% into adolescence and adulthood (symptom profile may change)
aetiology of adhd
Strong genetic component (approx. 76% - Faraone et al., 2005 )
Perinatal factors – some evidence
Neurobiological deficits – growing evidence
Deprivation and family factors – important for course and outcome, if already have genetic propensity, how does that intersect. what are the outcomes of those symptoms
The idea of epigenetics
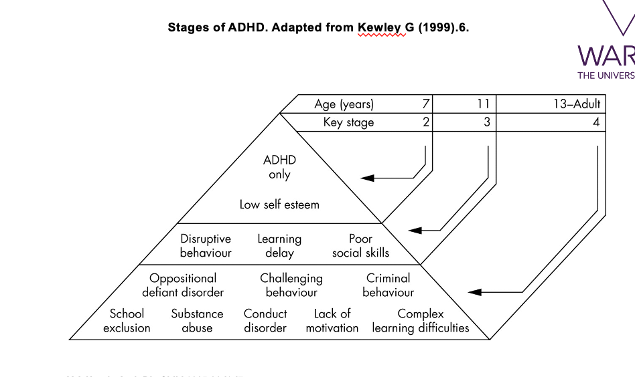
impact of adhd on other factors at dif stages
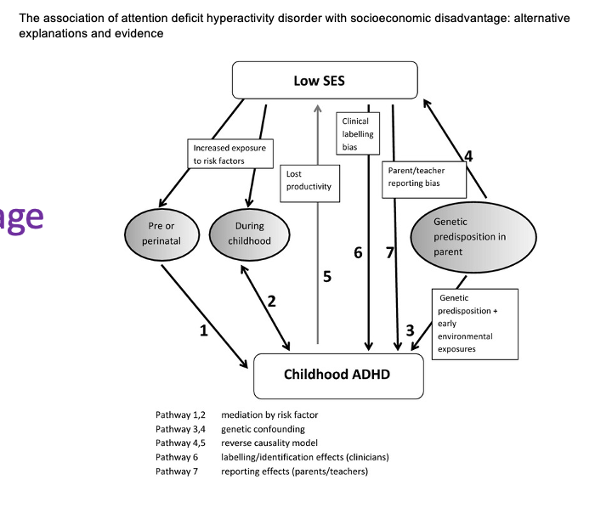
ADHD and economic disadvantage
Link between social and economic status and childhood attention deficit disorder (ADHD) in the UK.
Children with ADHD came from families below the poverty line with average family income at £324 per week, compared to £391 for those whose child did not have ADHD. - difference could be due to it being harder to look after child so its harder to keep a job
The study found the odds of parents in social housing having a child with ADHD was roughly three times greater than for those who owned their own homes.
millenium cohort study
ADHD and educational disadvantage
At least one in five students with ADHD receive no school services despite experiencing significant academic and social difficulties
Most evident for
Adolescents
youth from non-English-speaking
and/or lower-income families
Affects some groups more than others
Can exacerbate inequality
double disadvantage