(L15, 16) IMED2003 - Observational Research and Problems in Research
 Call Kai
 Learn
Learn Practice Test
 Spaced Repetition
 Match
Match Flashcards
 Knowt Play
1/81

There's no tags or description
Looks like no tags are added yet.
Name | Mastery | Learn | Test | Matching | Spaced | Call with Kai | Chat |
|---|
No analytics yet
Send a link to your students to track their progress
82 Terms
What are the main learning outcomes for Lecture 15: Observational Research?
1. Identify and evaluate relevant measures of disease frequency: incidence and prevalence.
2. Identify and evaluate the relevant measure of association for different study designs, especially cohort and case-control studies.
3. Calculate and interpret odds ratio and relative risk/risk ratio.
4. Interpret these measures and evaluate claims about exposure or treatment effects.
Not required:
Calculating confidence intervals for these measures.
Why did the lecturer emphasise that confounding should not simply be treated as the same thing as bias?
Confounding and bias are related methodological concerns but are not identical.
Lecturer explanation:
Identifying confounding factors can be scientifically useful because it may reveal a third factor that helps explain an observed association. Observational research can therefore generate valuable mechanistic and preventive insights even when it cannot directly establish causation.
.
DEFINING CRITERIA OF CONFOUNDING FACTORS:
related to both exposure and outcome
distributed unequally between study groups
not be an intermediary step in a causal pathway between exposure and outcome
How can observational research remain useful even when it cannot directly prove causation?
Observational research can identify:
- Population patterns.
- Associations between exposures and outcomes.
- Potential confounding factors.
- Groups at increased risk.
- Hypotheses that can later be investigated mechanistically.
.
Lecturer example:
Rare severe thrombosis/thrombocytopenia reactions after some COVID-19 vaccines were studied at population level. Identifying genetic or other risk factors can help explain why only some people react and can guide safer vaccine development or management.

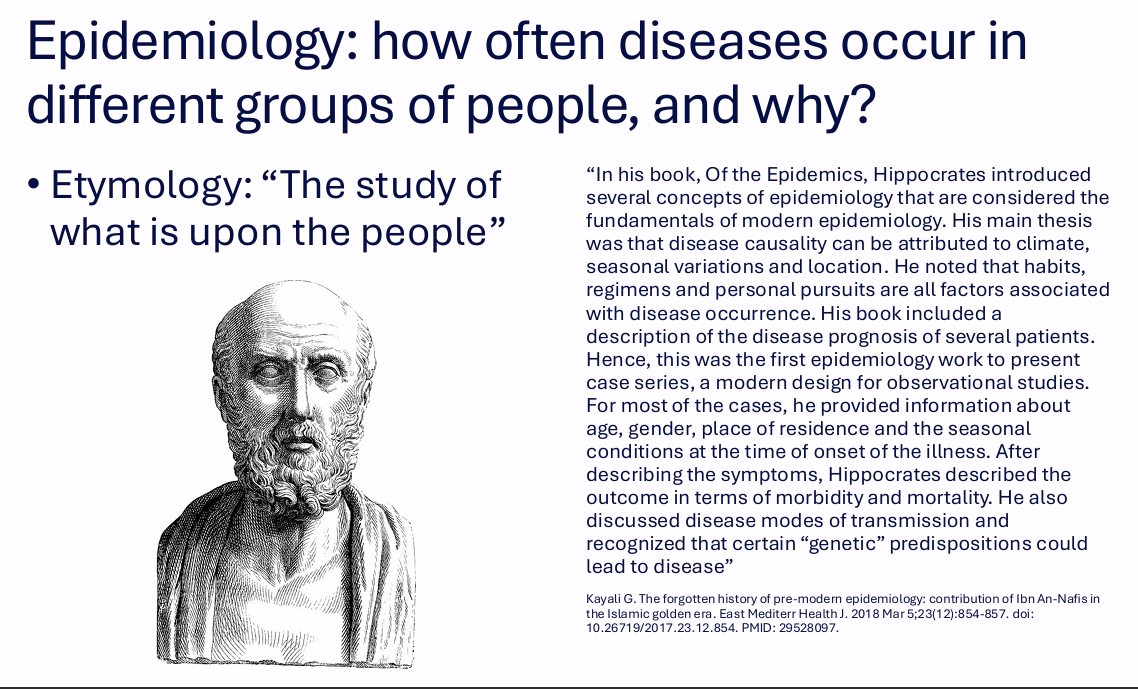
What does epidemiology study, and what historical ideas were linked to Hippocrates?
Epidemiology asks how often diseases occur in different groups of people and why.
Etymology:
"The study of what is upon the people."
.
The Hippocrates example included:
- Climate, seasonal variation and location as possible causes of disease.
- Habits, regimens and personal pursuits associated with disease occurrence.
- Case-series descriptions.
- Age, gender, residence and seasonal conditions.
- Morbidity and mortality.
- Modes of transmission.
- Predispositions associated with disease.
What are incidence, point prevalence and period prevalence?
Incidence:
New cases occurring over a defined period.
.
Point prevalence:
Cases measured at one point in time.
.
Period prevalence:
Cases measured cumulatively over a period of time.
.
The relevant time period should make sense for disease development.
.
These are dichotomous variables:
A person either has the condition or does not.

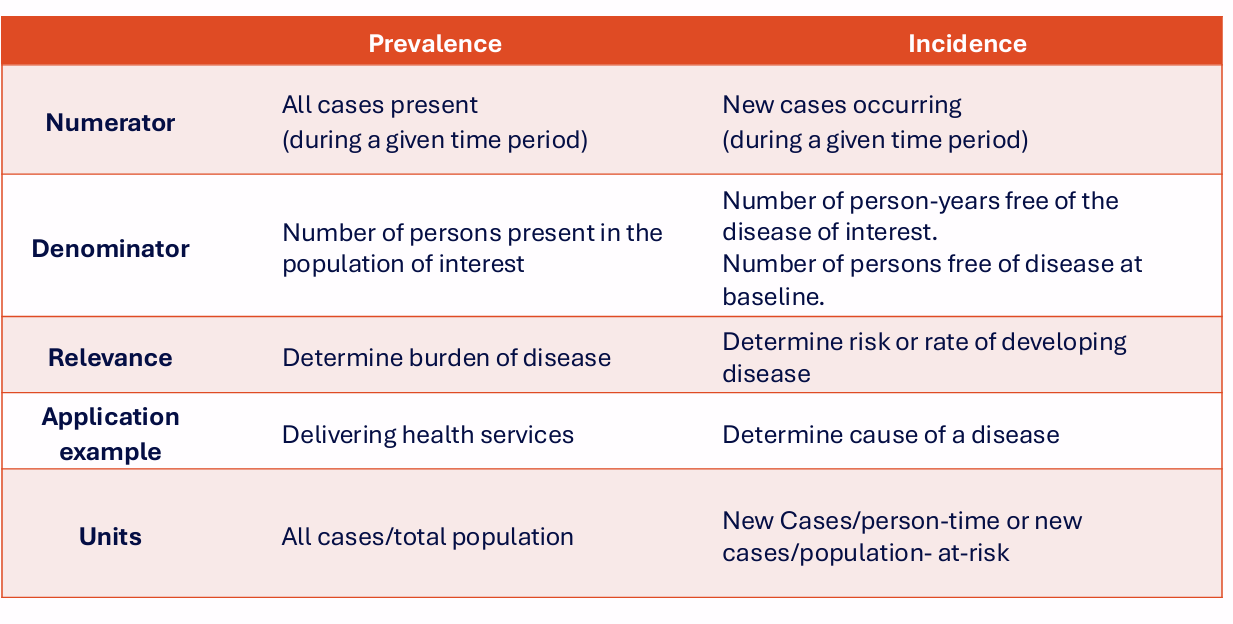
How do prevalence and incidence differ in numerator, denominator, purpose and units?
Prevalence:
- Numerator: all cases present during the period.
- Denominator: number of persons in the population of interest.
- Relevance: burden of disease.
- Application: planning/delivering health services.
- Units: all cases / total population.
.
Incidence:
- Numerator: new cases occurring during the period.
- Denominator: person-years free of disease or persons free of disease at baseline.
- Relevance: risk/rate of developing disease.
- Application: investigating causes.
- Units: new cases/person-time or new cases/population at risk.

What did the 2023-2024 U.S. tobacco-use prevalence example show?
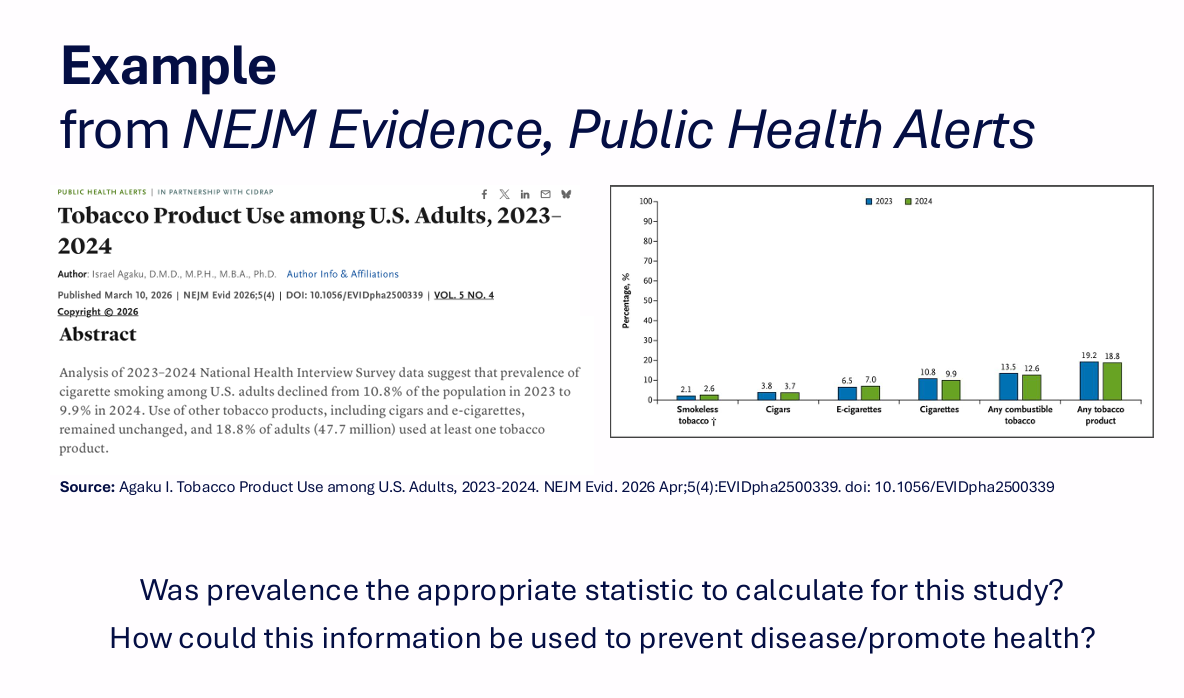
The NEJM Evidence example described tobacco-product use among U.S. adults in 2023-2024.
Visible finding:
Cigarette smoking declined from 10.8% in 2023 to 9.9% in 2024.
.
The figure compared prevalence for:
- Smokeless tobacco.
- Cigars.
- E-cigarettes.
- Cigarettes.
- Any combustible tobacco.
- Any tobacco product.
Why was prevalence useful in the tobacco-use example even though it did not itself demonstrate causation?
Prevalence describes how common a behaviour or condition is in a population and how it changes.
.
Lecturer explanation:
Tobacco use is already known to cause morbidity and mortality. Therefore, prevalence data can be combined with established causal knowledge to:
- Identify which products are becoming more or less common.
- Guide tobacco-control policy.
- Target prevention and health-promotion efforts.
This illustrates the predictive value of applying established theory to observational data.
How can prevalence be used to estimate an individual's pre-test probability of disease?
Example:
Peak influenza rate in Boorloo/Perth in 2019 = 8.8 per 1000 people.
.
Equivalent estimated risk at that time:
0.88%, if nothing else is known about the person.
.
Diagnostic/screening sequence:
1. Estimate pre-test probability.
2. Convert to pre-test odds.
3. Apply PLR or NLR depending on the test result.
4. Obtain post-test odds.
5. Convert to post-test probability.
What are the exposure and outcome variables in observational research?
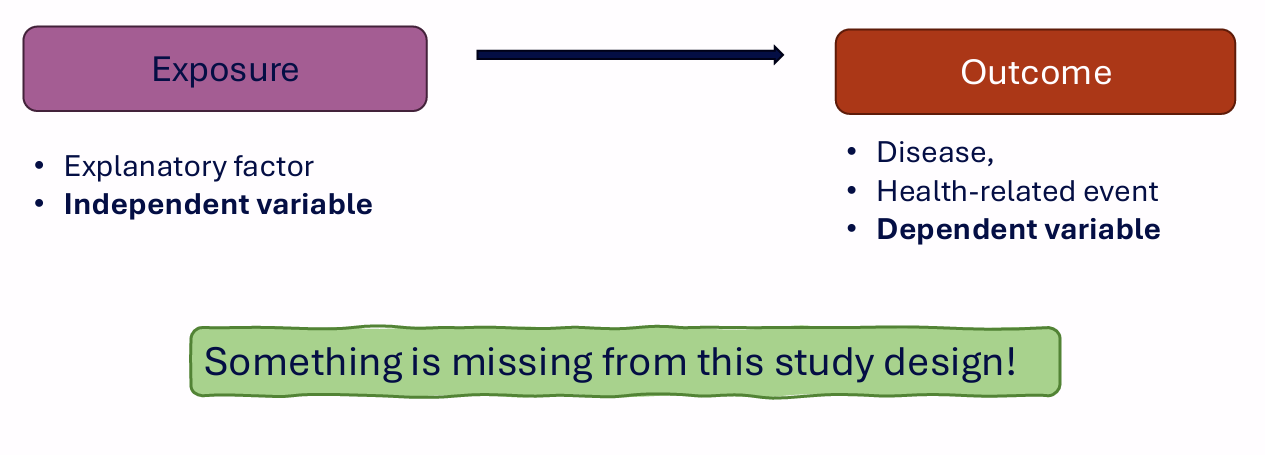
Exposure:
- Explanatory factor.
- Independent variable.
.
Outcome:
- Disease or health-related event.
- Dependent variable.
.
A simple exposure → outcome observation is not enough by itself; comparison groups are needed.


What is a measure of association?
A statistic that quantifies the relationship between an exposure and an outcome by comparing the relevant exposed/non-exposed and outcome/non-outcome groups.


How do cohort and case-control studies differ in direction and ability to calculate risk?
Cohort study:
- Begins with a population at risk.
- Groups participants by exposure.
- Proceeds from exposure toward outcome.
- Study direction follows the proposed causal direction.
- Appropriate for calculating risk.
.
Case-control study:
- Begins with cases and controls selected by outcome.
- Looks backward to determine prior exposure.
- Study direction is opposite the proposed causal direction.
- Not appropriate for directly calculating population risk because the case:control ratio is selected by the researchers.

What three criteria must a factor meet to be considered a confounder?
1. It is related to BOTH the exposure and the outcome.
2. It is distributed unequally between the study groups.
3. It is NOT an intermediary step in the causal pathway between exposure and outcome.
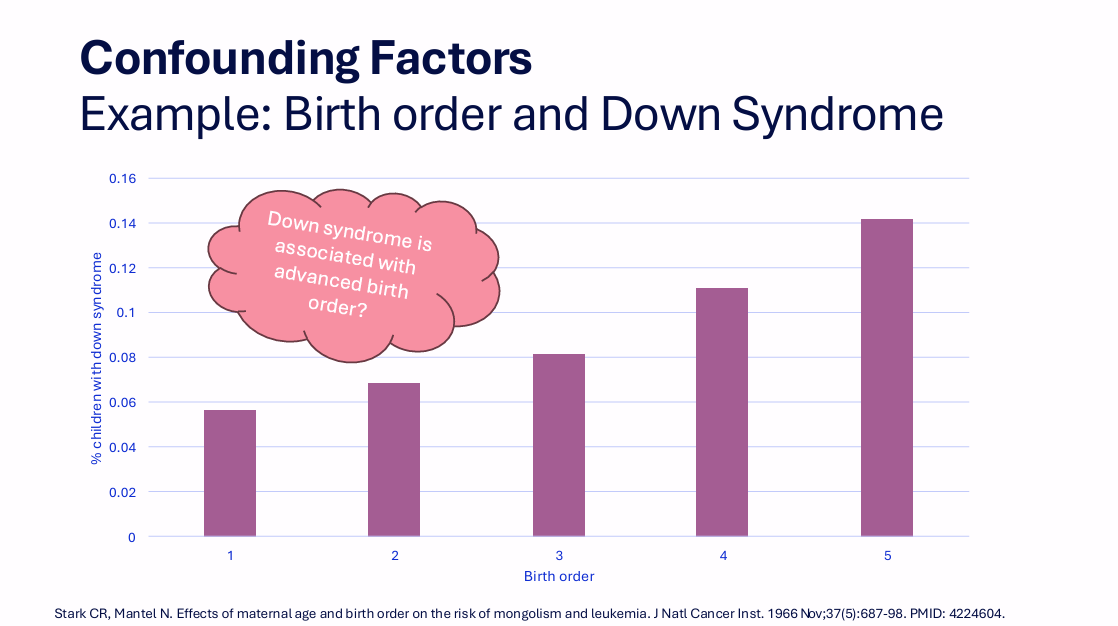
What apparent relationship was shown between birth order and Down syndrome?
The graph showed the percentage of children with Down syndrome increasing across birth orders 1 to 5.
This creates an apparent positive association:
Higher birth order → higher proportion of Down syndrome.
Lecturer explanation:
An association alone does not prove that birth order causes Down syndrome.
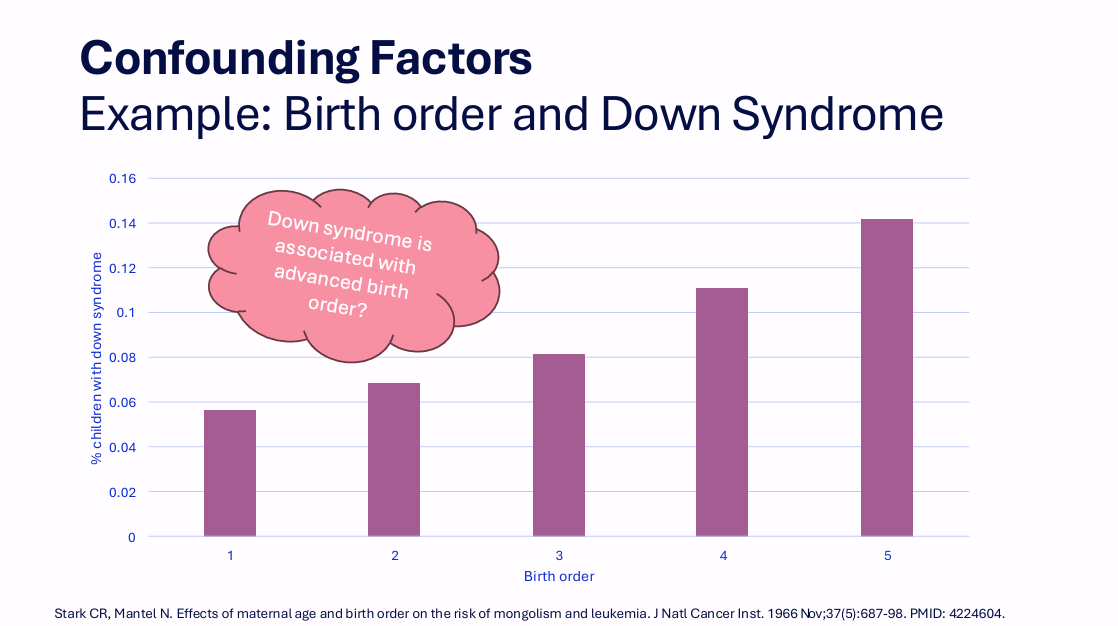

What causal explanation might be mistakenly proposed from the birth-order graph alone?
Proposed exposure:
Birth order.
Outcome:
Down syndrome.
A naïve interpretation could propose:
Higher birth order → increased risk of Down syndrome.
Lecturer explanation:
The purpose of the example is to test whether this apparent pathway is truly causal or explained by a third factor.


How is maternal age related to Down syndrome in the confounding example?
Increasing maternal age is associated with an increased occurrence of Down syndrome.
Lecturer explanation:
The biological mechanism includes age-related effects on chromosome segregation during formation of gametes.


How is maternal age related to birth order in the confounding example?
Increasing maternal age is associated with more advanced birth order.
Lecturer explanation:
Having several children takes time, so later-order births tend to occur at older maternal ages.
Therefore maternal age is related to the proposed exposure as well as the outcome.
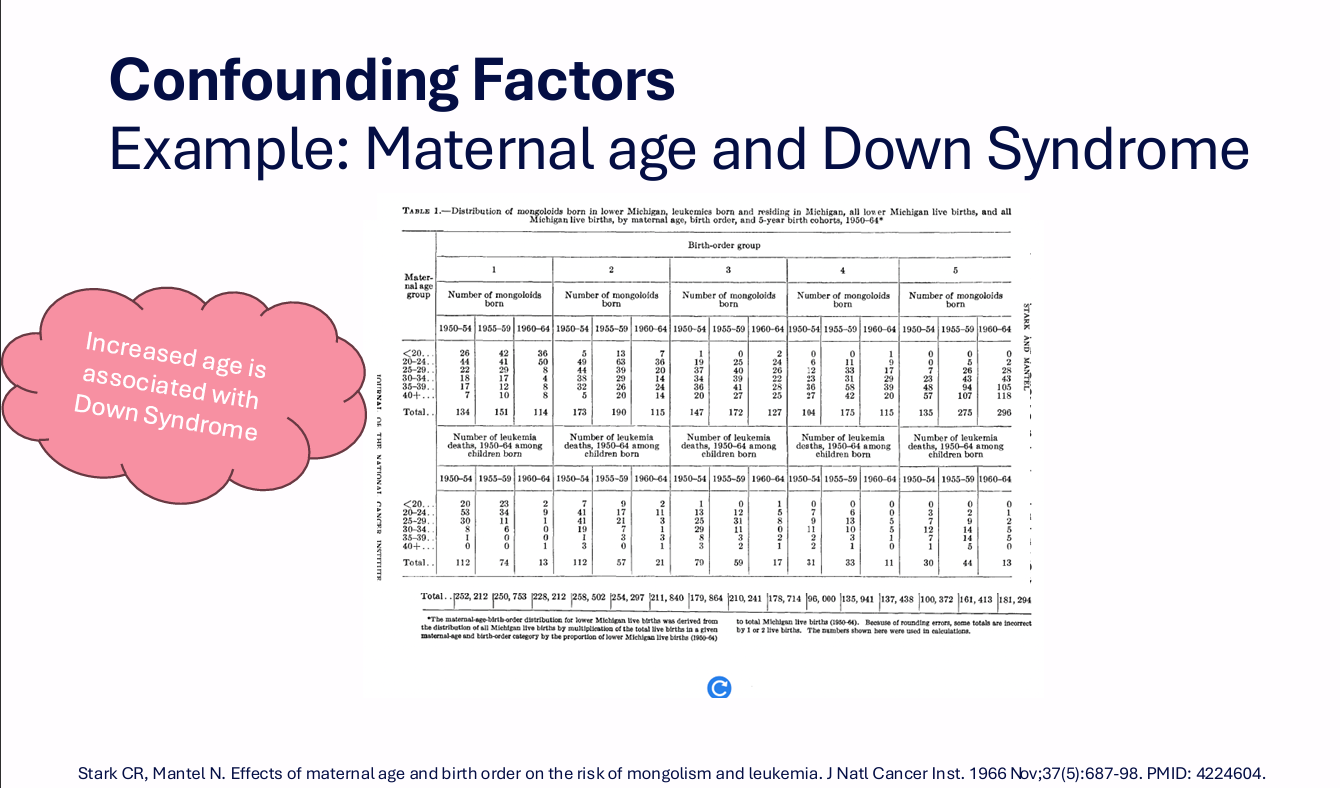
Which confounder criterion does maternal age satisfy because it is associated with both birth order and Down syndrome?
Criterion 1:
The confounder must be related to both the exposure and the outcome.
Maternal age:
- Related to birth order.
- Related to Down syndrome.
Therefore criterion 1 is satisfied.

Why is maternal age not an intermediary step in the proposed birth-order → Down syndrome causal pathway?
Maternal age is not caused by birth order as an intermediate step that then causes Down syndrome.
Instead, maternal age sits outside the proposed birth-order → Down syndrome pathway and is associated with both variables.
Therefore it satisfies confounder criterion 3:
It is not an intermediary step in the causal pathway.

What additional requirement did the lecturer emphasise for calling something a true confounder?
A mechanism should be identified.
Lecturer emphasis:
A variable should not be called a true confounder merely because it is statistically associated with exposure and outcome. A plausible/identified mechanism linking the factor to the relevant variables is important.

How does relative risk use exposed and non-exposed outcome groups?
Relative risk compares the risk of outcome in exposed versus non-exposed groups.
The four categories are:
- Exposed + outcome.
- Exposed + no outcome.
- Not exposed + outcome.
- Not exposed + no outcome.


How can a true confounder distort an observed relative risk?
A true confounder is associated with both exposure and outcome.
Lecturer explanation:
It can disproportionately alter one part of the exposed/non-exposed outcome table, changing the calculated relative risk even when that change is not caused by the exposure itself.
This creates a confounding pathway in addition to the proposed causal pathway.

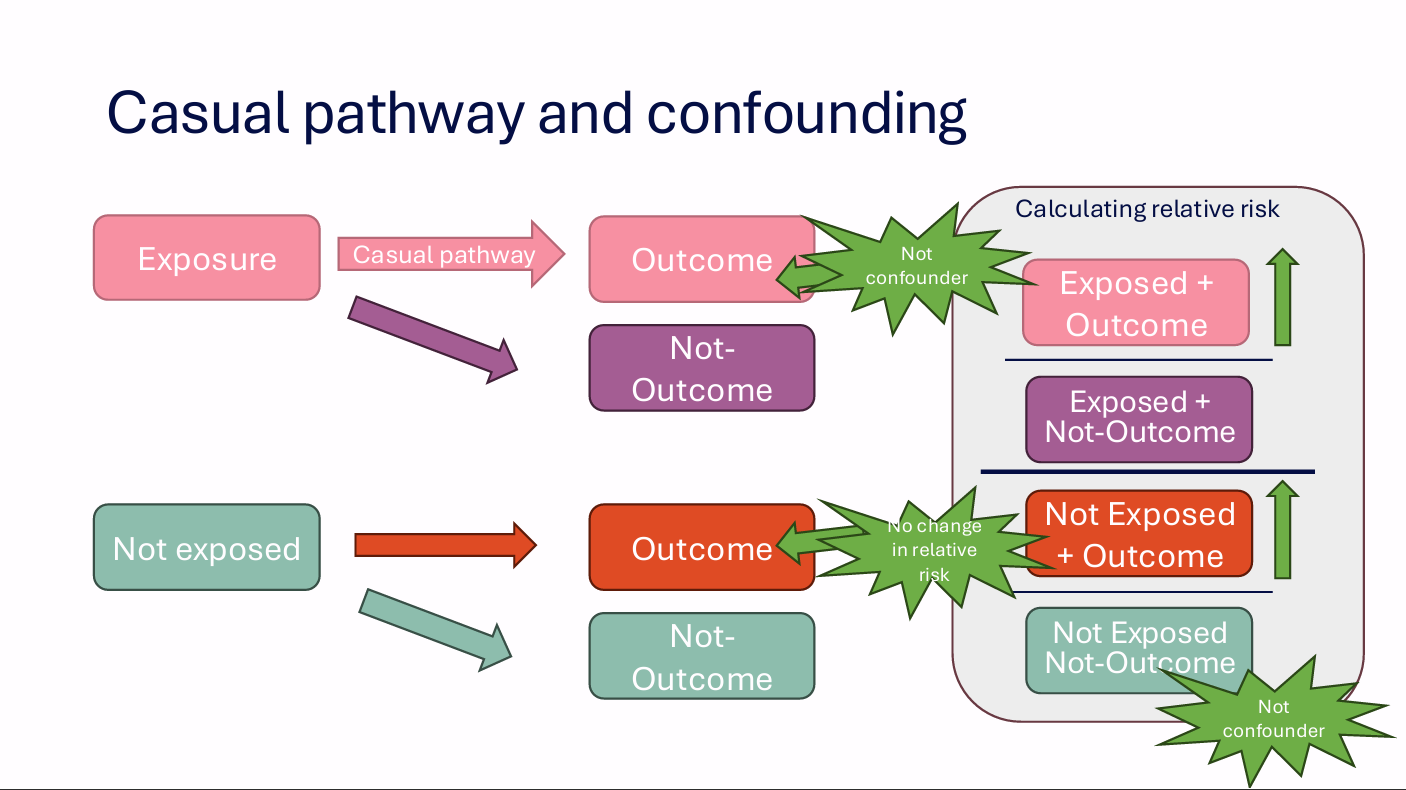
Why is a factor associated only with the outcome not necessarily a confounder?
A confounder must be associated with BOTH exposure and outcome.
.
Lecturer explanation:
If a factor affects the outcome similarly among exposed and non-exposed groups, corresponding parts of the relative-risk calculation change in proportion, so the relative comparison may not change.
Therefore:
Association with the outcome alone is insufficient.
.
value of fraction doesnt change


What did stratifying the birth-order data by maternal age reveal?
The original study examined Down syndrome frequency across both:
- Maternal age.
- Birth order.
.
Once maternal age was taken into account, the apparent birth-order effect was explained by maternal age.
The table includes:
- Maternal age.
- Birth order.
- Crude estimates.
- Adjusted estimates.

Why does maternal age satisfy all three confounder criteria in the birth-order/Down syndrome example?
1. Related to exposure and outcome:
YES — maternal age is related to both birth order and Down syndrome.
.
2. Unequally distributed between groups:
YES — advanced maternal age is not evenly distributed across birth-order groups.
.
3. Not an intermediary step:
YES — maternal age is outside the proposed birth order → Down syndrome causal pathway.
.
Conclusion:
Maternal age is the confounder explaining the apparent birth-order association.

What variables were represented in the causal-diagram example of statins and cardiovascular disease?
E:
Statin therapy exposure.
1 = yes, 0 = no.
.
D:
Cardiovascular disease outcome.
1 = yes, 0 = no.
.
L:
Hypercholesterolaemia.
1 = yes, 0 = no.
.
S:
Whether the person in the source population was selected for the matched study.
1 = yes, 0 = no.
.
The example was a matched cohort study.


What do the three causal-diagram patterns show about whether L is a confounder?
Pattern 1 — L is a confounder:
L is associated with both exposure E and outcome D and is not simply an intermediate step.
.
Pattern 2 — L is not a confounder:
L may influence exposure E but does not independently influence outcome D.
.
Pattern 3 — L is associated with outcome but is not a confounder:
L influences D but is not associated with E.
.
Lecturer emphasis:
Being associated with only one side of the exposure-outcome relationship is not enough.


What did the lecturer say students needed to understand about causal diagrams?
Lecturer explanation:
The diagrams show how confounding can be represented mathematically/diagrammatically in more advanced epidemiological analysis.
Students were NOT expected to perform the complex statistical modelling; the key goal was to recognise the difference between:
- A true confounder.
- A factor linked only to exposure.
- A factor linked only to outcome.

How did the lecturer relate p-values and confidence intervals when answering a student question after Lecture 15?
Lecturer explanation:
P-values and confidence intervals are different ways of examining closely related information about overlap between distributions and whether a difference is compatible with the null/no-effect model.
.
For a confidence interval:
If the interval does not overlap the relevant no-effect value, this supports statistical significance.
The lecturer linked this idea to how much the group distributions overlap.
Why do larger samples and larger effect sizes generally increase statistical power?
Lecturer explanation:
- Larger samples make sampling distributions narrower/more precise, reducing overlap between groups when a real difference exists.
- Larger effect sizes move group distributions further apart.
- Less overlap makes a real difference easier to detect statistically.
What are the two learning outcomes for Lecture 16: Problems in Research?
1. Recognise and describe common problems in research.
2. Understand why PubPeer was developed and how it can be used to check research quality.
What 13 common problems in research were listed in the lecture?
1. Absence of a control group.
2. Intervention effect.
3. Restricted ranges.
4. Violating the independence of observations.
5. Unequal groups.
6. Use of small samples.
7. Over-interpreting non-significant results.
8. Over-interpreting significant results.
9. External validity issues.
10. Poor operational definition.
11. Mistaking correlation for causation.
12. Observation limitations.
13. Misconduct in research.
.
Lecturer explanation:
This was presented as a list of common examples, not an exhaustive list.
Why does a pre-test/post-test difference not prove that an intervention caused the change?
A simple design may include:
1. Pre-test measure.
2. Intervention.
3. Post-test measure.
.
A difference between pre-test and post-test could be caused by:
- The intervention.
- Another event occurring over time.
- An uncontrolled confounding variable.
Without a suitable control group, those explanations cannot be separated.

What makes a control group appropriate?
The control group should be as similar as possible to the experimental group at baseline.
Key principle:
The groups should begin from comparable starting points.
.
Slide message:
"Can't compare apples and oranges."

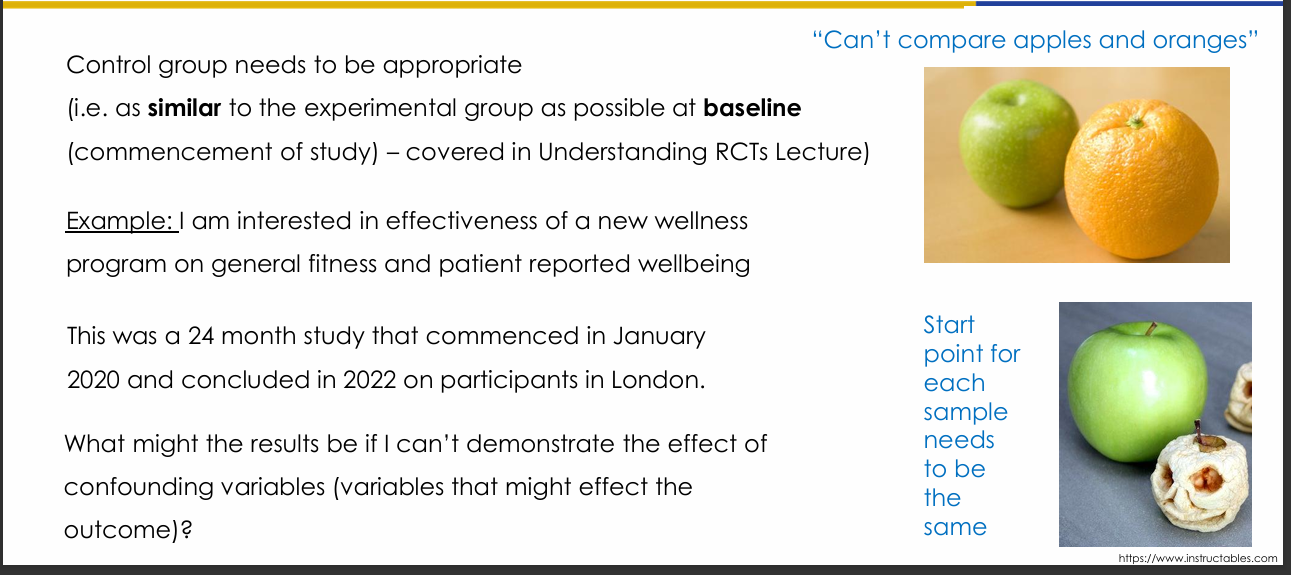
How did the 2020-2022 London wellness-programme example illustrate the need for a control group?
The hypothetical study tested a wellness programme over 24 months from January 2020 to 2022 in London.
.
Lecturer explanation:
COVID-19 lockdowns could independently worsen:
- Mental wellbeing.
- Fitness/activity.
.
If both the intervention and control groups worsened over the same period, that would suggest an external factor rather than the intervention alone caused the change.
A control group therefore helps identify effects of variables the researcher did not anticipate.

Why is a statistically significant group-level intervention effect not the same as benefit for every individual?
Group-level statistics describe the average/group effect.
.
They do NOT show that every participant:
- Improved.
- Improved by the same amount.
- Experienced a clinically important benefit.
.
Single-subject analysis requires the individual participant's pre-test and post-test scores and an allowance for measurement error.
What is the Reliable Change Index (RC) used for, and how was it expressed in the lecture?
Purpose:
To assess whether an individual participant's change is likely to exceed measurement error.
.
Lecture formula:
RC = (individual pre-test score − post-test score) / Standard Error of the difference (of all test takers)
.
Interpretation:
RC > 1.96 suggests the post-test result reflects a statistical change rather than measurement error.
.
Important:
An individual RC > 1.96 can be statistically significant without necessarily being clinically significant.

What is the problem with restricting the range of a variable?
Failure to sample across a sufficiently broad range can attenuate the observed correlation.
.
Consequence:
The sample relationship may underestimate or misrepresent the true population relationship.
.
A restricted range can hide:
- Plateaus.
- Curvilinear patterns.
- Reversals in direction.
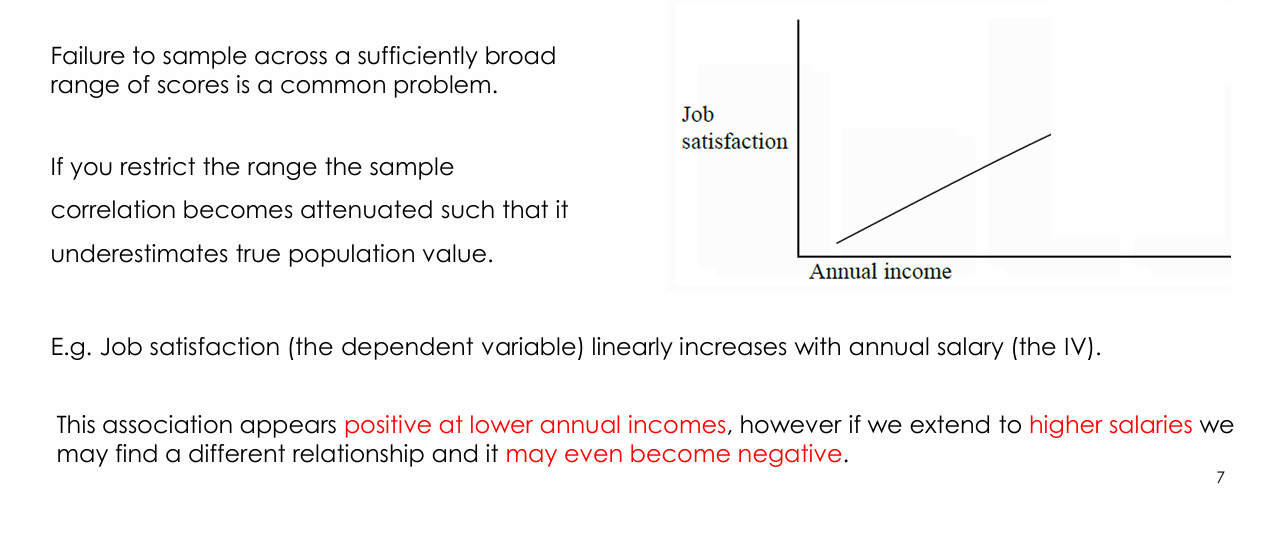

How did the annual-income/job-satisfaction example illustrate restricted-range bias?
At lower annual incomes:
Job satisfaction may appear to increase as income increases.
Lecturer explanation:
If only that range is sampled, the relationship may appear linearly positive.
At higher salaries:
The relationship may plateau or change, so the full population relationship could be different from the restricted-range result.


What is the Yerkes-Dodson relationship between anxiety/pressure and performance?
The Yerkes-Dodson law describes a curvilinear, inverted-U relationship.
- At lower levels, increasing anxiety/pressure can improve performance.
- Beyond an optimum/threshold, increasing anxiety impairs performance.
.
If only one part of the range were sampled:
The relationship could falsely appear purely positive or purely negative.

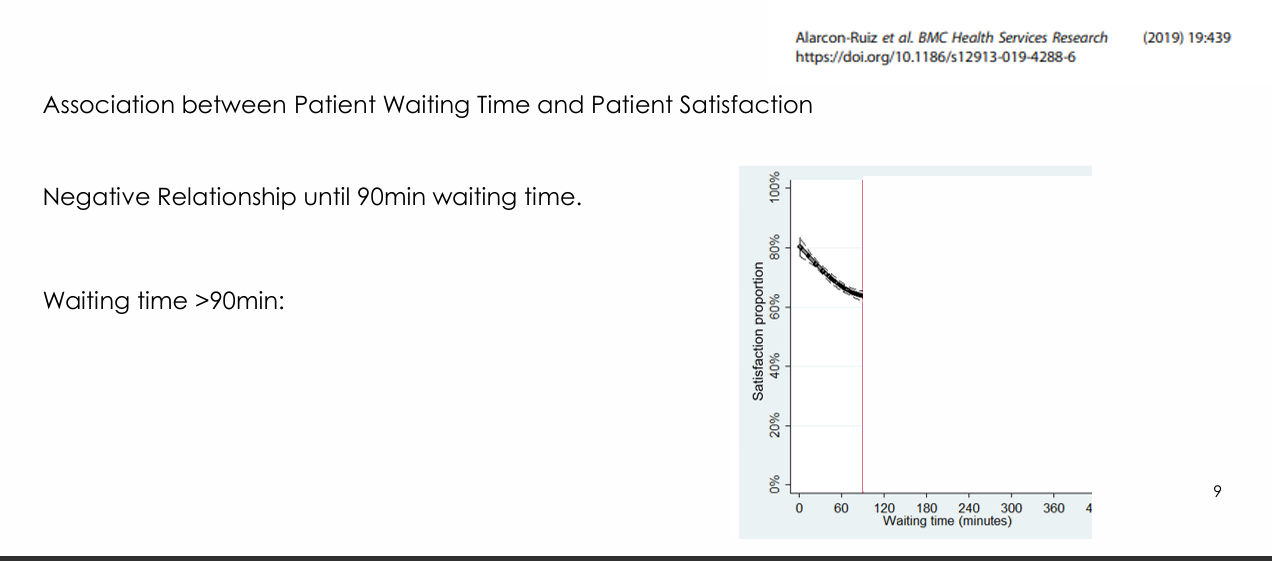
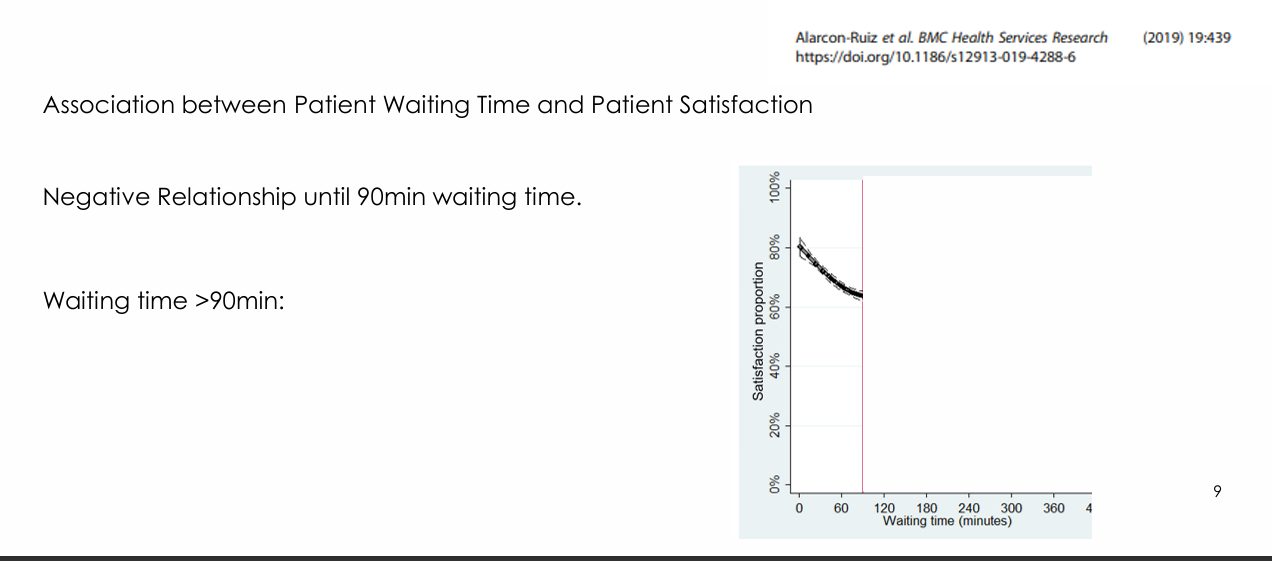
What did the patient waiting-time and satisfaction example show about restricted ranges?
The study showed:
- Satisfaction decreased as waiting time increased up to about 90 minutes.
- Beyond about 90 minutes, the relationship plateaued in that population.
.
Lecturer explanation:
Sampling only the earlier range would miss the plateau.
The lecturer also cautioned that the data were from a Peruvian population and may not automatically generalise to Australian patients.

What is the independence of observations assumption?
When inferential statistics are applied, each observation/data point should be statistically independent of the others.
.
One participant's response or measurement should not influence another participant's response or measurement.
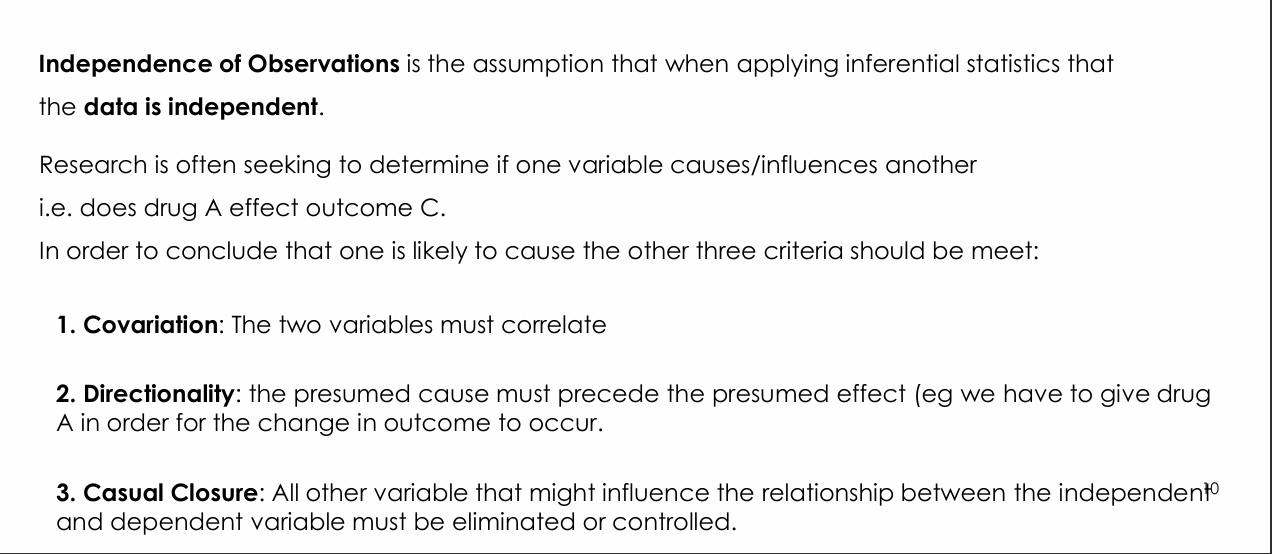

What three criteria did the lecture give for arguing that one variable is likely to cause another?
1. Covariation:
The two variables must correlate.
.
2. Directionality:
The presumed cause must occur before the presumed effect.
.
3. Causal closure:
Other variables that could explain the independent-variable/dependent-variable relationship must be eliminated or controlled.
.
Lecturer correction:
The intended term is "causal closure," not "casual closure."


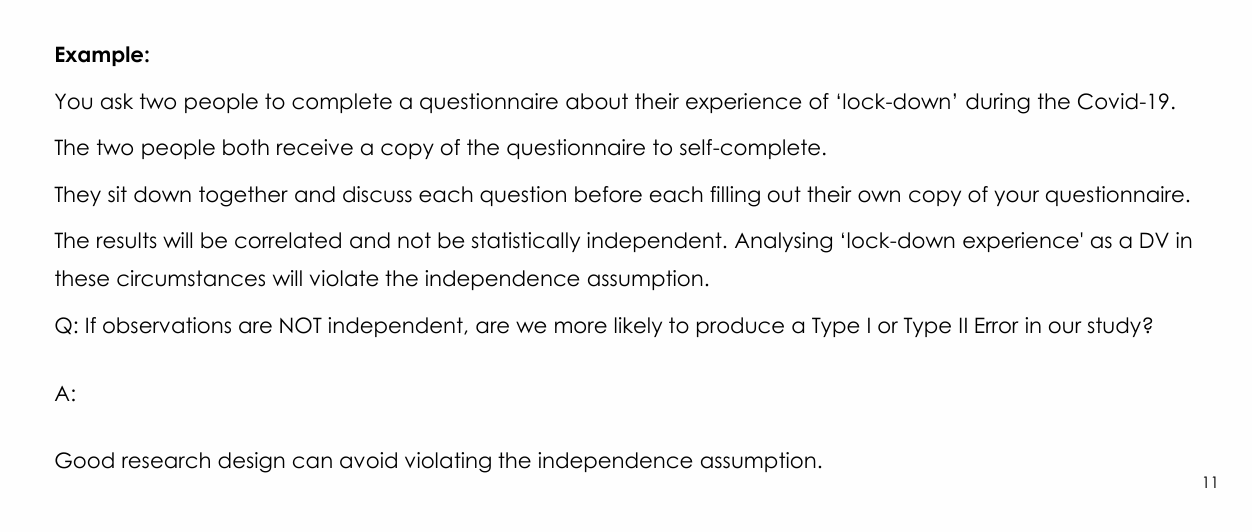
How does discussing answers together before completing separate questionnaires violate independence of observations?
If two participants discuss each question and then independently fill out their own forms, one participant can influence the other.
Their responses become correlated rather than independent.
.
Therefore:
Analysing those responses as independent observations violates the assumption.


If observations are not independent, which error did the lecturer say becomes more likely?
Type I error — a false positive.
Lecturer explanation:
Correlated responses can make an apparent effect look stronger or more consistent than it truly is, increasing the chance of detecting an effect that is not genuinely present.
Why is group equivalence important in research design?
Group equivalence helps satisfy causal closure by reducing alternative explanations for differences between groups.
.
If groups differ systematically at baseline on another variable, such as age or height, that variable could explain the outcome rather than the intervention.
What is the only method the slide described as actually achieving group equivalence?
Random allocation to groups.
.
Purpose:
To avoid systematic bias favouring one group over another.
.
Lecturer explanation:
Random allocation occurs AFTER participants have been selected, agreed to the study, and met inclusion/exclusion criteria.

What two matching approaches can approximate group equivalence?
1. Pairwise matching/randomisation.
2. Randomised block matching/allocation.
These approaches match or group participants according to important confounding variables, then use random assignment within the matched pair or block.


How does pairwise randomisation allocate participants?
1. Match each participant with the closest similar participant according to confounding variables such as age or gender.
2. Within each pair, randomly assign one person to treatment or control.
3. The matched partner goes to the other group.
.
Lecturer explanation:
The researcher matches participants but does not decide which member of the pair receives which group assignment.


How does randomised block allocation work?
1. Divide participants into subgroups/blocks of people who are similar on important confounding variables, such as age or gender.
2. Randomly assign participants within each block to treatment or control.

Why is a small sample size a research problem?
With a small sample:
- Researchers are more likely to detect only large effects.
- Genuine smaller effects may be missed.
- The risk of Type II error increases.
- The sample distribution is more likely to deviate from normality.
- There may be too little data to rigorously assess the normality assumption.
How should researchers determine the minimum sample size needed to detect an expected effect?
Use a statistical power calculation.
Lecturer explanation:
The required starting sample should also allow for expected:
- Drop-outs.
- Loss to follow-up.

Why is it wrong to interpret a non-significant p-value as proof of no effect?
With a usual significance threshold such as α = 0.05, a non-significant result can mean different things:
1. The effect is genuinely absent.
2. The study was not sensitive enough to detect it.
.
Possible reasons for insensitivity include:
- Low statistical power.
- Poor/inappropriate experimental design.
- Insensitive measurement tools.
- Calibration or other methodological problems.
.
Therefore:
The defensible statement is that the result was not statistically significant — not that no effect exists.


Why did the lecturer caution against treating p = 0.049 and p = 0.051 as fundamentally different results?
Lecturer explanation:
Values immediately on opposite sides of α = 0.05 are numerically very close.
The statistical-significance threshold is a decision rule, so researchers should examine the actual p-value and the wider evidence rather than treating "significant" and "non-significant" as completely different realities.


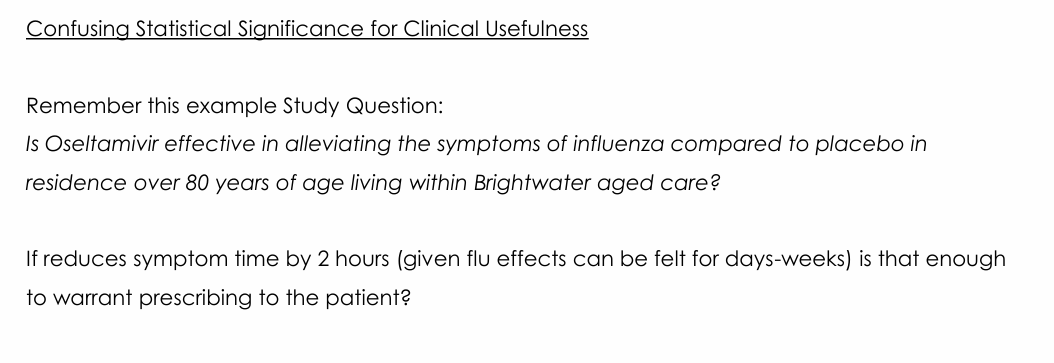
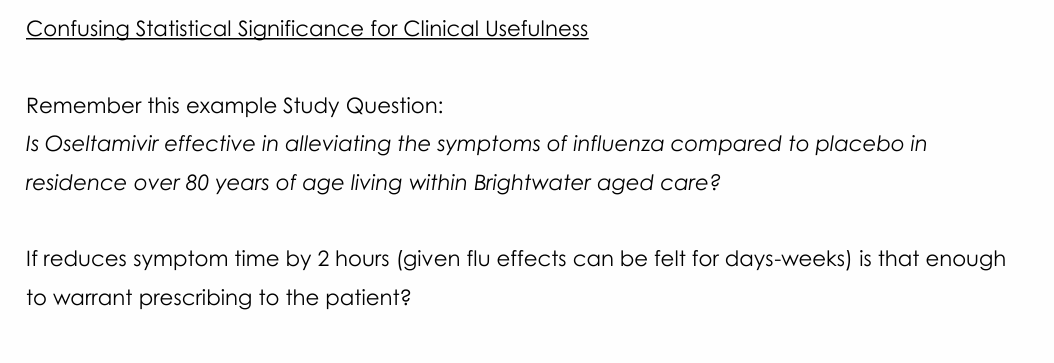
Why can a statistically significant result still lack clinical usefulness?
Statistical significance only indicates that an observed effect is unlikely under the null model at the chosen threshold.
Clinical usefulness asks whether the size and consequence of the effect matter in practice.
Example:
If oseltamivir shortens an illness lasting days to weeks by only about 2 hours, the change may be statistically significant but may not be worthwhile for every patient.
How did the lecturer connect clinical usefulness with patient-centred care?
Lecturer explanation:
Clinical importance is not always a single universal threshold.
.
An effect that seems small may still matter to a particular patient depending on:
- Their preferences.
- Their needs.
- Their willingness to accept cost or burden.
The patient's values should therefore be considered when judging whether an effect is useful.

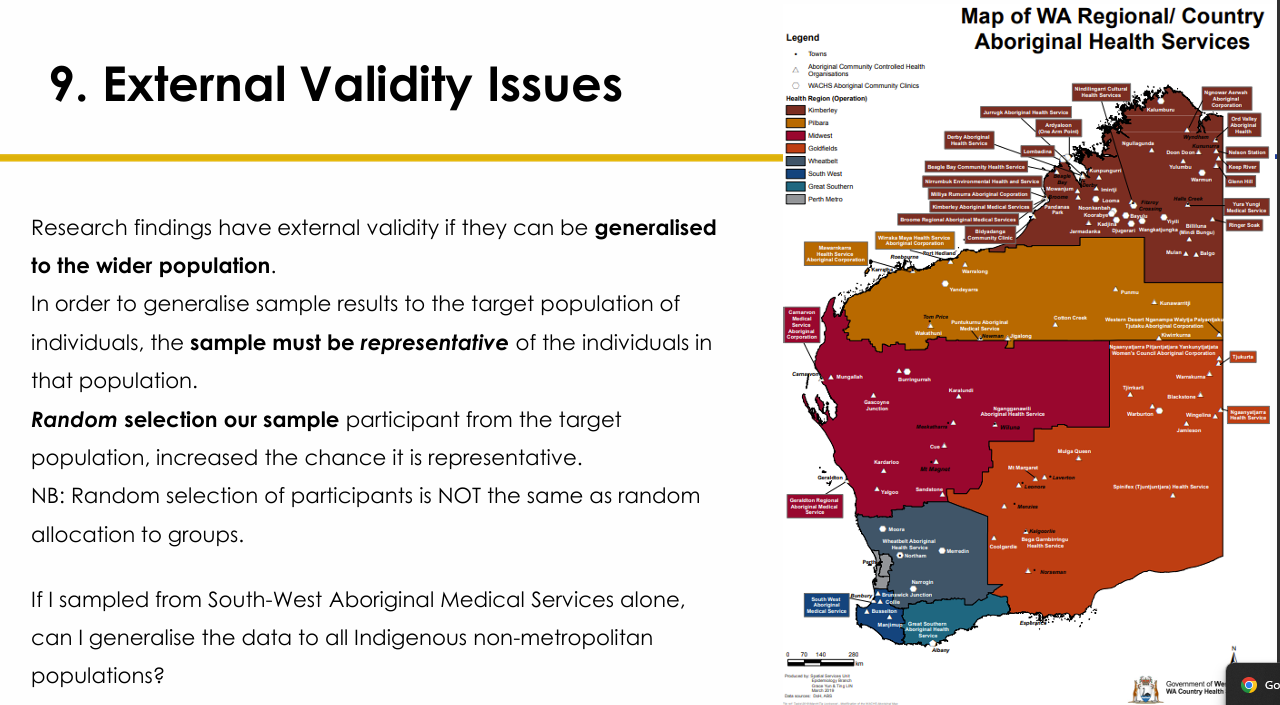
What is external validity?
External validity is the extent to which research findings can be generalised to the wider target population.
.
For good external validity:
The sample should be representative of the target population.

What is the difference between random selection and random allocation?
Random selection:
Selecting participants from the target population to increase representativeness and external validity.
.
Random allocation:
Assigning already-selected study participants to groups to improve group equivalence and reduce systematic baseline differences.
They are NOT the same process.

Why may a sample from only one WA region have limited external validity?
The lecture used regional Western Australia as an example.
A sample from South-West Aboriginal Medical Services alone may not represent all Indigenous non-metropolitan populations.
Lecturer explanation:
Conditions, communities and characteristics in areas such as the Great Southern may differ from those in the Pilbara, so generalising from a limited regional sample can be inappropriate.

What is an operational definition?
A clear, concise and detailed definition of how data or variables are collected and measured.
A good operational definition improves:
- Credibility of the methodology.
- Replicability of the study.
What methodological details did the lecturer say could matter in an insulin-pump study of blood glucose control?
Examples included:
- Time since the participant's last meal.
- Amount and type of food eaten.
- Participant inclusion and exclusion criteria.
- Whether participants have diabetes.
- Type of diabetes.
- Duration of diabetes.
- Exactly how glucose is measured.
- Who performs the measurement.
- Whether data are self-reported.
- The device and test strips used.
.
Lecturer emphasis:
The methods should be detailed enough that another researcher could replicate the study.

Why does correlation or association not automatically imply causation?
Two variables can correlate without one causing the other.
The lecture used a spurious-correlation example involving:
- Letters in the winning word of the Scripps National Spelling Bee.
- Number of people killed by venomous spiders.
A strong-looking relationship can occur without a credible causal mechanism.

How can modern large biobanks and Mendelian randomisation contribute to causal inference from observational data?
Large biobanks can contain data from more than 500,000 people, including:
- Genetic information.
- Phenotypic expression/presentation.
.
The lecture described Mendelian randomisation as an epidemiological approach that:
- Attempts to control confounding in observational data.
- Indirectly estimates causal effects from gene-exposure and gene-outcome associations.
This can strengthen causal inference when an RCT is impossible or inappropriate.
What limitation of traditional sleep studies can newer wearable technology help overcome?
Traditional sleep research may be limited by:
- Short periods of intensive monitoring.
- Intrusive laboratory measurement.
- Self-reported sleep data.
.
Wearables can provide:
- Long-term monitoring.
- Objective observations.
- Measurements in normal home environments.

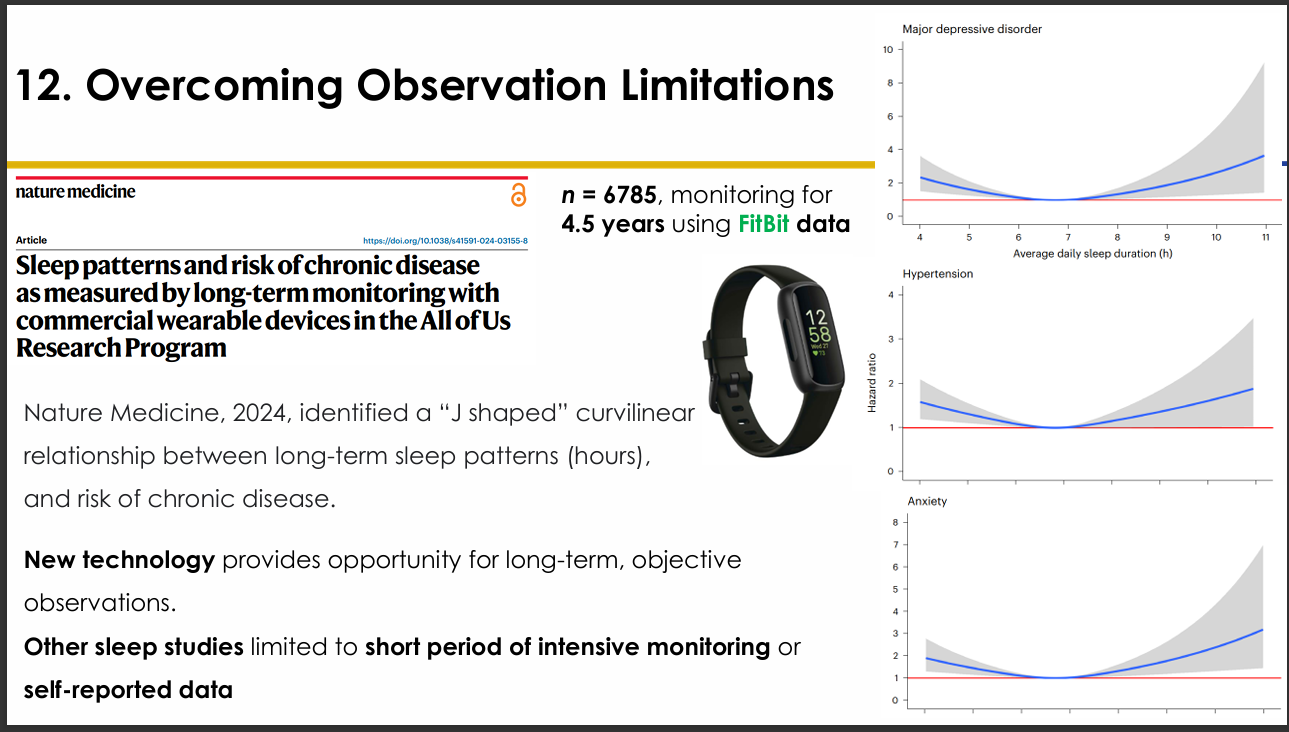
What did the long-term Fitbit sleep study report?
Study features:
- n = 6,785.
- Monitoring for about 4.5 years.
- Commercial wearable/Fitbit data.
.
Finding:
A J-shaped curvilinear relationship between long-term sleep duration and risk of chronic disease.
Figures included outcomes such as:
- Major depressive disorder.
- Hypertension.
- Anxiety.
.
Lecturer explanation:
Risk was higher with too little sleep and also rose again with longer sleep duration; around 7 hours was near the lower-risk region for several outcomes.
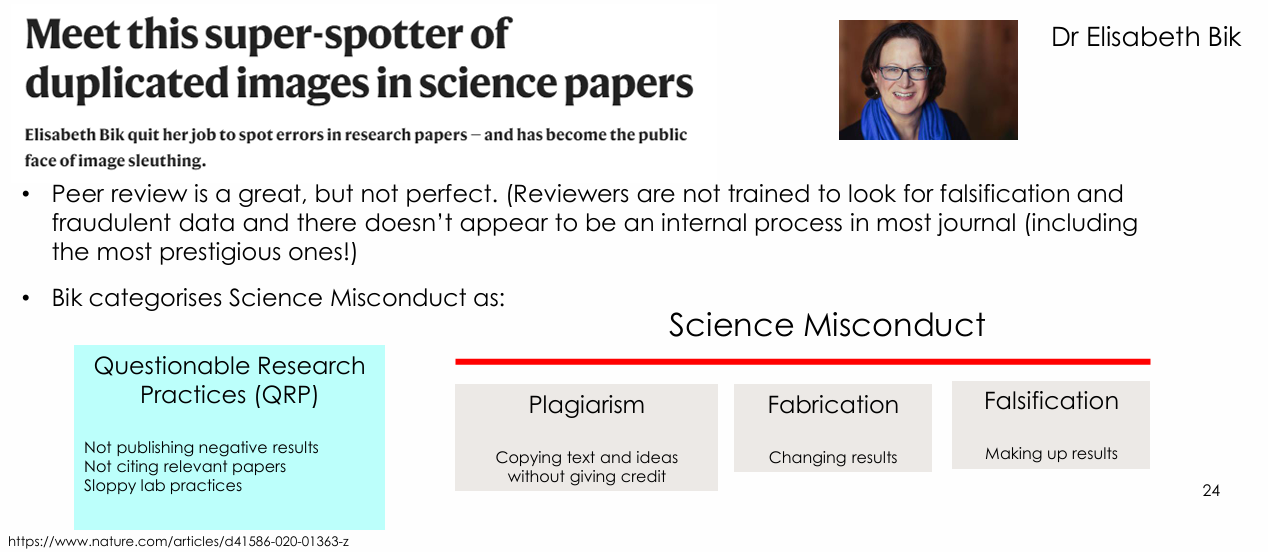
Why did the lecturer say peer review does not guarantee that published research is free from misconduct?
Peer review is useful but imperfect.
The lecture stated that reviewers are generally not specifically trained to detect:
- Falsification.
- Fraudulent data.
- Manipulated images.
Many journals also may not have strong internal processes for detecting these problems, including prestigious journals.

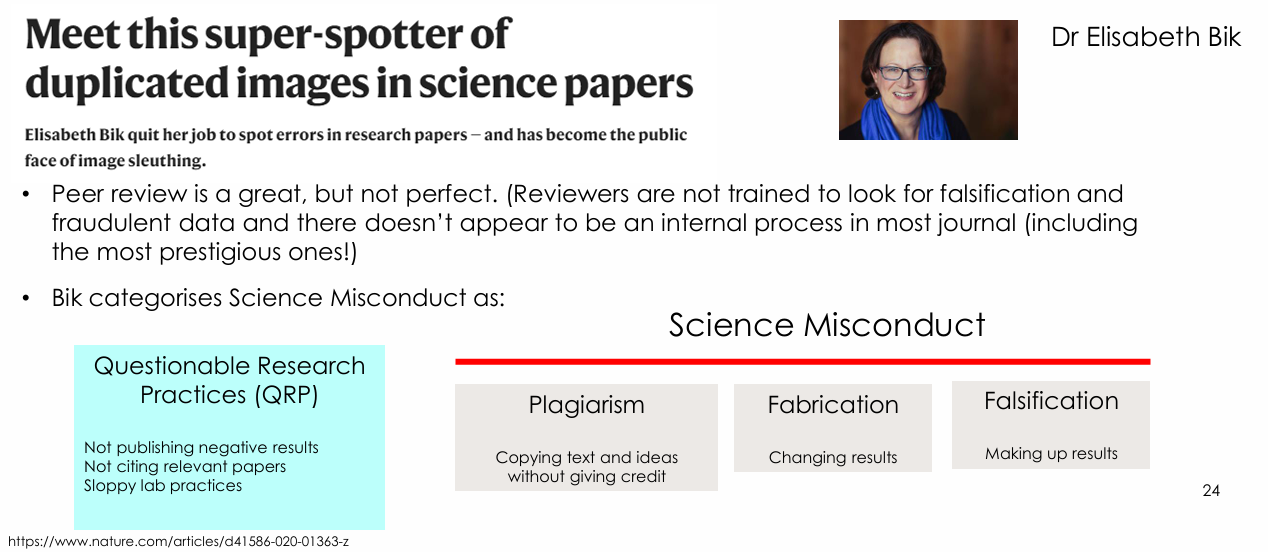
What categories of questionable practice and research misconduct were presented using Elisabeth Bik's framework?
Questionable Research Practices (QRP):
- Not publishing negative results.
- Not citing relevant papers.
- Sloppy laboratory practices.
.
Plagiarism:
- Copying text or ideas without giving credit.
.
Fabrication:
- Making up results/data.
.
Falsification:
- Changing/manipulating results.


What should you look for when inspecting western blots for possible image falsification?
Each lane should represent an independent experimental condition.
Possible warning signs:
- Identical bands repeated across lanes.
- Bands that look copied, stretched, shrunk or otherwise modified.
- Matching small artefacts appearing in supposedly independent lanes.
.
Lecturer explanation:
Copying and reusing the same result to represent different experiments is falsification.


What should you look for when inspecting tissue-culture image panels for possible manipulation?
The panels are supposed to represent different plates/conditions.
Look for:
- Repeated identical regions.
- Duplicated cells or structures.
- Cropped or transformed copies reused across panels.
- Matching artefacts in supposedly independent images.


Why is the prevalence of research misconduct difficult to estimate accurately?
It is impossible to know the true prevalence because:
- Undetected misconduct is not counted.
- Detection methods change over time.
- Journals may not always respond or retract problematic work.
- New technologies can make both manipulation and detection easier or harder.


Why did altered/duplicated scientific images become more commonly detected after the turn of the century?
Lecturer explanation:
The rise of digital image-editing tools such as Adobe Photoshop made image manipulation much easier.
.
Current concern:
Generative AI creates an additional challenge because entirely new scientific-looking images may be generated rather than merely edited.

What outcomes can follow when research misconduct is identified?
Possible outcomes mentioned in the lecture:
- Retraction.
- Authors allowed to resubmit/correct.
- No action.
.
Lecturer emphasis:
Some journals historically failed to respond even when concerns were raised, which is one reason independent post-publication discussion tools are useful.
Why might researchers commit misconduct?
Lecturer explanation:
Possible pressures include:
- Career advancement.
- Need for publications.
- Competition for grant funding.
- Pressure to keep a research laboratory financially viable.
- Pressure on students or staff to produce expected results.
- Limited samples, cells, time or resources that make repeating experiments difficult.
.
These pressures do not justify misconduct but can help explain why it occurs.

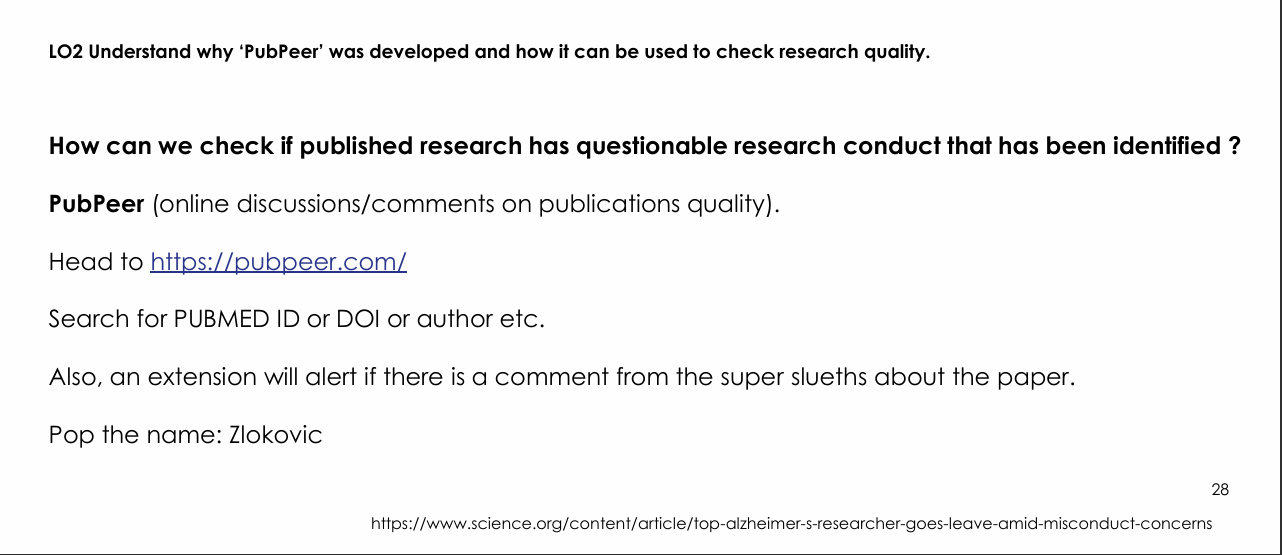
What is PubPeer and how can it be used to check research quality?
PubPeer is an online platform for discussion/comments about published research quality.
You can search by:
- PMID/PubMed ID.
- DOI.
- Author.
A browser extension can alert the reader when a paper has PubPeer comments.
.
Purpose:
To identify post-publication concerns that may not be obvious from the journal article itself.
What caution should be applied when using PubPeer comments?
Lecturer explanation:
PubPeer can alert readers to concerns raised by other researchers or image sleuths, but the comments still need to be evaluated critically rather than automatically treated as proof of misconduct.

What example did the lecturer give of why checking post-publication concerns can matter?
The lecturer suggested searching PubPeer for the Alzheimer's/stroke researcher Zlokovic.
Lecturer explanation:
A prominent researcher can influence an entire field. If widely cited publications contain misconduct, other researchers may spend substantial time and money pursuing misleading findings.

Q1: If two study participants discuss their answers while completing independent questionnaires for a research study, which assumption has been violated?
Correct answer:
Independence of observations.
Why:
Participants' responses can influence each other, so the observations are no longer statistically independent.
Lecturer explanation:
This can increase the chance of a Type I/false-positive error.
Q2: A study uses 10 participants per group to investigate a treatment effect. Compared with a larger sample, a small sample size is more likely to:
Correct answer:
Increase the likelihood of a Type II error — failing to detect an effect that may actually be present.
Why:
Small samples have lower power for detecting smaller real effects.
Q3: What is the purpose of an operational definition?
Correct answer:
To clearly describe how variables are measured and how data are collected.
Why:
A good operational definition makes the methodology credible and allows other researchers to repeat the study as closely as possible.
Q4. A researcher concludes that because p = 0.08, the treatment has no effect.
This interpretation is:
A. Incorrect because non-significant findings are inconclusive
B. Correct because p > 0.05
C. Correct because the null hypothesis has been proven
D. Appropriate when the sample size is small
Correct answer:
A. Incorrect because non-significant findings are inconclusive.
Why it is correct:
A non-significant result can mean either that the effect is absent or that the study lacked the sensitivity/power to detect it.
Why the other options are incorrect:
B. p > 0.05 means the result is not statistically significant; it does not prove no effect.
C. A non-significant result does not prove the null hypothesis.
D. A small sample actually makes failure to detect a real effect more likely.
Q5. Which statement best describes external validity?
A. The ability to detect a clinically meaningful significant effect
B. The reliability of measurements
C. The extent to which findings can be generalised to the wider population
D. The degree of statistical power and likelihood a statistically significant effect will be found should it exist
Correct answer:
C. The extent to which findings can be generalised to the wider population.
Why it is correct:
External validity concerns generalisability beyond the study sample.
Why the other options are incorrect:
A. This refers to clinical importance/detectability, not external validity.
B. Measurement reliability is a different methodological property.
D. This describes statistical power.
Q6. Which of the following represents research misconduct?
A. Reporting a negative result
B. Using non-random allocation
C. Fabricating data that were never collected
D. Not publishing non-statistical results
Correct answer:
C. Fabricating data that were never collected.
Why it is correct:
Fabrication means making up results/data.
Why the other options are incorrect:
A. Reporting a negative result is not misconduct.
B. Non-random allocation may be a weaker design choice but is not itself fabrication/falsification/plagiarism.
D. The lecture discussed failure to publish negative results as a questionable research practice, not the same category as fabrication.