ecology exam 2
 Call Kai
 Learn
 Practice Test
 Spaced Repetition
 Match
 Flashcards
 Knowt Play
1/19

There's no tags or description
Looks like no tags are added yet.
Name | Mastery | Learn | Test | Matching | Spaced | Call with Kai | Chat |
|---|
No analytics yet
Send a link to your students to track their progress
20 Terms
define interspecific competition and explain its types and mechanisms
-interspecific competition = between diff species for same resources
types:
-exploitative competition: indirect,
1) consumptive = consuming resource so none left for others (ex: two herbivore species grazing same grassland, plants competing for soil nitrogen or water)
2) pre-emptive = getting to resource before another (barnacles settling on rocky intertidal surface, once a patch is occupied by one barnacle, no other larva can settle there)
-interference competition: direct,
1) overgrowth = shielding rival from light needed to grow (vines growing over shrubs)
2) poisoning a rival
3) defending = territorial protection from rivals
4) encounter = directly fighting a rival
define fundamental and realized niche
-fundamental niche = set of environmental conditions under which a species can survive and reproduce
-realized niche = set of environmental conditions that a species occupies at a given time because of limiting factors
ex: chthamalus’ realized niche is smaller and further up shore than balanus (overgrowth since balanus directly displacing chthamalus, growing over and against them)
explain competitive exclusion principle and how we depict it graphically
-competitive exclusion principle: species who are complete competitors (niches overlap completely) cannot coexist indefinitely
interpret case studies of close competitors and factors that can promote coexistence
close competitors shaped by:
1) non-resource factors
2) environmental variability (time): h. contortus does better during rainier years, to ensure coexistence, drier years need to be often enough to prevent urochloa mosambicensis from dying out
3) multiple resources: two plants, one better competitor for one resource, other for another → as environmental conditions change, the relative competitive advantage of species can change because each species' performance can be a function of the environment
4) environmental gradients (space): diff trout species have increased food intake at diff temps (higher elevation = colder stream) creek chub at high temps
5) niche partitioning (evolutionary process, competing species adapt to using diff resources, occupy diff areas, or feed at diff times, ex: brown anoles perch lower than crested anoles when living together) & character displacement (shift in species’ morphology behavior, or physiology in response to competition, ex: anole limb length changes): coexistence can occur from niche partitioning → character displacement
define and explain the biological meaning of each parameter in the lotka-volterra competition equations (r, k, α, β, & how they relate to competitive interactions between species)
dN1/dt = rN1((k1-N1-αN2)/k1)
dN2/dt = rN2((k2-N2-βN1)/k2)
<3: population growth under exponential growth
<3: intraspecific competition
<3: interspecific competition
r: per capita intrinsic growth rate
N: # individuals in population
k: carrying capacity
competition coefficients:
α: each individual of species 2 feels like α of own species 1 individuals in terms of resource competition, higher α → species 2 stronger
β: each individual of species 1 feels like β of own species 2 individuals in terms of resource competition, higher β → species 1 stronger

construct and interpret isoclines from lotka-volterra parameters to predict competition outcomes (coexistence and competitive exclusion)
-isoclines: lines where populations neither grow nor shrink, zero net isocline gain (zngi)
-competition-driven carrying capacity: (k2/β, on same axis as k1) (k1/α, on same axis as k2)
competitive exclusion:
-if combo of two species’ population sizes is above both carrying capacities, population of each will decrease
-if combo of two species’ population sizes is below both carrying capacities, population of each will increase
….what happens when it gets in the middle of the two isoclines? if species 1 wins & competitively excludes species 2, aka k1 > k2/β:
N1 will increase & N2 will decrease until N2=0 (*reverse if isoclines switched*)
coexistence:
-isoclines intersect
-stable equilibrium & stable coexistence: (k2/β > k1 and k1/α > k2), all arrows converge on same point, intraspecific > interspecific
-unstable equilibrium: (k1 > k2/β and k2 > k1/α), either species 1 or 2 wins depending on starting point side, interspecific > intraspecific

apply the lotka-volterra model concepts to real-world competition scenarios by manipulating parameters and connecting model predictions to ecological examples
-invasive asian tiger mosquito and native treehole mosquito
define consumptive and non-consumptive effects of predation, using examples to support your understanding
-consumptive: predators kill prey, consistently limiting size of prey populations (non-native spiders introduced to islands w/ and w/o lizards → across many years, pop.size of spiders w/o lizards substantially larger)
-non-consumptive: prey pop. size is limited because of fear of predation (changes habitats, behaviors, or timing of activity, thus wasting time/energy), rather than predation itself (when tadpoles exposed to caged fish predator, lower mean prop. tadpoles surviving to metamorphosis) (snails “smell” crabs, forage for less resources, grow slower, reduce in pop. size)

use experimental data to explain population cycles with consumptive and non-consumptive effects
-predators & their prey often undergo regular cycles in population size, predators explains the intensity of the cyclic pattern
-lynx and hare populations cycle every 9-10 years, w/ changes in lynx population size lagging about 2 years behind changes in hare population size
-exclusion of predators increases the survival rate of hares
-the non-consumptive effects of high predation limit hare density even w/o direct consumption
-at high lynx densities, fear of predation reduces maternal success, causing reduced numbers of offspring and hare population declines
-at low lynx densities, hare fear reduces and reproduction rates increase
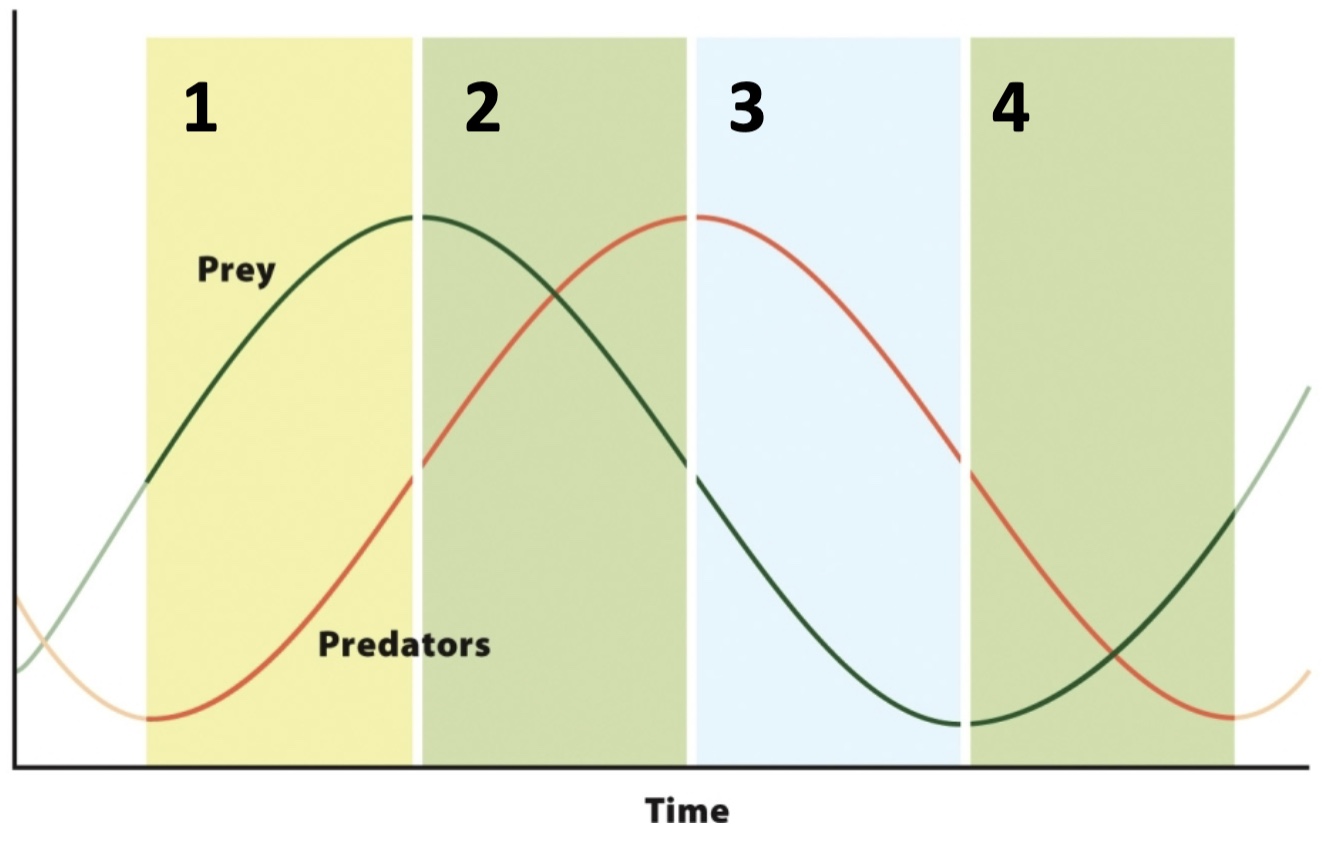
use predator and prey zero net growth isoclines to predict population growth patterns
-number of prey N and number of predators P
-predator isocline: N at which P stays constant
-prey isocline: P at which N stays constant

identify adaptations that enhance the role of predators or prey in their interspecific interactions (in connection w/ defense, hunting, or foraging risk)
increasing c:
1) search (finding prey):
-enhanced senses (owl ears, snake pits detecting heat, sharks sensing electrical fields & smelling blood from far away)
-habitat selection - hunting where prey are concentrated (watering holes)
-timing - matching activity to prey activity (nocturnal hunting or prey)
-cooperative scouting - group members covering more ground
2) capture (attack and kill):
-speed and agility (cheetah), ambush & stealth (sit and wait strats), weapons (claws, fangs, sharp jaws), venom, traps (spider webs), cooperative hunting
3) handling of prey (subduing & eating):
-specialized mouthparts and teeth (snake jaws unhinge to swallow prey, carnivore teeth for shearing flesh)
-digestive adaptations (enzymes, stomach acidity, digestive systems matching prey type)
-quick kills (neck bites, venom, suffocation), reduce risk of injury to predator
decreasing c:
-stinkbug volatile secretion, camo (walking stick), bright and distinctive color patterns (monarch butterfly and strawberry poision dart frog warn potential predators of toxicity), white-tailed deer → white tail patch → alarm and distraction, collective defense (elephants),
construct the basic lotka-volterra model, and explain the parameters and assumption
instantaneous rate of increase in prey (number added per unit time): dN/dt = rN-cNP
r = intrinsic growth rate of prey, per capita (max. B & D rates possible)
N = # prey
P = # predators
c = fraction of prey pop. caught by each predator (capture efficiency), ex: each fox eats about 1 out of 200 rabbits in the population (per unit of time), c = 1/200 or 0.005
cN = # prey eaten by single predator given a certain prey population size
cNP = total # prey eaten by all predators in given period of time
instantaneous rate of increase in predators (number added per unit time): dP/dt = bcNP - dP
N, c, & P = same as prey pop. eq
b = efficiency of converting 1 prey consumed to 1 predator offspring
d = mortality rate of predators, per capita
bcNP = total # of predator offspring produced
isoclines
predator: horizontal line, P’ = r/c
prey: vertical line, V’ = d/bc
construct two modifications to the L-V model that include prey
density dependence and predator functional response
-lv predator prey model assumes no competition
-relaxing assumption of exponential prey growth: dN/dt = rN(1-N/k)-cNP
DENSITY-DEPENDENCE
→ damped oscillations
-predator isocline changes: P’ = (r/c) (1-(V/k)), negative slope
-abundant prey → decrease in predators to offset growth bc intraspecific competition decreases prey numbers, damped oscillations (at high prey densities, density dependence has a stronger impact on prey population than predation)
PREDATOR FUNCTIONAL RESPONSE
3 functional responses: predators usually can’t just keep catching & eating prey
type 1) prey consumption continues increases with prey density (straight line)
type 2) rate of prey consumption declines as prey density increases (asymptote)
type 3) rate of prey consumption initially increases as prey density increases and then begins to decline (S-shaped)
-predator saturation:
P’ = (r(1+cVh)/cV, positive slope
-abundant prey → takes more predators to control prey growth, divergent oscillations (populations crash)
ALTOGETHER MORE REALISTIC PREY ISOCLINE, dV/dt = rV(1-(V/k))-(cV/(1+cVh)P:
-left: highly efficient predator, low # of prey maintain predator population → overexploitation: prey crash, then predator starves
-center: predator and prey cycle because isoclines intersect perpendicularly (same as classic lv model)
-right: inefficient predator, requires high # prey to maintain predator equilibrium, leads to damped oscillations
-paradox of enrichment: when resources promote greater prey k, predators can starve, predator isocline doesn’t shift, stable coexistence can convert to unstable scenario (adding fertilizer to enhance crop growth, pest isocline doesn’t shift, outbreak of pest, followed by crash)
describe the biology of parasite life cycles
parasite features:
-size: microparasites (viruses, bacteria, protists), macroparasites (flatworms, roundworms, lice, fleas, ticks, fungi, plants)
-externally (ectoparasites) or internally (endoparasites)
-transmission: direct (host to host) or indirect (3rd species, vector or intermediate host)
interpret parasite virulence effects and predict how they affect transmission
-parasites decrease clutch size (malaria infection in fence lizards, non-functional RBCs, carrying O2, decreases aerobic capacity to sustain energy)