ECN 21003 - L5 CA Determination
 Call Kai
 Learn
 Practice Test
 Spaced Repetition
 Match
 Flashcards
 Knowt Play
1/19

There's no tags or description
Looks like no tags are added yet.
20 Terms
What is the production function with investment?
A = Technology/productivity

What is the profit function?

At what point do firms invest up to?
MPK = marginal cost of capital (I)

What is the investment schedule?
As interest falls. investment increases

How does increased productivity change the investment schedule?
Investment schedule shifts outwards, at every rate firms want to invest more
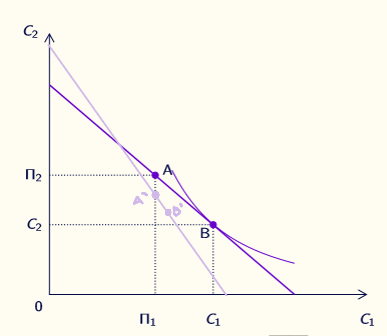
What is the inter-temporal budget constraint in a production economy?

How does an increase in productivity change consumption?
Increase in Productivity moves A to A'. Profit in period 1 increases.
This shifts the budget constraint out as income/output increases. New tangency is set at B'. C1 rises by less that profit. C2 increases

How does an anticipated shock in productivity in period 2 shock consumption?
Expected shock of productivity in period 2 increases A to A'. This increases period 2 profits. Budget constraint shifts out as income/output increases. New optimum point B' is formed. C1 and C2 both increase as people spend some of the increased profits in both periods.

How does an increase in interest rate affect consumption?
What is the savings schedule?
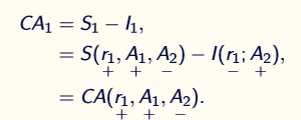
Savings = Output (based on productivity) - consumption (based on interest, productivity in P1, productivity in P2)
r₁ ↑ → C₁ ↓, so saving ↑.
A₂ ↑ → C₁ ↑, so saving ↓ (households borrow against future income).

What is the current account schedule?
What is the Meltzer diagram?

What happens where there is a temporary (period 1) increase in productivity?
Savings shifts outwards, CA improves

What happens where there is a expected (period 2) increase in productivity?
Investment shifts out, savings shifts in, CA deteriorates


Explain this?
Row 1: the world interest rate rises (r* ↑)
Open, S₁ ↑. A higher rate pays more for saving, so households postpone consumption (the saving schedule slopes upward). We move along the S schedule to the right.
Open, I₁ ↓. Capital now costs more to finance (1 + r* is higher). Firms invest until MPK = 1 + r*; because MPK falls as capital grows, a higher cost is reached at less capital. We move along the I schedule to the left.
Open, CA₁ ↑. CA = S − I: saving is up and investment is down, so the CA improves. This is the one case where a higher interest rate is involved, and in the open economy it improves the CA.
Closed, all "—". A closed economy has no access to the world capital market, so r* is irrelevant to it. Its rate is set by domestic S = I, and nothing domestic has changed.
Open, r₁ ↑. This is the shock itself: r₁ = r* has risen.
Row 2: a temporary rise in current productivity (A₁ ↑)
Open, S₁ ↑. Income rises by more than consumption (households smooth, so they spend only part of the windfall), so saving rises at every interest rate. The S schedule shifts right.
Open, I₁ —. Investment depends on future productivity A₂ and the interest rate. A₁ only boosts output today from capital that is already in place, so the I schedule doesn't move.
Open, CA₁ ↑. Saving up, investment unchanged, so S − I rises.
Open, r₁ —. Pinned at r*.
Closed, S₁ ↑. Same saving shift as above.
Closed, I₁ ↑ and r₁ ↓. With no foreign outlet, the extra saving must be invested at home (S = I). The extra supply of funds pushes the interest rate down, and a lower rate makes more investment projects worthwhile, so firms invest more (a movement along the I schedule). The result is a bigger capital stock, which has a lower MPK (diminishing returns), consistent with the lower rate.
Closed, CA₁ —. Always zero.
Row 3: an expected rise in future productivity (A₂ ↑)
Open, S₁ ↓. Households expect higher future income, so they consume more today. Current income is unchanged, so saving falls at every interest rate (the S schedule shifts left).
Open, I₁ ↑. Higher A₂ lifts the MPK curve, so at the same borrowing cost firms want more capital (the I schedule shifts right).
Open, CA₁ ↓. Saving down and investment up: a double hit to S − I. The country borrows from abroad to fund both.
Open, r₁ —. Pinned at r*; domestic news doesn't change the world rate.
Closed, r₁ ↑. At the old rate, firms want more funds (I up) and households want to save less (S down), so there is excess demand for funds. The interest rate is the price of funds, so it rises until S = I again.
Closed, S₁ ↑* and I₁ ↑*. The higher rate encourages saving and discourages investment, pulling both back toward each other, and they settle at the same new level. Whether that level is above or below the old one depends on which schedule shifted by more. The table shows "↑" assuming the investment shift is larger; the rate rise is the unambiguous result.
Closed, CA₁ —. Always zero.
What is the profit functions with terms of trade?

What is the investment schedule with terms of trade?

What is the consumption schedule with terms of trade?

What is the savings schedule with terms of trade?

What is the CA schedule with terms of trade?
