Finance for Marketing Decisions
 Call Kai
 Learn
 Practice Test
 Spaced Repetition
 Match
 Flashcards
 Knowt Play
1/29

Earn XP
Description and Tags
Prof GB
30 Terms
Why, Where and How to Get Financial Information
Using financial data enhances credibility
We can get financial data easily and for free
There are 5 main ways to get financial data:
Company’s Website
Edgar
Wall Street Journal
Brokers
Become a shareholder

Getting Financial Information from Company’s Website
Go to the company’s site
Scroll down to Investor Relations
Why do Firms Hire Contractors?
No headcount impact
No corporate approval required
Item is “hidden” on expenses
Much faster
Need to spend the budget before December 31st. It’s been a good year

Productivity
Productivity increases: producing more units, or selling more dollars, with the same or lower headcount
This increases productivity:
Training
Engagement
Automation, clear processes
This decreases productivity:
High rotation
Low Morale
Unclear, badly managed processes
Outsourcing & Offshoring
Outsourcing:
Who does the work - an external person or company, not an employee
Offshoring:
Where the work is done - in another country, by either a company’s own foreign staff or a third-party provider
Outsourcing & Offshoring (Chart)
Outsourcing:
Where: local or global (anywhere)
Who: an outside person (contractor/freelancer) or external company, not your employee. Contractors are hired for specific tasks and do not receive employee benefits
Example: Google employs over 130,000 contractors compared to 123,000 direct employees. They work in IT support, software testing, food service
Offshoring:
Where: another country
Who: own employees/outside company abroad
Example: Google laid off hundreds of US employees and moved engineering and IT positions to offices in India and Mexico

Severance
Severance: compensation and/or benefits employers pay to employees who are laid off, whose jobs are eliminated because of downsizing, or who are fired
In mny countries, it is mandatory and regulated by law
In the US, there is no requirement in the Fair Labor Standards Act (FLSA) for severance pay
What are 3 Main Sections of a P&L?
Sales
Cost of sales
Expenses
Sales - Cost - Expenses = Net Income
Using % of Sales as the Benchmark Ratio
Sales and Revenue are the same thing
Use “Net” Sales or Revenue if available
To calculate ratios, divide each line item by Net Sales or Net Revenue. This makes it easier to compare across competitors and make sense of numbers
For example, to calculate Cost of Sales as a percentage of Net Sales: Divide Cost of Sales by Net Sales


Net Sales or Net Revenue
Sales or Revenue: It’s the same
“Net” is important. It means after discounts and returns
It’s also referred as the “Top Line.” You will find it near the top on a P&L
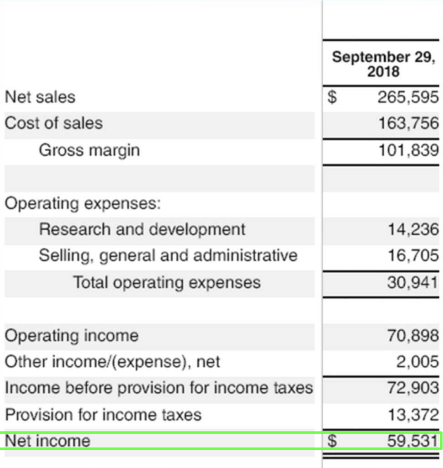
Net Income, Net Proft
Net Income, Net Profit: It’s the same
Net Income is the profitability, the amount of money we made after paying all expenses, taxes
It’s also referred as the Bottom Line, you will find it at the Bottom a P&L
Gross Profit & Gross Margin
Gross Profit: Net Sales minus Cost of Sales
Jenny = $1,000 - $300 = $700
Gross Margin: Gross profit as a %
Jenny = $700 / 1,000 = 70%
Jose’s Gross Profit
Airport Transfer: $100
Total Cost: $40
Gross Profit: $60
***Total Cost includes Mercedes-Benz lease, gasoline, insurance, maintenance, parking and airport fees
Jose’s Marginal Cost
Airport Transfer Price: $100
Maria’s Offer: $40
Jose’s Marginal Cost: $?
***Jose sells transfers to the airport for $100. His total cost (see previous slide is $40). Maria offers him $40 for the ride. What is the marginal cost of adding Maria to an empty seat?
How Would You Build a P&L?
Sales
Cost of Sales
Expenses
Sales - Cost - Expenses = Net Income
EBITDA
EBITDA or Earnings Before Interest, Tax, Depreciation, & Amortization
Example:
Jenny made $2,700. If she was to pay income taxes, that would be reduced by 20% and her Net Income would be $2,160
Her earnings before tax, however, would still be $2,700. She doesn’t pay interest, depreciation or amortization
What is a Balance Sheet?
A balance sheet is a statement summarizing what we own (assets), what we owe (liabilities), and what we invested (our capital or equity)
Assets = Liabilities + Equity
How to Read Any BS. The Main 5 Business Drivers
Receivables
Inventory
Property, Plant & Equipment
Payables
Debt
Jenny’s BS. Monday. Payables (A Liability)
Once per month, after taking the Finance for Marketing decisions class, Jenny goes to Newark Airport and gets on an Emirates flight to China
***Selling, General & Administrative (S&GA expenses). Travel is included there for expenses not related to manufacturing

Impact on Cash
Reduces Cash:
Receivables
Inventory
Property, Plant & Equipment
Maintains/Increases Cash:
Payables
Debt
Scenarios 1 & 2. Business is Successful (Borrow $15K from Bank, Sell All 50 Pairs - Equity Investor $15K, Sells All 50 Pairs)
In a good situation, go with the bank not the equity investor

Scenarios 3 & 4. Business Fails (Borrows $15K from Bank, Sells 10 Pairs - $15K from Investor, Sells 10 Pairs)
In a bad situation, it is better to go with equity not a bank

Inflation & Salary Increases
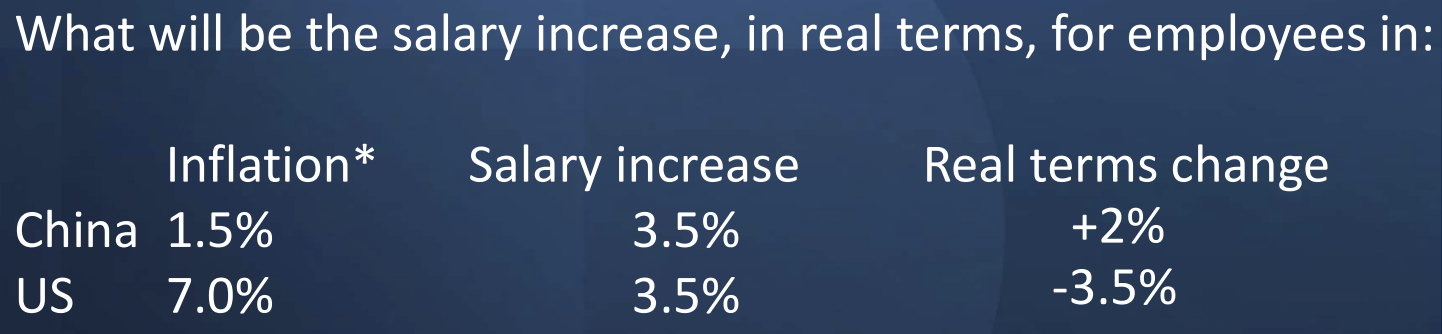
The global inflation rate in 2021 was 3.5%. A company instructed its companies to increase salaries for up to 3.5%
Pricing questions needed information:
What
How much
When
Most financial transactions have more than one consequence. The best way to tackle these problems is:
Separate the problem into the different parts, showing the “as is” or “do nothing scenario”
Quantify the changes or delta for each part of the problem
Add up the difference
Do not accept a raise if it is not higher than the inflation rate

Pricing Impact
The Washington Square company has sales of $400. Total payroll expenses are $40, or 10% of sales.
The company implements a 10% price increase to all products and customers, effective immediately. All customers accept the price increase and continue buying the same quantities (the head of marketing, who led the communication process, graduated from NYU’ SPS).
The company then doubles the compensation for all its employees. What is the impact on profitability?
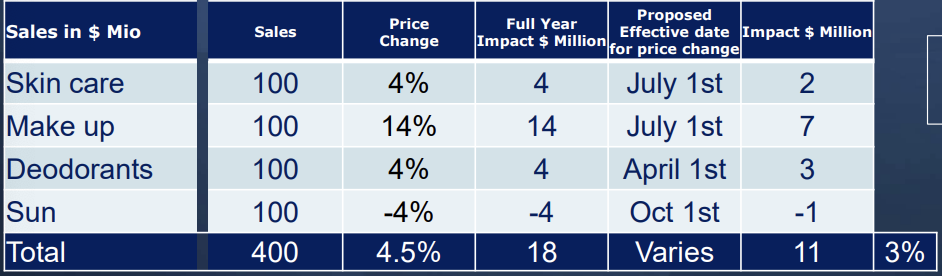
Timing Price Increases
July is ½ the year
Delaying a price increase reduces the total revenue gained. If prices rise in January, a price increase then benefits the full 12 months (100%). Starting the increase July 1st captures only half the year (50%). Starting October 1st captures just the last 3 months (25%)
Tips on How to Increase Prices
What I’ve learned increasing prices globally:
Explain price increases well. Your client will understand when there is inflation and an increase in costs
Go prepared to know how to respond when challenged
Mention price decreases first. List price increases from lowest to highest
If you get a price increase, push back. otherwise, look for costs cuts from other suppliers or raise prices to clients
Which Currency is Stronger? - Cost per Response
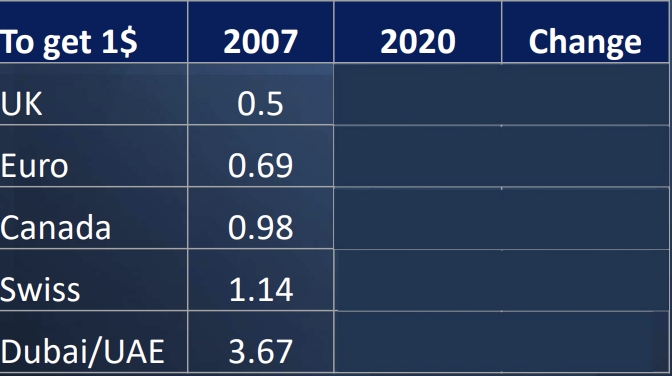
I only need 0.50 British pounds to buy a dollar. For each British pound, I get 2 dollars. Therefore, nothing.
How many units of a currency we get per dollar is not an indication of the strength of a currency or why prices are lower or more expensive in one country
Cost per Response (CPR) measures the cost to get any reaction, such as clicks or survey answers
Cost per Inquiry
Cost per Inquiry (CPI) is the average amount spent to get one potential customer to show interest, such as filling out a contact form, subscribing via email, making a phone call, chatting live, requesting a product demo, downloading contact, or registering for a webinar
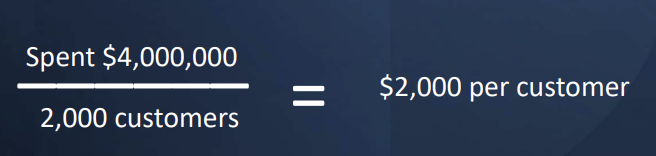
Customer Acquisition Cost. Why do Banks Pay $2,000?
Discounts, Cost & Marketing Expense / Number of Customers Acquired = Customer Acquisition Cost
Customer Lifetime Value. How do Banks Make $3,000?
Cash we get per year or transaction X Years consumer is retained, or number of transactions = Customer lifetime value
