HSS Study Design
 Call Kai
 Learn
 Practice Test
 Spaced Repetition
 Match
 Flashcards
 Knowt Play
1/19

There's no tags or description
Looks like no tags are added yet.
20 Terms
Researchers are interested in whether there is an association between sun exposure and the development of multiple sclerosis (MS). They recruited participants from Tasmania, Australia with MS (group 1) from local support groups and those without MS (group 2) who were randomly selected from the same community matched for sex and age. A validated questionnaire was used to record past sun exposure. Sun exposure was then compared between the 2 groups.
What type of study design did the researchers use?
A. Case report
B. Case-control
C. Prospective cohort
D. Retrospective cohort
B. Case-control
Rationale: The correct answer is a case-control design—they start with the outcome (cases with MS, and non-cases/controls without MS). A questionnaire assesses past sun exposure and is compared between the 2 groups. A case report describes a population, phenomenon or disease, and are observational without a comparator. A prospective cohort is an observational design where a researcher identifies a group with the exposure and a group without the exposure in the same population in the present time and follows them forward from the exposure to assess for the development of an outcome. A retrospective cohort identifies a group with and without the exposure in the past (retrospectively) and follows forward from the past exposure to present day to assess for the outcome.
Which study design is BEST suited for estimating prognosis after diagnosis of a disease?
A. Case report
B. Case-control study
C. Cross-sectional study
D. Cohort study
D. Cohort study
Rationale: Of the designs listed, a cohort study is the best design to study prognosis. This is a variant of the classic cohort study because you start with the presence or absence of an exposure (risk factor) among a cohort with a disease/condition and track them forward in time to see what happens to them in the future (survival, recurrence, other complications). A case report is best for describing a new phenomenon or an unusual presentation of a disease. A case-control study is best for studying a rare disease or one with a long latency period since you start the investigation with the disease (outcome of interest). A cross-sectional study looks at the exposure and outcome a single point in time, so it is unable to provide information about prognosis; however, it provides the prevalence.
Researchers investigated the association of chronic fatigue and depression among participants (age 18-50) in a regional health clinic. The primary outcome was self-report of fatigue for at least 6 months. Data on the primary outcome and depression were obtained using a structured interview and trained interviewers.
Which statement is MOST accurate regarding this study?
A. It can determine the incidence of chronic fatigue.
B. It establishes that depression causes chronic fatigue.
C. It measures disease prevalence at a single point in time
D. It is the preferred design for studying prognosis
C. It measures disease prevalence at a single point in time
Rationale: The correct response is a cross-sectional study that examines the presence or absence of an outcome (fatigue) and the presence or absence of a risk factor (depression) at some specified time. Thus, they are frequency or prevalence studies. Case-control is incorrect because they start with the patients (cases) with disease and those without the disease (controls) and then look for past exposures or risk factors. A case report is best for describing a new phenomenon or an unusual presentation of a disease of a single patient. A Cohort study is an observational design where a researcher identifies a group with the exposure and group without the exposure in the same population and then determines if they develop the outcome after exposure.
A hospital system is evaluating a new protocol to reduce catheter-associated urinary tract infections (CAUTIs). The infection control team implements the new protocol in Hospital A, while Hospital B continues standard care. Patients are assigned to treatment based on which hospital they are admitted to. Outcomes (CAUTI rates) are compared between the two hospitals after 6 months.
Which study design best describes this scenario?
A. Randomized controlled trial
B. Nonrandomized controlled trial
C. Prospective cohort study
D. Case-control study
B. Nonrandomized controlled trial
Rationale: RCT is not correct, because there is no random assignment. Assignment to intervention vs. control depends on which hospital the patient is admitted to. Nonrandomized controlled trial (quasi-experimental study) is correct. The investigator is assigning the intervention (Hospital A implements the protocol), so it is experimental. But since assignment is not random, it is a nonrandomized controlled trial (also called a quasi-experiment). Prospective cohort study is not correct, because in a cohort study, exposure occurs naturally and is not assigned by the investigator. Here, the researchers actively implemented the protocol in one hospital. Case-control study is not correct, because a case-control study starts with outcomes already present (cases vs. controls) and looks back at exposures. Here, the study is prospective and experimental.
Patients with infective endocarditis on the left side of the heart are typically treated with intravenous antibiotics for 6 weeks. Researchers were interested if a shift from intravenous to oral antibiotics once patients were stable would be as efficacious as continued intravenous therapy for 6 weeks.
Using the trial procedures described below, which is most accurate?
Participants were randomly assigned in an open label study to continue intravenously administered antibiotic treatment for 6 weeks or a shift to orally administered antibiotic treatment once the patient was stable. All participants received a total of 6 weeks of treatment. Randomization was performed using a computer-generated sequence stored in a central database and managed by an independent statistician.
A. Allocation was concealed but there was no blinding
B. Allocation was concealed and there was blinding
C. Allocation was not concealed but there was blinding
D. Allocation was not concealed and there was no blinding
Rationale: The correct response is the allocation was concealed (computer generated sequence managed by an independent statistician). There was no blinding. Blinding was not possible as the intervention was a switch to oral antibiotics from the standard practice of intravenous antibiotics. In addition, the study was described as “open-label”, so both the participants and the researchers know which treatment the participants are receiving. This contrasts with single-blind or double-blind studies, where either the participants, the researchers, or both are unaware of the treatment assignments to prevent bias.
Researchers were interested in evaluating if physical therapy decreased post-mastectomy lymphedema (arm swelling) in breast cancer patients. After assessing baseline post-mastectomy lymphedema, they randomized post-mastectomy patients to either group 1 which included pressured arm bandage versus group 2 which included pressured arm bandage + three times weekly 30-minute physical therapy sessions. Group 1 was instructed to wear the arm bandage daily and perform activities as tolerated with follow-up at 6 weeks. Group 2 had weekly visits with the study staff to assess adherence to wearing the bandage and physical therapy attendance. After 6 weeks they compared the lymphedema in each group using a standardized technique.
Which of the following is the most likely type of bias that occurred in this study design?
A. Attrition bias
B. Detection or ascertainment bias
C. Performance bias
D. Recall bias
C. Performance bias
Rationale: The correct response is performance bias, which occurs when there is unequal treatment or care to different groups in the study aside from the intervention. Here Group 2 had more attention from researchers with weekly check-ins. To avoid this bias, the researchers should have also had weekly check-ins with Group 1. In this example, researchers would not be able to tell whether the added physical therapy made a difference or if it was the weekly check-ins. Detection or ascertainment bias occurs when the outcomes are determined/measured differently in the two groups. Attrition bias occurs when there are more losses to follow up in one group versus the other. Recall bias occurs when the participants are asked to remember a remote or past event or exposure.
A pharmaceutical company is developing a new drug for the treatment of a certain type of cancer. After successfully completing a Phase 1 clinical trial the company is now planning to proceed to the next phase of clinical trials.
What is the primary objective of this next phase in clinical trials for the new drug?
A. To compare the new drug with existing standard treatments in a large group of diseased patients
B. To assess safety, tolerability and short-term efficacy in a small group of diseased patients
C. Demonstrate safety and appropriate dosage in a small group of healthy patients
D. To monitor long-term safety and effectiveness in diverse populations in real-world settings
B. To assess safety, tolerability and short-term efficacy in a small group of diseased patients
Rationale: In Phase I trials, the new drug is tested in a small group of healthy volunteers or patients to evaluate its safety, tolerability, and appropriate dosage (Answer C). Phase II clinical trials are designed to assess the drug's safety and short-term efficacy in a small group of patients with the specific medical condition of interest (Answer B). In this case, Phase II trials will focus on evaluating the drug's safety and efficacy in a small group of patients with the specific type of cancer targeted by the new drug. Phase III clinical trials test efficacy and safety in a large population and compare the new drug to standard of care treatment or placebo (Answer A). Positive results are used to obtain regulatory approval. Phase IV trials occur after regulatory approval and focus on post-marketing surveillance for long-term safety and effectiveness in a diverse population in real-world settings (Answer D).
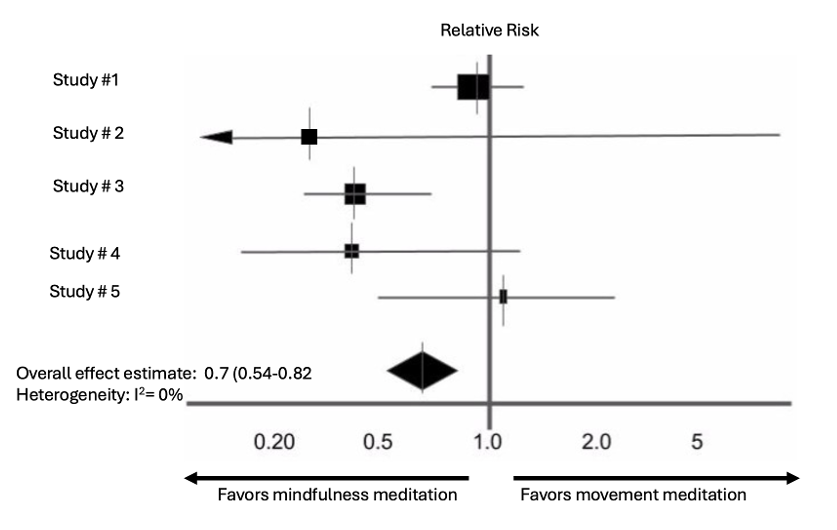
Researchers at the University of Florida are interested in meditation practices to prevent anxiety in medical students. A meta-analysis of 5 randomized controlled trials comparing mindfulness meditation with movement meditation is conducted. The results of the studies are reported in the forest plot below.
Which of the following statements is MOST accurate regarding the forest plot?
A. The study with the largest sample size is Study #1 based on the length of the horizontal line through the box.
B. Study #3 reported a non-statistically significant benefit to mindfulness meditation compared to movement meditation in prevention of anxiety
C. The studies demonstrated no important statistical heterogeneity and were appropriate to combine in a meta-analysis.
D. The overall estimate revealed a 70% reduction in development of anxiety in students using mindfulness meditation versus movement meditation
C. The studies demonstrated no important statistical heterogeneity and were appropriate to combine in a meta-analysis.
Rationale: The largest study is Study #1, but this is depicted by size of box not the length of the horizontal line through the box. The horizontal line through each box depicts the confidence interval for that study’s point estimate. Study #3 shows a statistically significant benefit with mindfulness meditation because the CI does not cross the line of no effect. The overall estimate when the results of all 5 studies are pooled is demonstrated by the diamond at the bottom of the forest plot. The pooled relative risk (RR) is 0.70, indicating a 30% relative reduction in the risk of developing anxiety with mindfulness meditation compared with movement meditation. Answer choice C is correct because the Higgins I2 test for heterogeneity is 0%, indicating that all studies have no statistical heterogeneity and therefore methodologically acceptable to combine in the meta-analysis.
Researchers conducted a randomized controlled trial evaluating a new medication to prevent ischemic stroke in high-risk patients. At the end of the study, the incidence of stroke was 12% in the control group and 8% in the treatment group.
Which of the following is the MOST accurate interpretation of these results?
A. The treatment reduces the relative risk of stroke by 4%, and approximately 25 patients must be treated to prevent one additional stroke.
B. The treatment reduces the absolute risk of stroke by 4%, and approximately 25 patients must be treated to prevent one additional stroke.
C. The treatment reduces the absolute risk of stroke by 8%, and approximately 12 patients must be treated to prevent one additional stroke.
D. The treatment reduces the relative risk of stroke by 25%, and approximately 12 patients must be treated to prevent one additional stroke.
B. The treatment reduces the absolute risk of stroke by 4%, and approximately 25 patients must be treated to prevent one additional stroke.
Rationale: Absolute Risk Reduction (ARR)= Event Rate in Control Group - Event Rate in Treatment Group. ARR = 12% - 8% = 4% = 0.04. Number Needed to Treat (NNT). NNT = 1 / ARR. NNT = 1 / 0.04 = 25. Therefore, you would need to treat 25 patients with the new medication to prevent one additional stroke compared to the control group.
Dr. Sanchez is reviewing the results of a meta-analysis that combines data from several studies evaluating the effectiveness of a new diabetes medication in preventing diabetic retinopathy. The meta-analysis includes a Higgins I² statistic of 12%.
Which interpretation is MOST accurate?
A. The I² statistic of 12% indicates a high degree of heterogeneity among the studies, suggesting that the differences in study results are largely due to variability in the effect estimates.
B. The I² statistic of 12% suggests a low degree of heterogeneity, meaning that 12% of the variability in effect estimates across studies is due to differences in study results rather than chance.
C. The I² statistic of 12% means there is no heterogeneity among the studies, and the variability in effect estimates is due to random variation alone.
D. The I² statistic of 12% implies that the studies are too heterogeneous to combine, and Dr. Lopez should not interpret the results of the meta-analysis.
B. The I² statistic of 12% suggests a low degree of heterogeneity, meaning that 12% of the variability in effect estimates across studies is due to differences in study results rather than chance.
Rationale: An I² of 12% falls into the low heterogeneity range, indicating that 12% of the variability in study results is due to differences between studies rather than random chance. The presence of low heterogeneity suggests that while there is some variability in the effect estimates, the results from the meta-analysis are still interpretable. Researchers might explore potential sources of heterogeneity, but it does not necessarily mean that the studies cannot be combined. A is incorrect because an I² of 12% indicates low, not high, heterogeneity. C is incorrect because 12% indicates a low degree of heterogeneity, not no significant heterogeneity. D is incorrect because low heterogeneity does not imply that the studies cannot be combined or interpreted. High-heterogeneity (I2>75%) may indicate that studies are too heterogenous to be combined in a meta-analysis.

A randomized clinical trial is reported according to CONSORT guidelines. Which information is primarily conveyed by the figure
A. Participant flow through the trial
B. Treatment effect estimates
C. Time-to-event outcomes
D. Publication bias
A. Participant flow through the trial
Rationale: The CONSORT diagram is a standard for reporting randomized controlled trials. It accounts for what happens to all subjects from the beginning to end of trial (e.g. dropout, loss to follow-up, excluded from analysis).

Using the graphical information in the Figure, which study best represents a Relative Risk Reduction (RRR) and a 95% confidence interval (CI) that is precise, statistically significant and clinically significant favoring the treatment?
A. Study A
B. Study B
C. Study C
D. Study D
A. Study A
Rationale. Study A shows a narrow (precise) CI that is statistically significant (the CI does not include 0) and it is clinically significant because the lower CI is greater than the 40% clinically important difference that the researchers chose. Study B has a CI that is relatively narrow (though not as precise as Study A), and it is statistically significant as the CI does not include 0; however, the lower CI limit is less than the 40% felt to be clinically important. Study C is also precise with narrow CI, but it is neither statistically (CI includes 0) or clinically significant in terms of RRR (the point estimate and lower CI support the control group, not the treatment group, and the upper CI is less than 40% the researchers felt was clinically significant). Study D has a wider (imprecise) CI that is not statistically significant (95% CI includes 0) and although the point estimate is greater than than 40%, most of the CI is less than 40% margin.
A total of 800 patients participated in a randomized trial comparing the effectiveness of Drug Z to placebo in decreasing lung cancer deaths (400 patients randomized to Drug Z; 400 patients randomized to placebo). 10 patients died in the Drug Z arm (experimental group) and 20 died in the placebo arm (control group).
What is the relative risk (RR) for death in this study in comparing Drug Z to placebo?
A. 0.5
B. 2.5
C. 4.0
D. 5.0
A. 0.5
Rationale: The RR is experimental event rate (EER) divided by the control event rate (CER) or EER/CER. The EER for Drug Z is 10/400 = 0.025 or 2.5% while the CER for placebo is 20/400 = 0.05 or 5%. The RR = 0.025/0.05 = 0.5. This is the same as 2.5%/5% = 0.5. Patients receiving Drug Z experienced 50% of the risk of death compared with placebo (RR = 0.5).
A total of 800 patients participated in a randomized trial comparing the effectiveness of Drug Z to placebo in decreasing lung cancer deaths (400 patients randomized to Drug Z; 400 patients randomized to placebo). 10 patients died in the Drug Z arm (experimental group) and 20 died in the placebo arm (control group).
Approximately how many patients would need to receive Drug Z to prevent one additional lung cancer death?
A. 2.5
B. 5
C. 25
D. 40
D. 40
The NNT = 1/ARR where ARR = |EER –CER|. The EER is 2.5%, and the CER is 5%. ARR = |2.5% - 5%| = 2.5%. NNT = 100/ARR = 100/2.5 = 40. This is the same as 1/ARR = 1/0.025 = 40. This means that 40 patients would need to be treated with Drug Z to prevent 1 death.
Researchers conducted a randomized controlled trial comparing Drug A with standard therapy for preventing recurrent myocardial infarction (MI) in patients with established coronary artery disease. After a median follow-up of 5 years, the incidence of recurrent MI was 8.5% in the Drug A group compared with 11.0% in the standard therapy group (p = 0.03).
Which of the following is the MOST appropriate interpretation of these results?
A. The difference is both statistically and clinically significant because the p-value is <0.05.
B. The difference is statistically significant, but additional information is needed to determine whether it is clinically significant.
C. The difference is not statistically significant because the absolute risk reduction is only 2.5%.
D. The study failed to reject the null hypothesis because the absolute difference between groups is small.
B. The difference is statistically significant, but additional information is needed to determine whether it is clinically significant
Rationale: A p-value < 0.05 indicates that the observed difference is unlikely to be due to chance alone, so the null hypothesis is rejected, and the result is statistically significant. However, clinical significance cannot be determined from the p-value alone. Assessing clinical significance requires considering the magnitude of the treatment effect (e.g., absolute risk reduction, relative risk reduction, NNT), confidence intervals, potential harms, costs, and patient-important outcomes.
A 22-year-old college student presents to the emergency department with 2 days of fever, severe headache, neck stiffness, and photophobia. Because bacterial meningitis is suspected, a new rapid antigen test is performed and is negative. Cerebrospinal fluid (CSF) culture, the gold standard test, later grows Neisseria meningitidis.
Which statistical concept is most closely illustrated by the performance of the rapid antigen test in this patient?
A. Type I error
B. Type II error
C. True positive
D. Selection bias
B. Type II error
Rationale: The CSF culture (gold standard) confirms that the patient truly has bacterial meningitis. Because the rapid antigen test was negative despite the patient having the disease, the test failed to detect a true case of disease (i.e., a false-negative test result). When evaluating diagnostic tests, a false-negative result is analogous to a Type II error in hypothesis testing. A Type II error occurs when there is insufficient evidence to reject the null hypothesis when it is actually false (β error). In the context of diagnostic testing, this corresponds to failing to identify disease that is truly present. Type I error: Incorrectly rejects the null hypothesis (analogous to a false-positive test result). Type II error: Fails to reject the null hypothesis when it is false (analogous to a false-negative test result). True positive: Correctly identifies disease. Selection bias: A systematic error in the selection of study participants and is unrelated to the accuracy of an individual diagnostic test.
Dr. Rajasekhar is noticing an increasing number of patients referred to her bleeding disorders clinic for evaluation of von Willebrand disease (vWD). She is comparing a new rapid screening test for vWD to the standard reference von Willebrand activity tests (the latter take several days to process). She enrolls 200 patients, and all get both the new rapid and the standard vWD test. Among 50 patients confirmed to have vWD with the standard test, 40 tested positive with the rapid test. Among 150 patients confirmed not to have the vWD with the standard test, 100 tested negative with the rapid test.
What is the specificity of the new rapid von Willebrand disease test?
A. 44.4%
B. 66.7%
C. 80%
D. 90%
B. 66.7%
Rationale: Remember to use a 2x2 table. The specificity is the true negative rate. It is the probability a non-diseased person will have negative rapid test. Specificity helps rule in disease. The specificity of the new VWD test is TN/TN+FP = 100/150 or 66.7%
Dr. Lee is evaluating two different screening tests for lung cancer: Test A and Test B. Test A can detect lung cancer 1 year earlier than the current standard method, while Test B tends to detect slower-growing, less aggressive cancers. Patients screened with Test A appear to live longer after diagnosis compared to those diagnosed with the standard method. Patients screened with Test B have a higher survival rate compared to those diagnosed through standard screening.
What are the most likely explanations for the observed outcomes with Test A and Test B?
A. Test A results are influenced by length bias, and Test B results are influenced by lead time bias.
B. Test A results are influenced by lead time bias, and Test B results are influenced by length bias.
C. Both Test A and Test B results are influenced by lead time bias.
D. Both Test A and Test B results are influenced by length bias.
B. Test A results are influenced by lead time bias, and Test B results are influenced by length bias.
Rationale: Lead Time Bias (Test A): Patients appear to live longer after diagnosis because the disease is detected earlier, not necessarily because they live longer overall. Length Bias (Test B): The screening test is more likely to detect slower-growing, less aggressive cancers, which naturally have better prognoses, leading to an apparent increase in survival rates.
You are reviewing the results of a mammogram performed as part of a breast cancer screening program. The following data is available:
• Sensitivity of the mammogram: 85% (0.85)
• Specificity of the mammogram: 90% (0.90)
• Pretest probability of breast cancer in the screening population: 2%
In the context of this screening program, a patient receives a positive mammogram result. You want to interpret the likelihood ratio for this positive result.
Which statement BEST interprets the positive likelihood ratio (LR+) for the mammogram?
A. A positive mammogram result is 8.5 times more likely in a patient with breast cancer than a patient without breast cancer.
B. A positive mammogram result increases the likelihood of breast cancer by 85% compared to the likelihood of having breast cancer before the test.
C. A positive mammogram result is 90% likely to occur in someone with breast cancer compared to someone without breast cancer.
D. A positive mammogram result means that there is a 0.17 times chance of having breast cancer compared to having no breast cancer.
A. A positive mammogram result is 8.5 times more likely in a patient with breast cancer than a patient without breast cancer.
Rationale: A Positive Likelihood Ratio (LR+): is calculated as: Sensitivity/(1−Specificity). Sensitivity = 85% (0.85). Specificity = 90% (0.90). 1 - Specificity = 1 - 0.90 = 0.10. LR+ = 0.85/0.10=8.5. A LR+ = 8.5 means that a positive mammogram result increases the likelihood of having breast cancer 8.5 times compared to the likelihood of having breast cancer before the screening mammogram was done. B is incorrect because LR+ is a ratio, not a percentage increase. C is incorrect because the LR+ is not a direct measure of how likely the test result is in people with or without the disease. D is incorrect because 0.17 is the LR- (negative likelihood ratio), not LR+.

An investigation was carried out to discover whether biomarker A (red curve) and B (green curve) can be used to detect prostate cancer and how they compare to the prostate specific antigen (PSA) which is the standard test C (blue curve). Blood samples from 100,000 men were tested at time 0 with all three tests. These men were then followed up for 15 years and deaths from prostate cancer were recorded. A ROC curve was used to compare biomarker A and B to the standard PSA. The ROC curve shows the trade-off between sensitivity and specificity. What can you deduce from this ROC curve?
A. Biomarker B (green curve) has the highest diagnostic accuracy for prostate cancer
B. The standard OSA test (blue curve) is the least accurate test in identifying men with prostate cancer
C. Biomarker A (red curve) appears to have acceptable diagnostic accuracy for further study
D. Biomarker B (green curve) demonstrates that this test has a false positive rate approximately equal to the true positive rate
D. Biomarker B (green curve) demonstrates that this test has a false positive rate approximately equal to the true positive rate
Rationale: The standard PSA test (blue curve) has the highest AUC (area under the curve). Therefore, this test is the best at discriminating normal (no prostate cancer) and abnormal (prostate cancer). Biomarker B (green curve) has a line of best fit that is diagonal and therefore provides little discrimination between normal and abnormal. That means the true positive rate is equal to the false positive rate, making this test useless in diagnosis of prostate cancer. Biomarker A (red curve) has moderate diagnostic accuracy but is still not as good as the standard PSA test.