Micro Unit 2
 Call Kai
 Learn
 Practice Test
 Spaced Repetition
 Match
 Flashcards
 Knowt Play
1/50

There's no tags or description
Looks like no tags are added yet.
51 Terms
Law of Demand
inverse relationship between price and quantity demanded
Ceteris paribus
“all other things held constant” —> when reading a demand curve, assume all outside factors are held constant
Change in price
movement along the curve; no shift
the only thing that c an change the “quantity demanded”
Change in demand
shift right or left
Demand Shifters
Tastes and Preferences
Related Goods (price of)
Income
Buyers (number of)
Expectations
Tastes and Preferences
more popular —> shifts right
less popular —> shifts left
Substitutes
price increases —> demand increases, shift right
price decreases —> demand decreases, shift left
Complements
price increases —> demand decreases, shift left
price decreases —> demand increases, shift right
Buyers
increase in number of consumers —> shift right
decrease in number of consumers —> shift left
Normal goods
income increases —> demand increases
income increases —> demand increases
Inferior goods
income increases —> demand decreases
income decreases —> demand increases
Expectations
if consumers expect the price to rise later, they are more likely to buy now —> demand increases, shifts right
expect the price to decrease later, more likely to wait —> demand decreases, shifts left
The Law of Supply
direct relationship between price and quantity supplied
Supply Shifters
Inputs (price and availability)
Related goods (price of)
Expectations of Future Profit
Numbers of Producers (more producers = supply increases)
Technology (better technology = supply increases)
Substitutes for Supply
if the price of a substitute increases, the supply with decrease for the other good
Expectations
price of a good is expected to increase —> supply with decrease in anticipation of future prices
Elastic Demand
consumers are highly responsive to changes in price
price increases —> quantity demanded decreases
price decreases —> quantity demanded increases
greater than 1
Inelastic demand
consumers do not respond very much to changes in price
price increases —> quantity demanded falls a little
price deceases —> quantity demanded decreases a little
less than 1
Total Revenue - Inelastic Demand
price increase —> TR increase
price decrease —> TR decrease
Total Revenue - Elastic Demand
price increase —> TR decrease
price decrease —> TR increase
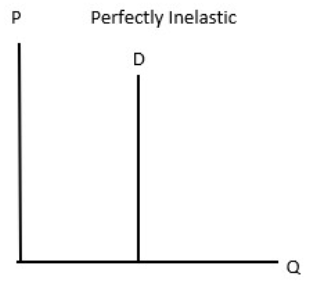
Perfectly Inelastic
PED = 0
Perfectly Elastic
PED = infinity

Percent Change
(New - Old)/Old * 100
Price Elasticity of Demand/Supply
% change Q / % change P
Characteristics of Goods/Services with Elastic Demand
Substitutes
Proportion of Income
Luxury or Necessity
Addictive or Habit Forming
Time (not in a hurry to purchase)
Characteristics of Goods/Services with Inelastic Demand
Few Substitutes
Necessities
Small portion of income
Required now, rather than later
Unit Elastic
PED = 1
Cross-Price Elasticity of Demand (XED)
shows if two goods are substitutes or complements
positive —> substitute
negative —> complements
XED = % change in Q of good A / % change in P of good B
Income Elasticity of Demand (YED)
shows if a good is normal or inferior
positive —> normal
negative —> inferior
YED = % change in Q / % change in Y
Income-elastic
income rises —> demand for income-elastic goods rises faster than income (+>1)
Income-inelastic
income rises —> demand for income-inelastic goods raises, but slower than income (+<1)
Regressive
high-income taxpayers pay a smaller percentage of their income than low-income taxpayers
Proportional/flat
all taxpayers pay the same percentage of their income
Progressive
high-income earners pay a large percentage of their income
Excise Tax
a “per-unit” tax placed on the sale of a specific good of service
shifts the supply curve to the left
both buyers and sellers share the burden of an excise tax
tax revenue —> box formed from the line of a tax wedge
amount of tax paid by consumers top half, amount of tax paid by producers bottom half
Total Expenditures
Total amount of money buyers spend on a good
Pe * Qe
Total Revenue for firms after excise tax
New Producer Price * New Quantity
Total Expenditures after excise tax
New Consumer Price * New Quantity
Tax Incindence
Who bears the burden of a tax?
more inelastic —> pays more burden
demand and supply have the same elasticity —> buyers and sellers share the tax equally
Find Tax Incidence from a graph
difference between new price after tax and price at equilibrium
Subsidy
Government payment to producers/consumers
lowers cost of production/consumption + encourages greater production/consumption of a good/service
shifts supply curve to the right

Price Ceiling
Government-imposed maximum price
binding —> must be placed below equilibrium price
help consumers by keeping prices low —> shortage because Qd>Qs

Price Floor
Government-imposed minimum price
binding —> must be placed above equilibrium price
help producers by keeping prices high —> surplus because Qs>Qd

Price Controls
price floor + price ceiling
both result in a misallocation of resources
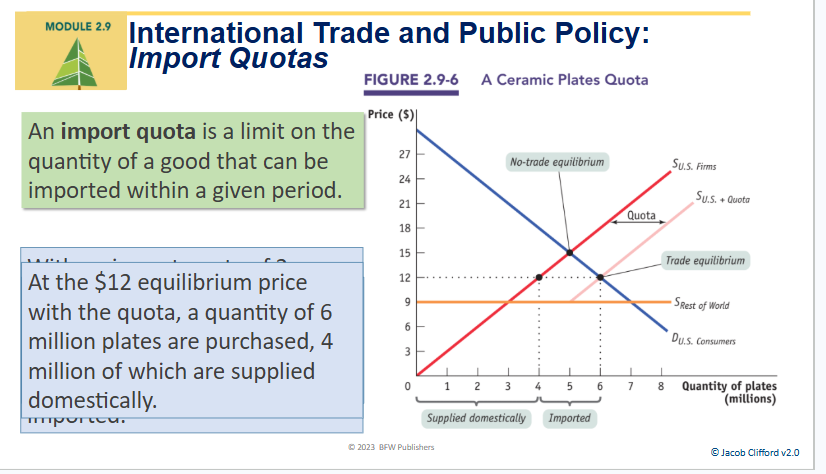
Quantity control/quota
upper limit on the quantity of some good that can be bought/sold
buyers pay more than what sellers would normally accept at a quote of 8 million rides

Quota rent
difference between demand and supply price at the quota amount
International Trade/tariffs
consumers benefit from international trade
tariffs create deadweight loss by causing a decrease in total surplus

Domestic Price
price of a good within a country
World Price
price of a good on the international market
lower than domestic price —> incentive to import
higher than domestic price —> incentive to export
Protectionism
government restricts international trade to protect domestic industries from foreign competition
Import Quota
tax on imports