Chapter 5: Individual and Market Demand
 Call Kai
 Learn
 Practice Test
 Spaced Repetition
 Match
 Flashcards
 Knowt Play
1/102

There's no tags or description
Looks like no tags are added yet.
103 Terms
Substitution vs income effect
Sub: the change in the QD bc a price change changes the attractiveness of substitute good
Income: the change in QD bc a price change causes a change in purchasing power
Market demand curve
Shows how much of a good the market as a whole wants to purchase at various prices

Price consumption curve (PCC)
Holding income + the price of Y constant (+ preferences)
the PCC for a good X is the set of optimal bundles traced on an indifference map as the price of X varies.
In simple terms: a curve joining optimal consumption bundles as the price of one good changes.
What is held constant when deriving a PCC?
Income
Price of the other good
Preferences
Purpose of a price consumption curve (PCC)
Shows how a consumer's optimal bundle changes when the price of 1 good changes
Holding income, preferences and other prices constant.
Key distinction: The PCC plots optimal bundles of TWO quantities (x + the composite good) as price changes
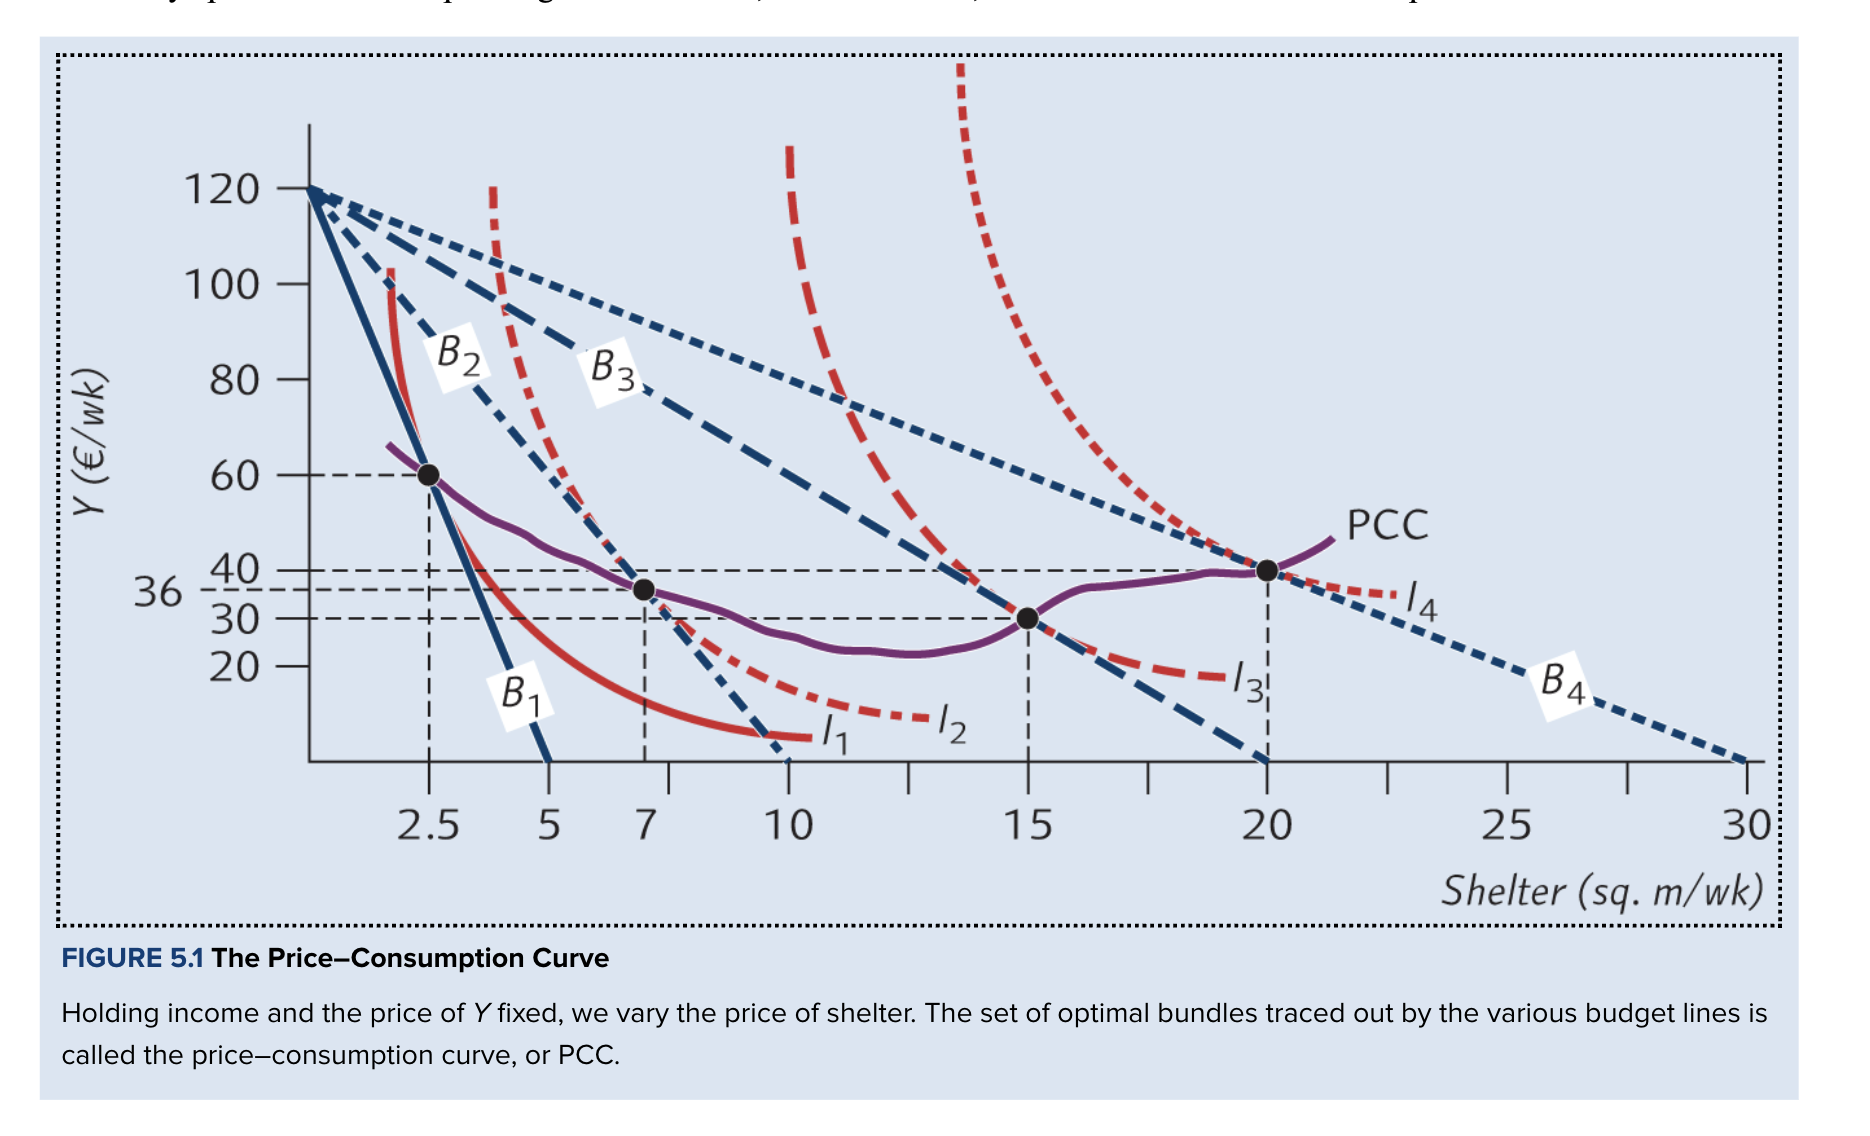
How to draw a PCC
Draw the indifference map and initial budget constraint
Good X on x axis, composite good Y on y axis
Change the price of good X (keep income + the price of the composite good constant)
The budget constraint rotates bc the price of X changes.
Find the new optimal bundle at each price (where the BL is tangent to an IC).
Join the optimal bundles to form the PCC

Draw the PCC for this.
Income: $120/week
Price of composite good: $1/unit
- When the price of shelter falls:
The budget constraint rotates outwards around the vertical intercept.
The consumer can afford more shelter.
In this example, the consumer chooses more shelter at every lower price.
Consumption of the composite good can increase or decrease.
*revisit this example

In a PCC, when varying the price of a good why is the vertical intercept unchanced?
Bc income + price of composite good remain constant
Individual demand curve
Shows quantity of a good 1 consumer will buy at diff prices, holding other factors constant
How to construct an individual demand curve? (PCC → IDC)
Can get all info from the PCC:
Take each optimal bundle on the PCC
Record the P + QD at that price
Plot: price on y axis & quantity on the x axis.
Join points

Derive the indivudal demand curve from this PCC

What is the key difference between the PCC and demand curve?
PCC: shows quantities of 2 goods
DC: shows price vs quantity of 1 good
Both: summarise consumers purchase decison in response to changes in PRICE
Feature | PCC | Individual demand curve |
|---|---|---|
Vertical axis | Quantity of composite good (Y) | Price of X |
Horizontal axis | Quantity of X | Quantity of X |
Shows | Optimal bundles as price changes | QD at different prices |
Tools that summarise consumers purchase decisions in response to changes in price vs income
Price | Income |
|---|---|
Price consumption curve (PCC) | Income consumption curve (ICC) |
Individual demand curve | Engel curve |

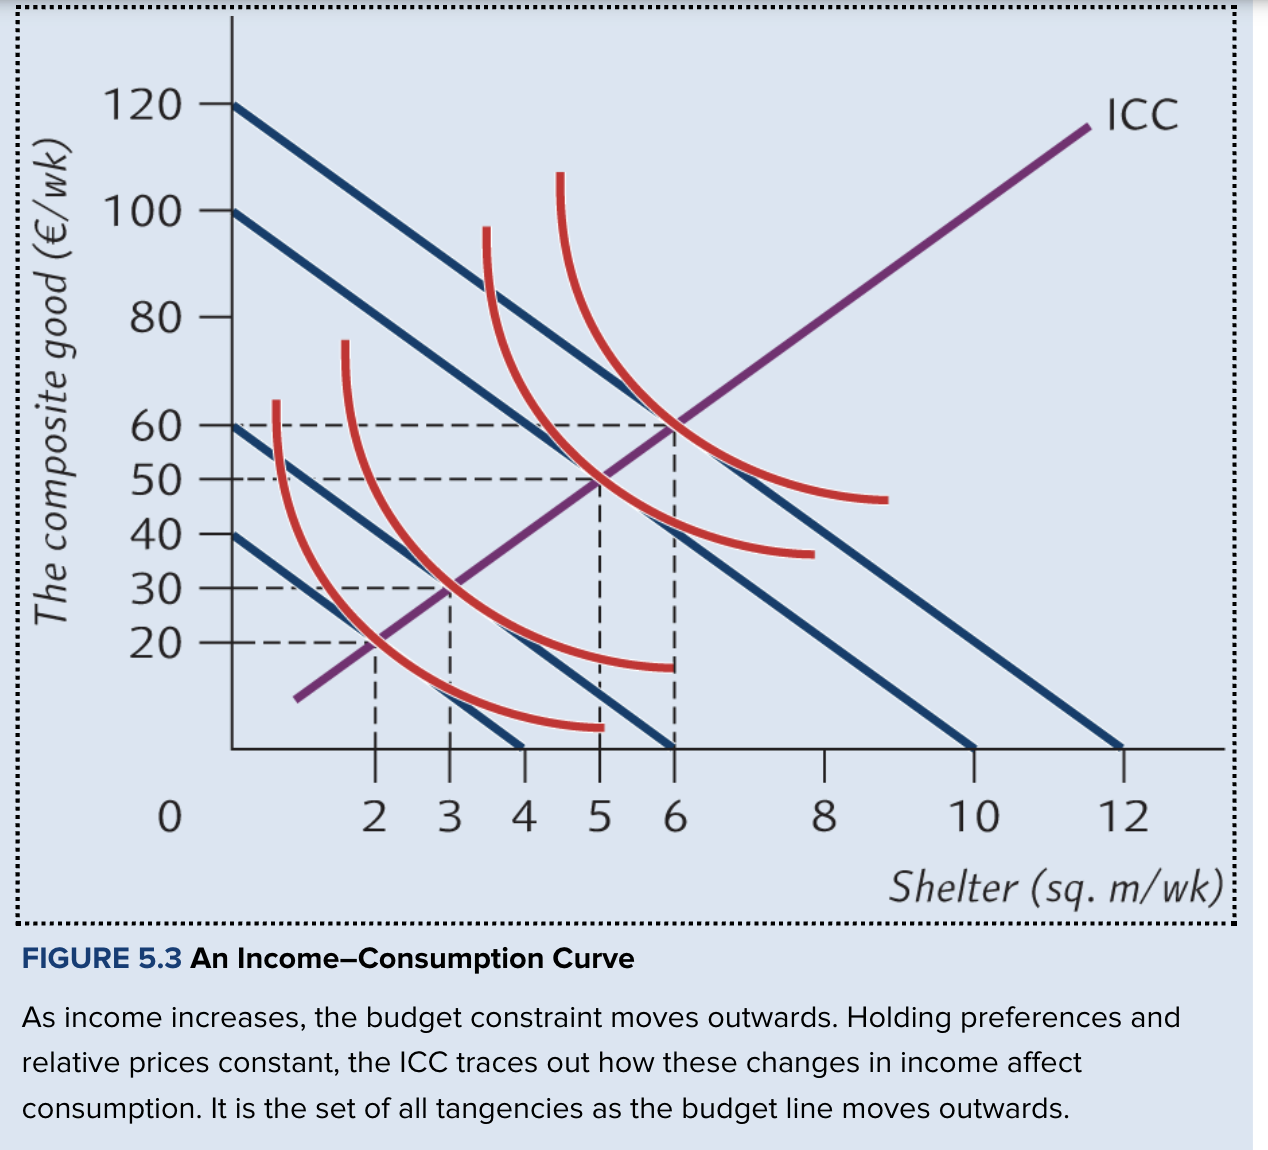
Income consumption curve (ICC)
The ICC for a good X is the set of optimal bundles traced on an indifference map as income varies
Holding the prices of X and Y constant
In simple terms: shows how a consumer's optimal consumption bundles change as income changes
What is held constant when deriving the ICC?
Preferences
Relative prices
PCC vs ICC
How consumers optimal bundle changes with…
PCC: price changes
ICC: income changes
Aka how changes in price vs income affect consumption
What happens to the budget constraint when income rises?
Shifts parallel outwards

How to construct an income consumption curve (ICC)?
Draw the budget constraint and indifference map.
Increase income, shifting the budget constraint parallel outwards.
Find the optimal bundle at each income level.
Join the optimal bundles (at the diff income levels) to form the ICC
Shape of ICC
Straight or curved
Draw an ICC using this info:
Price of composite good: $1/unit
Price of X: $10
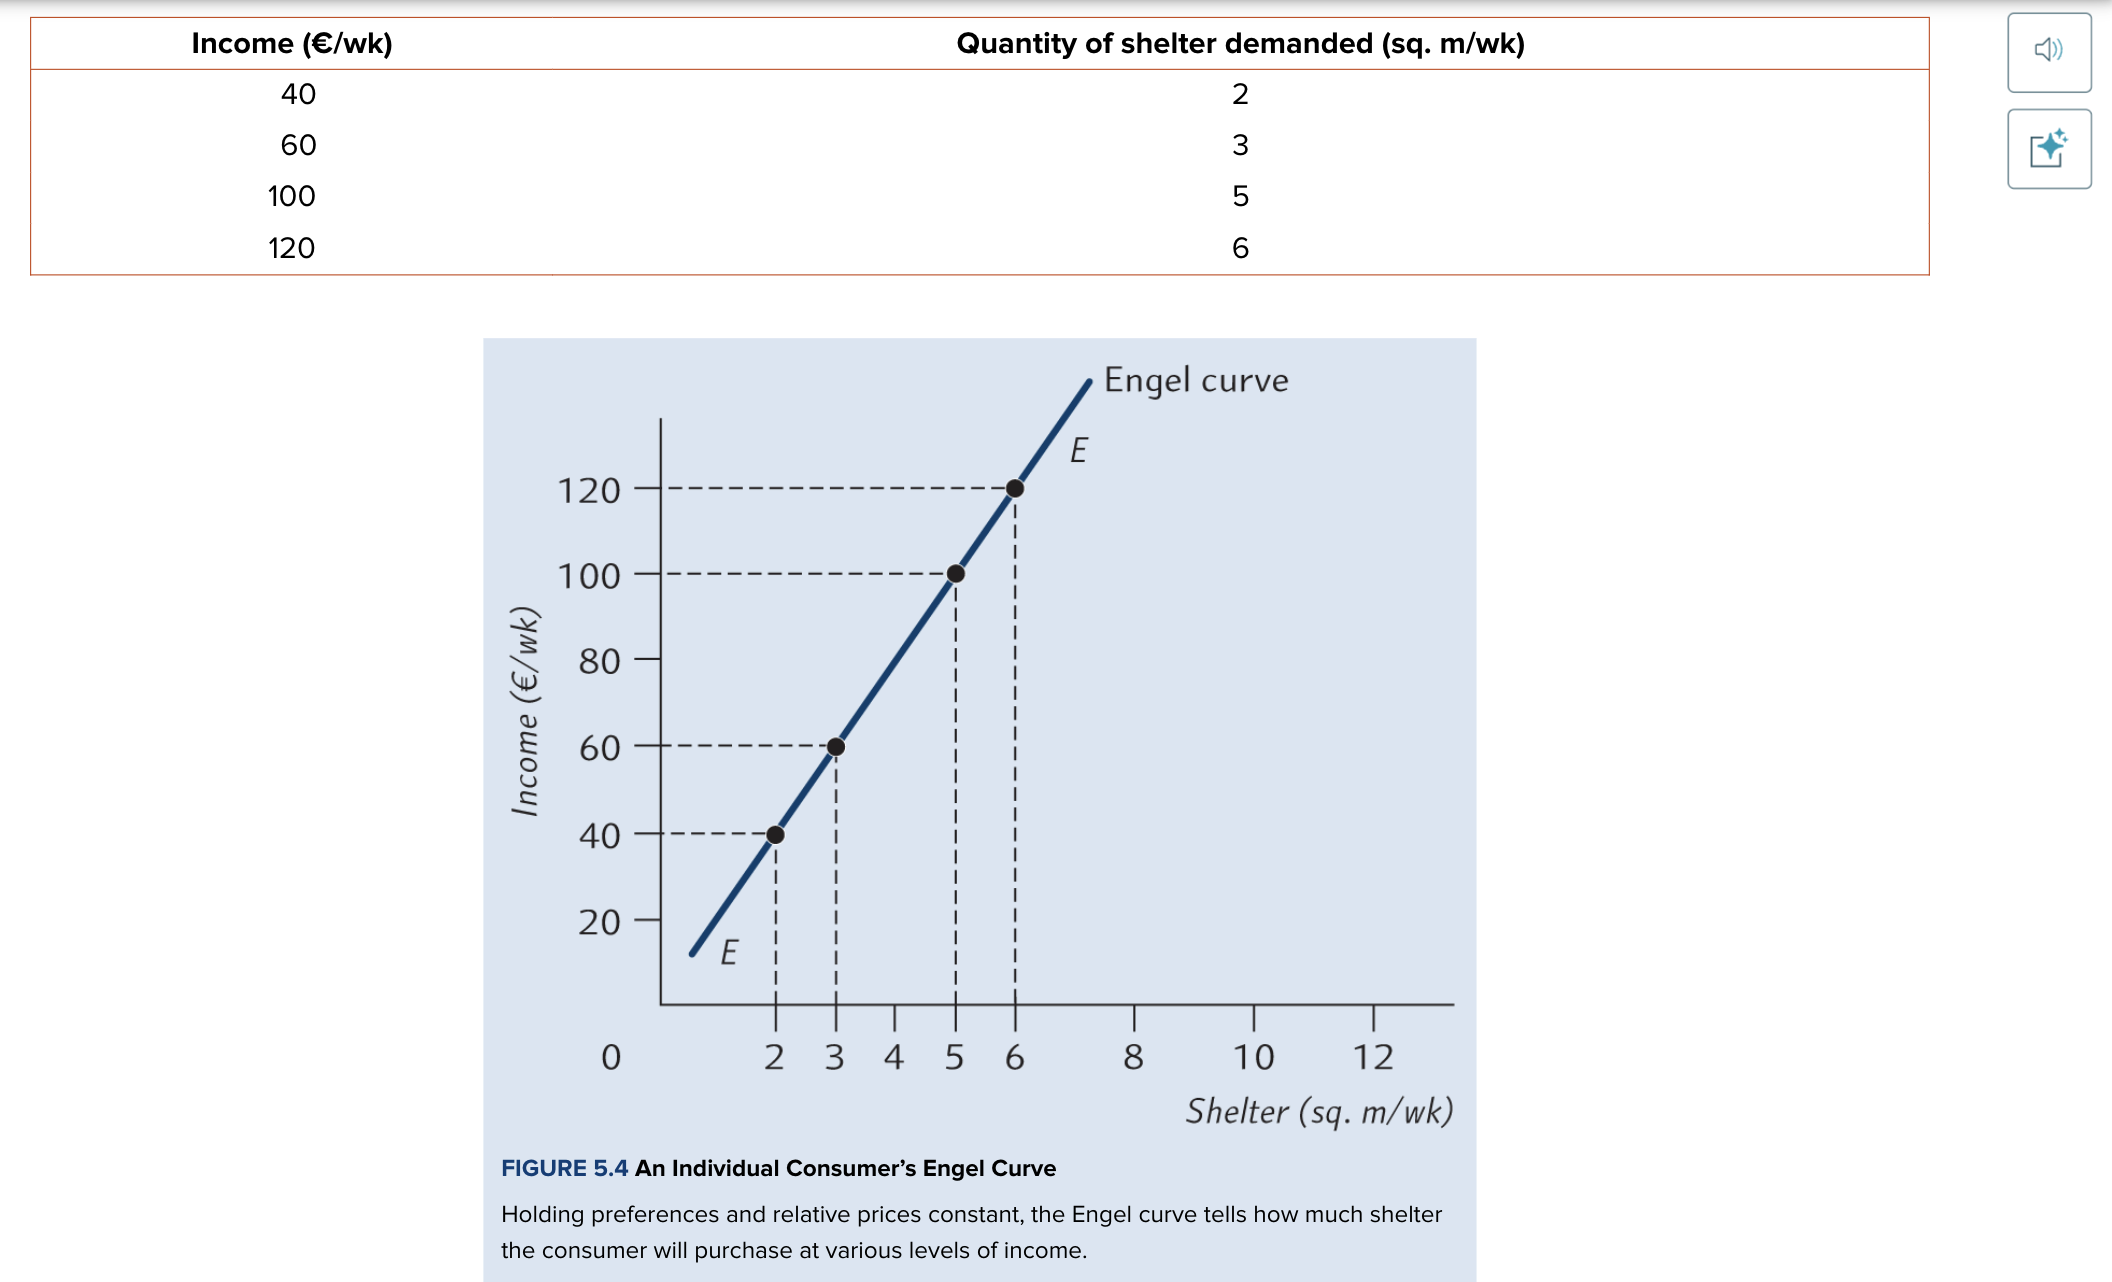
Vary income: 40, 60, 100, $120/week


Engel curve
A curve that plots the relationship between the quantity (of good x) consumed and income
Quantity on x axis
Income on y axis
Shows how QD changes as income changes
Hold preferences and relative prices constant.
How to construct an engel curve?
Take all info from the ICC:
Record the quantity of good x consumed at each income level (at the optimal level)
Plot income on y axis & QD on x axis.
Join the points to form the Engel curve
for this example: As income rises, shelter consumption rises.
What does an individual engel curve show us?
How much of good x a consumer wil buy at diff income levels
Axes of ICC vs engel curve
Curve | Vertical axis | Horizontal axis |
|---|---|---|
ICC | Spending on all other goods (composite good) (per week) | Quantity of good X |
Engel curve | Total income (per week) | Quantity of good X |
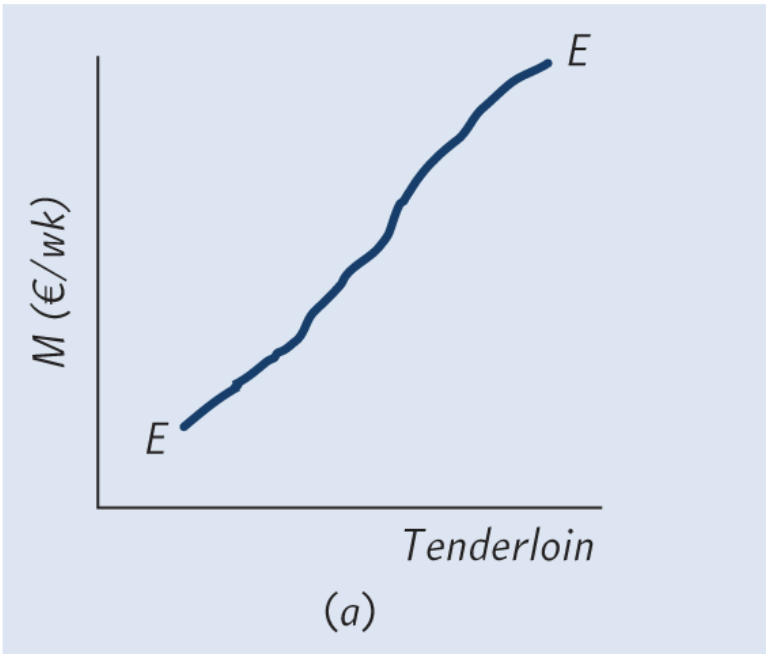
Does an engel curve slope upwards or downwards?
Either
Depends if it is a normal or inferior good

Normal good
Good whose quantity demanded increases as income increases
Engel curve slopes upwards
Inferior good
Good whose quantity demanded decreases as income increases
Engel curve slopes downwards

Why might a good be inferior?
When income rises, consumers may switch to more desirable, more expensive substitutes
Can all goods be inferior for a consumer who spends all their income?
No
They can’t spend less on every good when income rises
The broader the category, the less likely a good is to be inferior (eg meat)
What is the key difference between the ICC and Engel curve?
ICC shows optimal bundles of two goods
Engel curve shows income versus quantity demanded.
2 reasons why a change in price affects quantity demanded?
Substitution effect
Income effect
Substitution effect
Change in QD bc a change in price changes the relative attractiveness of other goods (substitute goods)
What happens to QD if prices increase (substitution effect)
Increase price →
Close subs become more attractive than before
QD decreases
Which way does the substitution effect move quantity demanded?
QD moves in opp direction to price change
Eg P increase → QD decrease
Income effect
Change in QD bc a price change causes a change in real purchasing power (real income)
What happens to purchasing power when prices increase and decrease?
Price ↑ → purchasing power ↓.
Price ↓ → purchasing power ↑.
What does the direction of income effect depend on?
If the good is normal or inferior
What happens to QD if prices increase (income effect)
Prices increase
Real income / purchasing power falls
If normal good: QD decreases
If inferior good: QD increases
How do price decrease effect normal vs inferior goods (only income effect)
Normal: increase PP → increase QD
Inferior: increase PP → decrease QD

Total effect
Substitution effect + income effect
Total effect table
Good | Substitution effect | Income effect | Relationship |
|---|---|---|---|
Normal | Price rises → quantity falls | Quantity falls | Reinforce each other |
Inferior | Price rises → quantity falls | Quantity rises | Oppose each other |
How does a price rise affect demand for a normal good?
Substitution effect: ↑P → ↓QD
Income effect: ↑P → ↓QD
Both effects decrease QD → total effect: QD ↓
How does a price rise affect demand for a inferior good?
Substitution effect: ↑P → ↓QD
Income effect: ↑P → ↑QD
Sub effect decreases QD, income effect increases QD → total effect: depends on which is steonger

Identify the total effect on this graph
Total effect of price increase: movement from A→D
B0 tangent to I0 = BAB = point A
Price of good increases → B1
B1 tangent to I1 at D = BAB = point D
Price increase customer to end up on lower IC
TE: decrease of 8 sq.m/week

How do you identify the substitution effect on a graph?
Movement from A to C along the original indifference curve
Just shows the decrease in quantity of X at optimum bc X is more expensive compared to substitutes

How do you identify the income effect on a graph?
Movement from C→D
Compensated → final bundle

How do you find where the substitution effect is?
You have the og BL (B0)
Price of good increases → BL rotates to B1
Slide B1 outwards parallel (w the same slope) till it becomes a tangent to the og IC (this BL is now the hypothetical B’)
At this point (point C), bundle C is equally attractive as A
The new graph inscts the y axis at 240 → if the consumers income increased by $120 their purchasing power wouldn’t be affected
New BAB: (6,96). Reduction in X by 4 units and increase in composite good Y by 36 units

What does the hypothetical budget line B’ show?
Even if the consumer had enough income to reach the same IC as before the price change, the increase in price would cause them to reduce consumption (bc other close subs are more attractive)
A→C
Effect of substitution effect on QD for consumers w indifference curves that have a conventional convex shape?
Price increase will always reduce consumption

How do you find where the income effect is? (this is a normal good)
Loss of purchasing power → reduction in consumption
C→D
What is the hypothetical budget line used for?
To separate total effect into substitution effect + income effect
Doesn’t represent consumers actual income
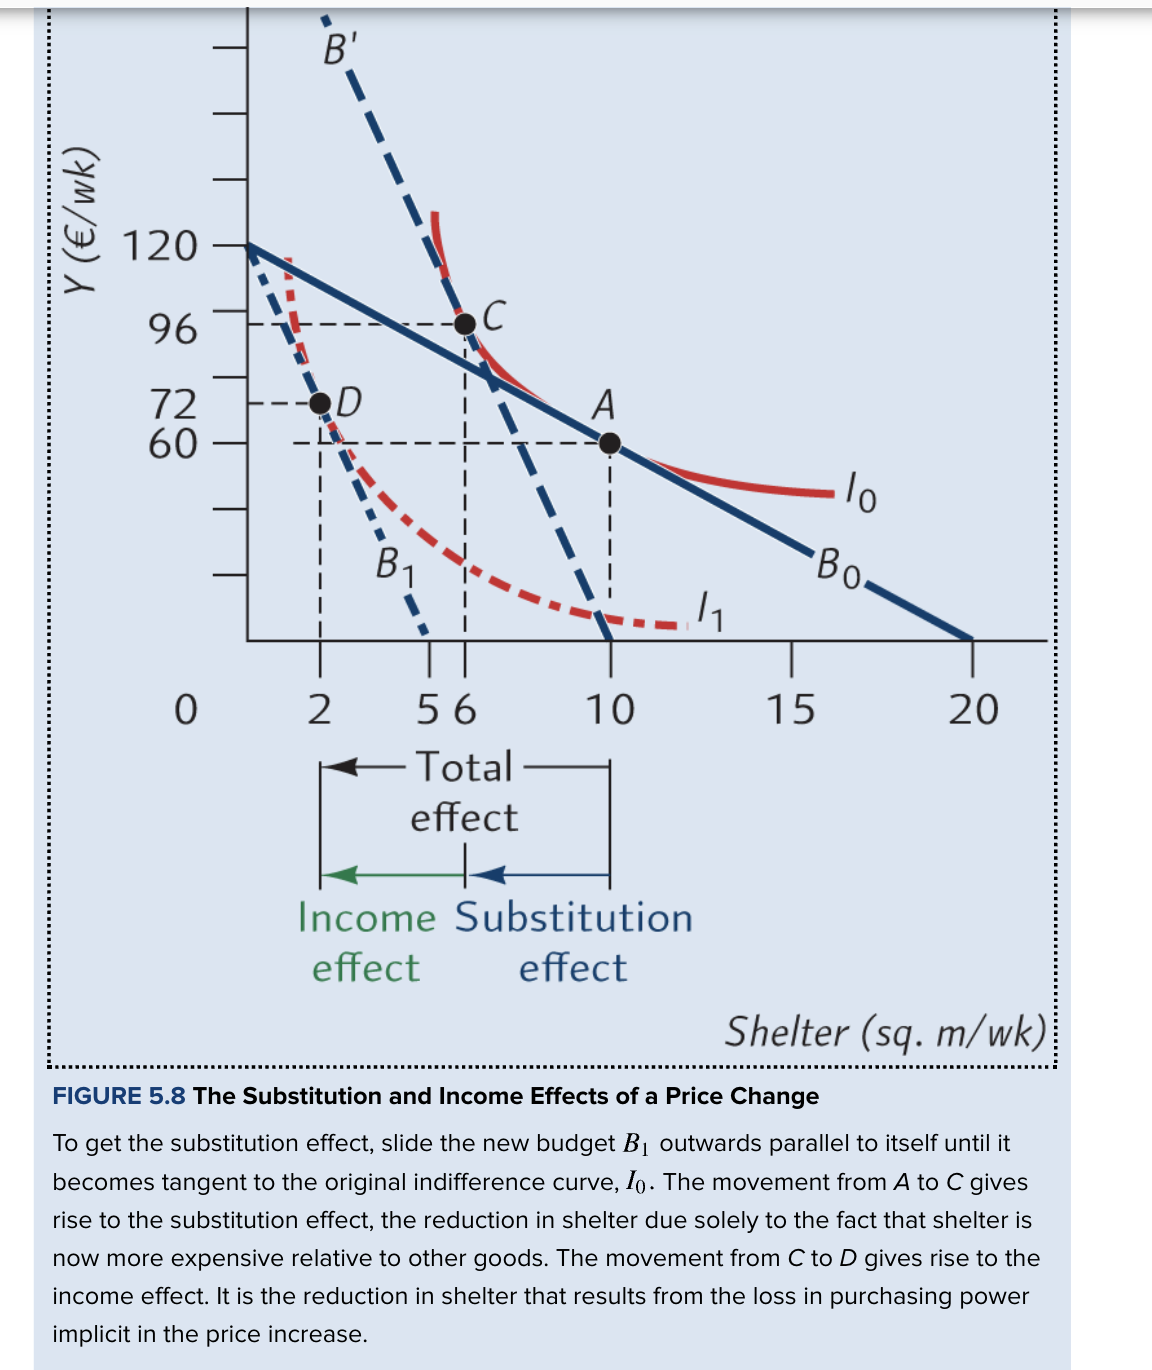
How to draw the hypothetical budget line
Draw the new budget line after the price change.
Shift it parallel outwards until it is tangent to the original indifference curve.
The movement from A to C is the substitution effect.
The movement from C to D is the income effect.
A parallel shift of the new budget line tangent to the original indifference curve.
Why is B’ hypothetical?
For a price increase for a normal good:
It compensates for lost purchasing power to isolate the substitution effect
Eg by increases income
Does the income effect reinforce or offset the substition effect for inferior and normal goods?
Inferior- offset
Normal- reinforce
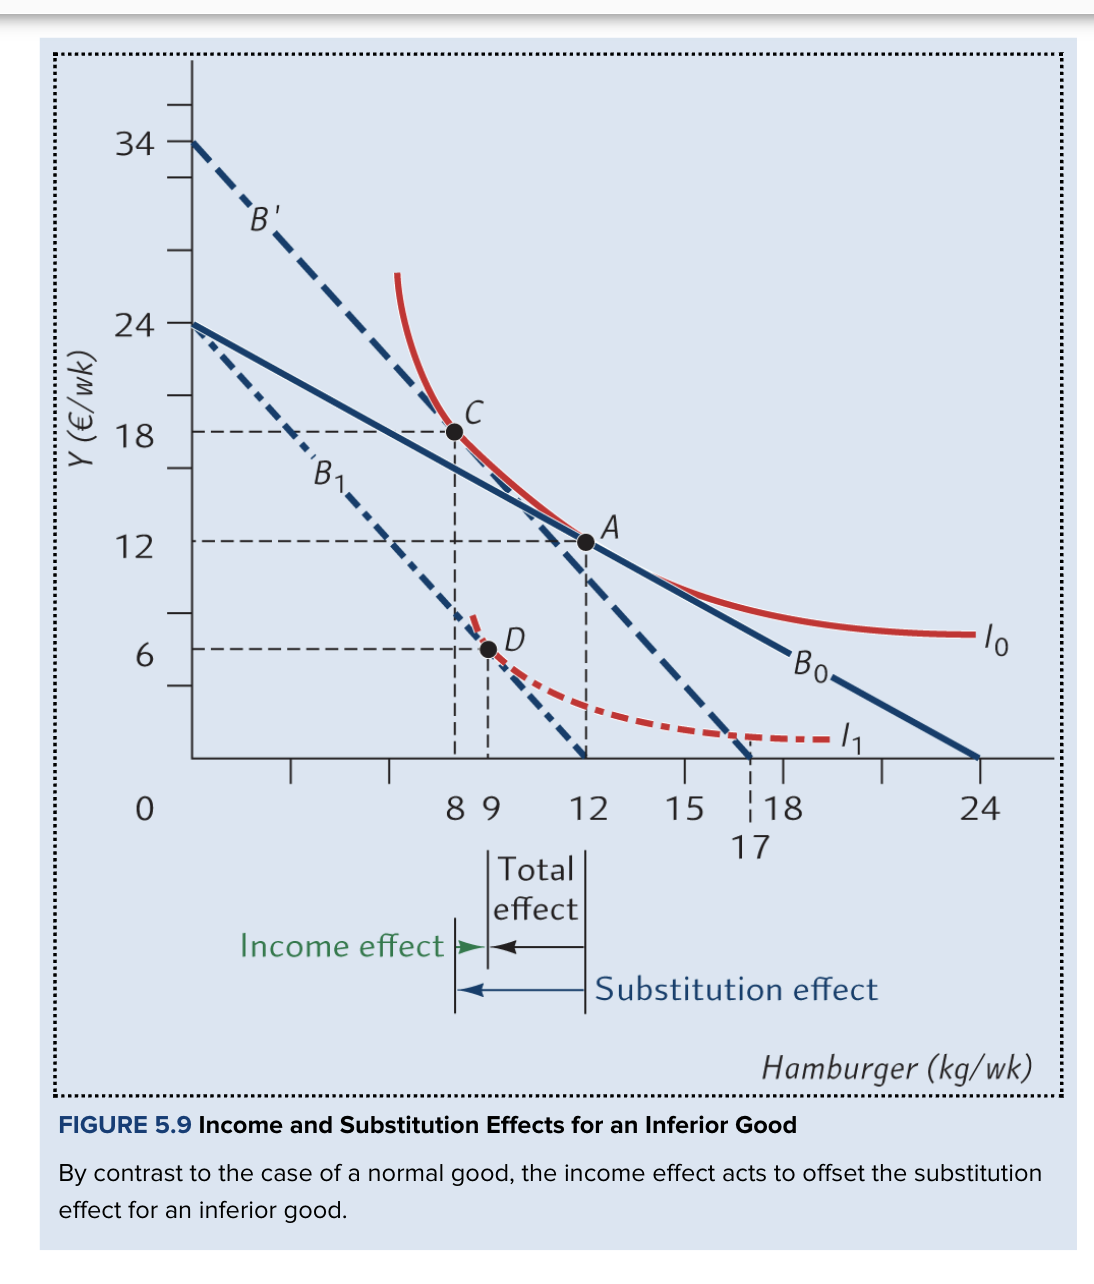
Graph for total effect for inferior good, price increase. Explain
Consumers income is $24/week
Y = $1/unit
Hamburgers = $1/kg, rises to $2/kg
Draw BC (B0)
For B0, BAB = A = (12,12)
Price rises to $2/kg → draw B1
Shift outwards till tangent to B0
B’ shows substitution effect: A→C (8,18)
At B1, BAB = D = (9,6)
TE of price increase: reduce consumption by 3kg/week
Income effect + substitution effect oppose eachother!
Subs effect: reduce by 4kg/week
Income effect: increase by 1kg/week
What do Hicksian and Slutsky decompositions do?
Split the total effect iof a price change into substitution and income effects.
Hicksian vs Slutsky decomposition
Feature | Hicksian | Slutsky |
|---|---|---|
Income adjusted to | Reach original indifference curve | Afford original bundle at the new prices |
Holds constant | Utility | Purchasing power to buy original bundle |
Hicksian: How much income would the consumer need to reach their original indifference curve after the increase in price? (B’) (og method used)
Slutsky: How much income would the consumer need to afford their initial bundle after the increase in price?

What does the Hicksian method hold constant?
Utility
By keeping the consumer on the original indifference curve.
What does the Slutsky method hold constant?
The ability to afford the original bundle.
Do Hicksian and Slutsky usually give very different results?
No
Usually similar results
Giffen good
An inferior food for which QD increases as its prices increases
What causes giffen goods?
|income effect| > |substitution effect|
SE: P increase → QD decreases
IE: P increase → real purchasing power falls → QD for inferior good increases
IE stronger than SE → TE of price increase is to increase QD
Relationship betw giffen goods and inferior goods
All giffen goods are inferior goods
Not all inferior goods are giffen goods
Conditions for giffen goods
Strongly inferior (|IE|>|SE|)
Takes up large share of budget (so price increase significantly reduces PP)
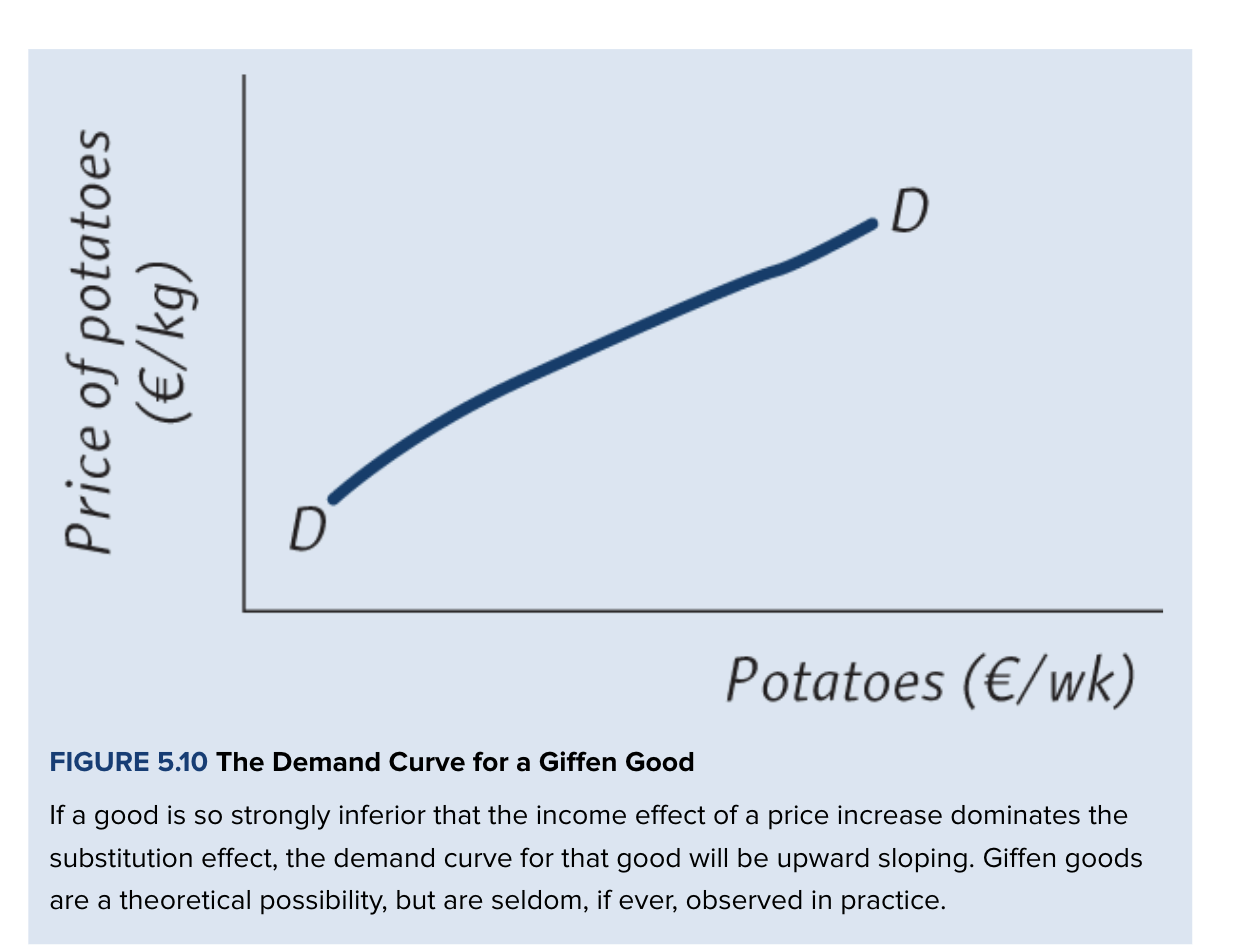
Demand curve for inferior goods vs giffen goods
Inferior- usually downward sloping
Giffen- upward sloping
Are giffen goods common or rare + why?
Rare
Few goods meet both conditions (large share of budget + strongly inferior)
The more broadly defined a good is…
The less likely it is to be inferior
Meat (broad) → normal
Hamburger (specific) → inferior (+ will usually have a lot of close subs)
Example of giffen good
Potatos
But disputed
Poor households → potatos = huge part of diet
Potato prices increased → households became poorer → reduced spending on expensive food (meat) to buy more potatos
Veblen good
Good a consumer may purchase at a high price to signal their wealth
Perfect complements
Goods consumed together in a fixed proportion.
Substitution effect for perfect complements
0
So total effect = income effect
Bc consumers buy in fixed proportion. Don’t want to substitute 1 good for another. Price of 1 increase → RPP decreases → will buy fewer complete sets
Shape of indifference curve for perfect complements
L shaped
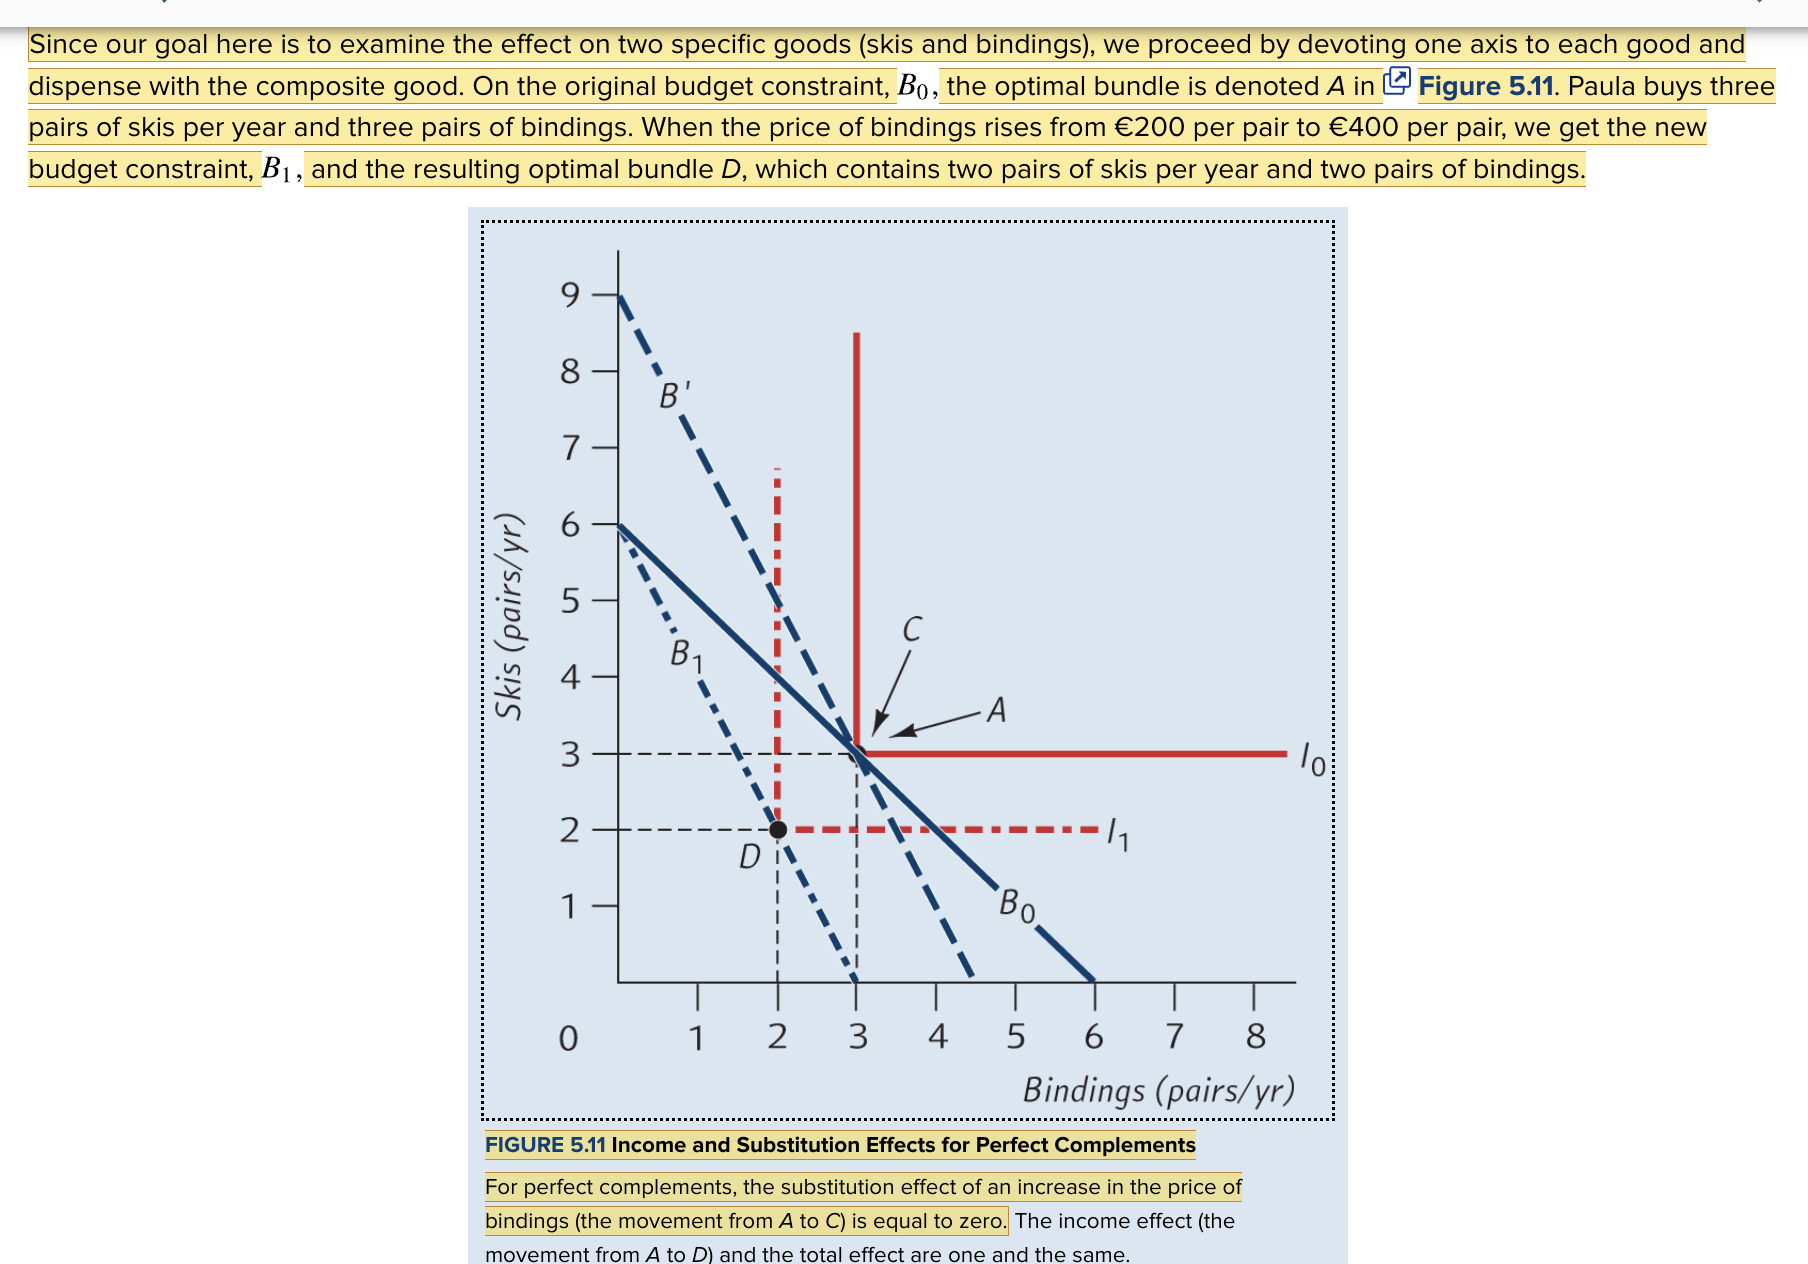
EXAMPLE 5.1 Suppose skis and bindings are perfect, one-for-one complements and Paula spends all her equipment budget of €1,200/yr on these two goods. Skis and bindings each cost €200. What will be the income and substitution effects of an increase in the price of bindings to €400 per pair?
Paula has €1,200/year. Skis and bindings initially cost €200 each.
Initially: 3 pairs of skis + 3 pairs of bindings.
Bindings rise to €400 each.
New bundle: 2 pairs of skis + 2 pairs of bindings.
Effect | Change |
|---|---|
Substitution effect | 0 |
Income effect | 1 fewer pair of skis and 1 fewer pair of bindings |
Total effect | 1 fewer pair of each |
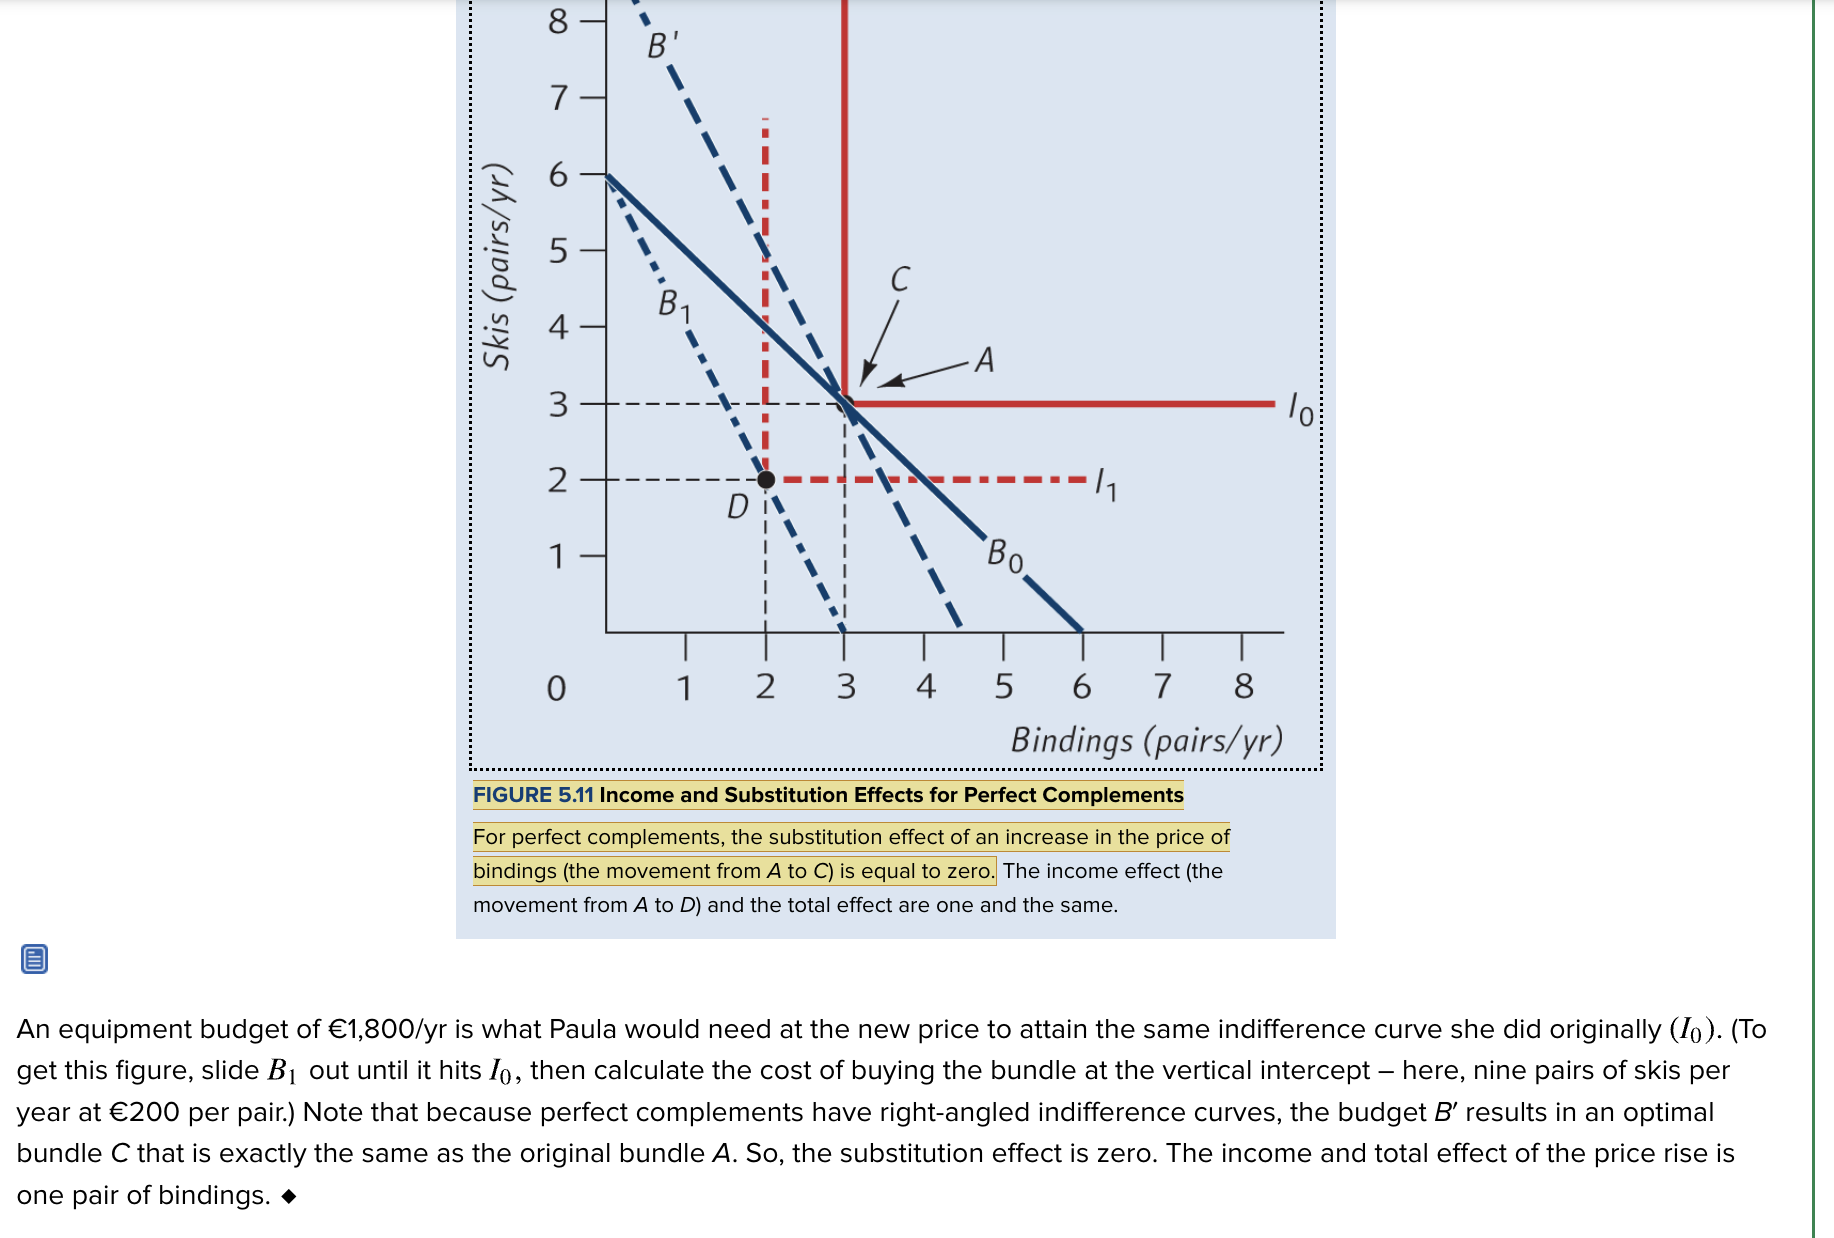
Why is the substitution effect for perfect complements 0?
Consumer can’t gain utility by changing the ratio of the goods
So consumers maintain fixed consumption ratio
What happens when one perfect complement becomes more expensive?
Consumers buy fewer complete sets due to lower purchasing power.
Perfect substitutes
Goods consumers consider interchangeable at a constant rate
Each good equally contributes to utility
Indifferent curves for perfect substitutes
Straight lines
How do consumers choose between perfect substitutes with different prices?
They choose the cheaper one
Why can perfect substitutes have a large substitution effect?
Consumers switch towards the relatively cheaper good
EXAMPLE 5.2 Suppose Pam considers tea and coffee to be perfect one-for-one substitutes and spends €12/wk on these two beverages. Coffee costs €1/cup, while tea costs €1.20/cup. What will be the income and substitution effects of an increase in the price of coffee to €1.50/cup?
Pam has €12/week. Coffee initially costs €1/cup; tea costs €1.20/cup.
Initially: 12 cups of coffee, 0 cups of tea.
Coffee rises to €1.50/cup, making tea cheaper.
New bundle: 10 cups of tea, 0 cups of coffee.
Effect | Change |
|---|---|
Substitution effect | Switch from 12 cups of coffee to 12 cups of tea |
Income effect | 0 cups |
Total effect | Switch from coffee to 10 cups of tea |

Perfect substitutes vs perfect complements
Feature | Perfect complements | Perfect substitutes |
|---|---|---|
Indifference curves | L-shaped | Straight lines |
Consumption pattern | Fixed proportion | Choose based on relative prices |
Substitution effect | Zero | Can be large |
Income effect | Equals total effect | Can be zero |
Typical response to price rise | Buy fewer complete sets | Switch to the relatively cheaper good |
What determines the substitution effect for perfect substitutes?
How relative prices change
+ whether the preferred good switches
(idk explain this)
What determines responsiveness of consumption to price changes?
The size of the:
Substitution effect
Income effect
What determines the size of the income + substitution effect?
Substitution possibilities: if alternatives are available
Budget share: how much of a consumer’s income is spent on the good
Why is QD of salt highly insensitive to changes in price (inelastic)?
Few/no close subs → small substitution effect
Small portion of income spent → small income effect

What feature of the graph shows that salt has no close substitues?
Indifference curves are (almost) right angles
So small substitution effect
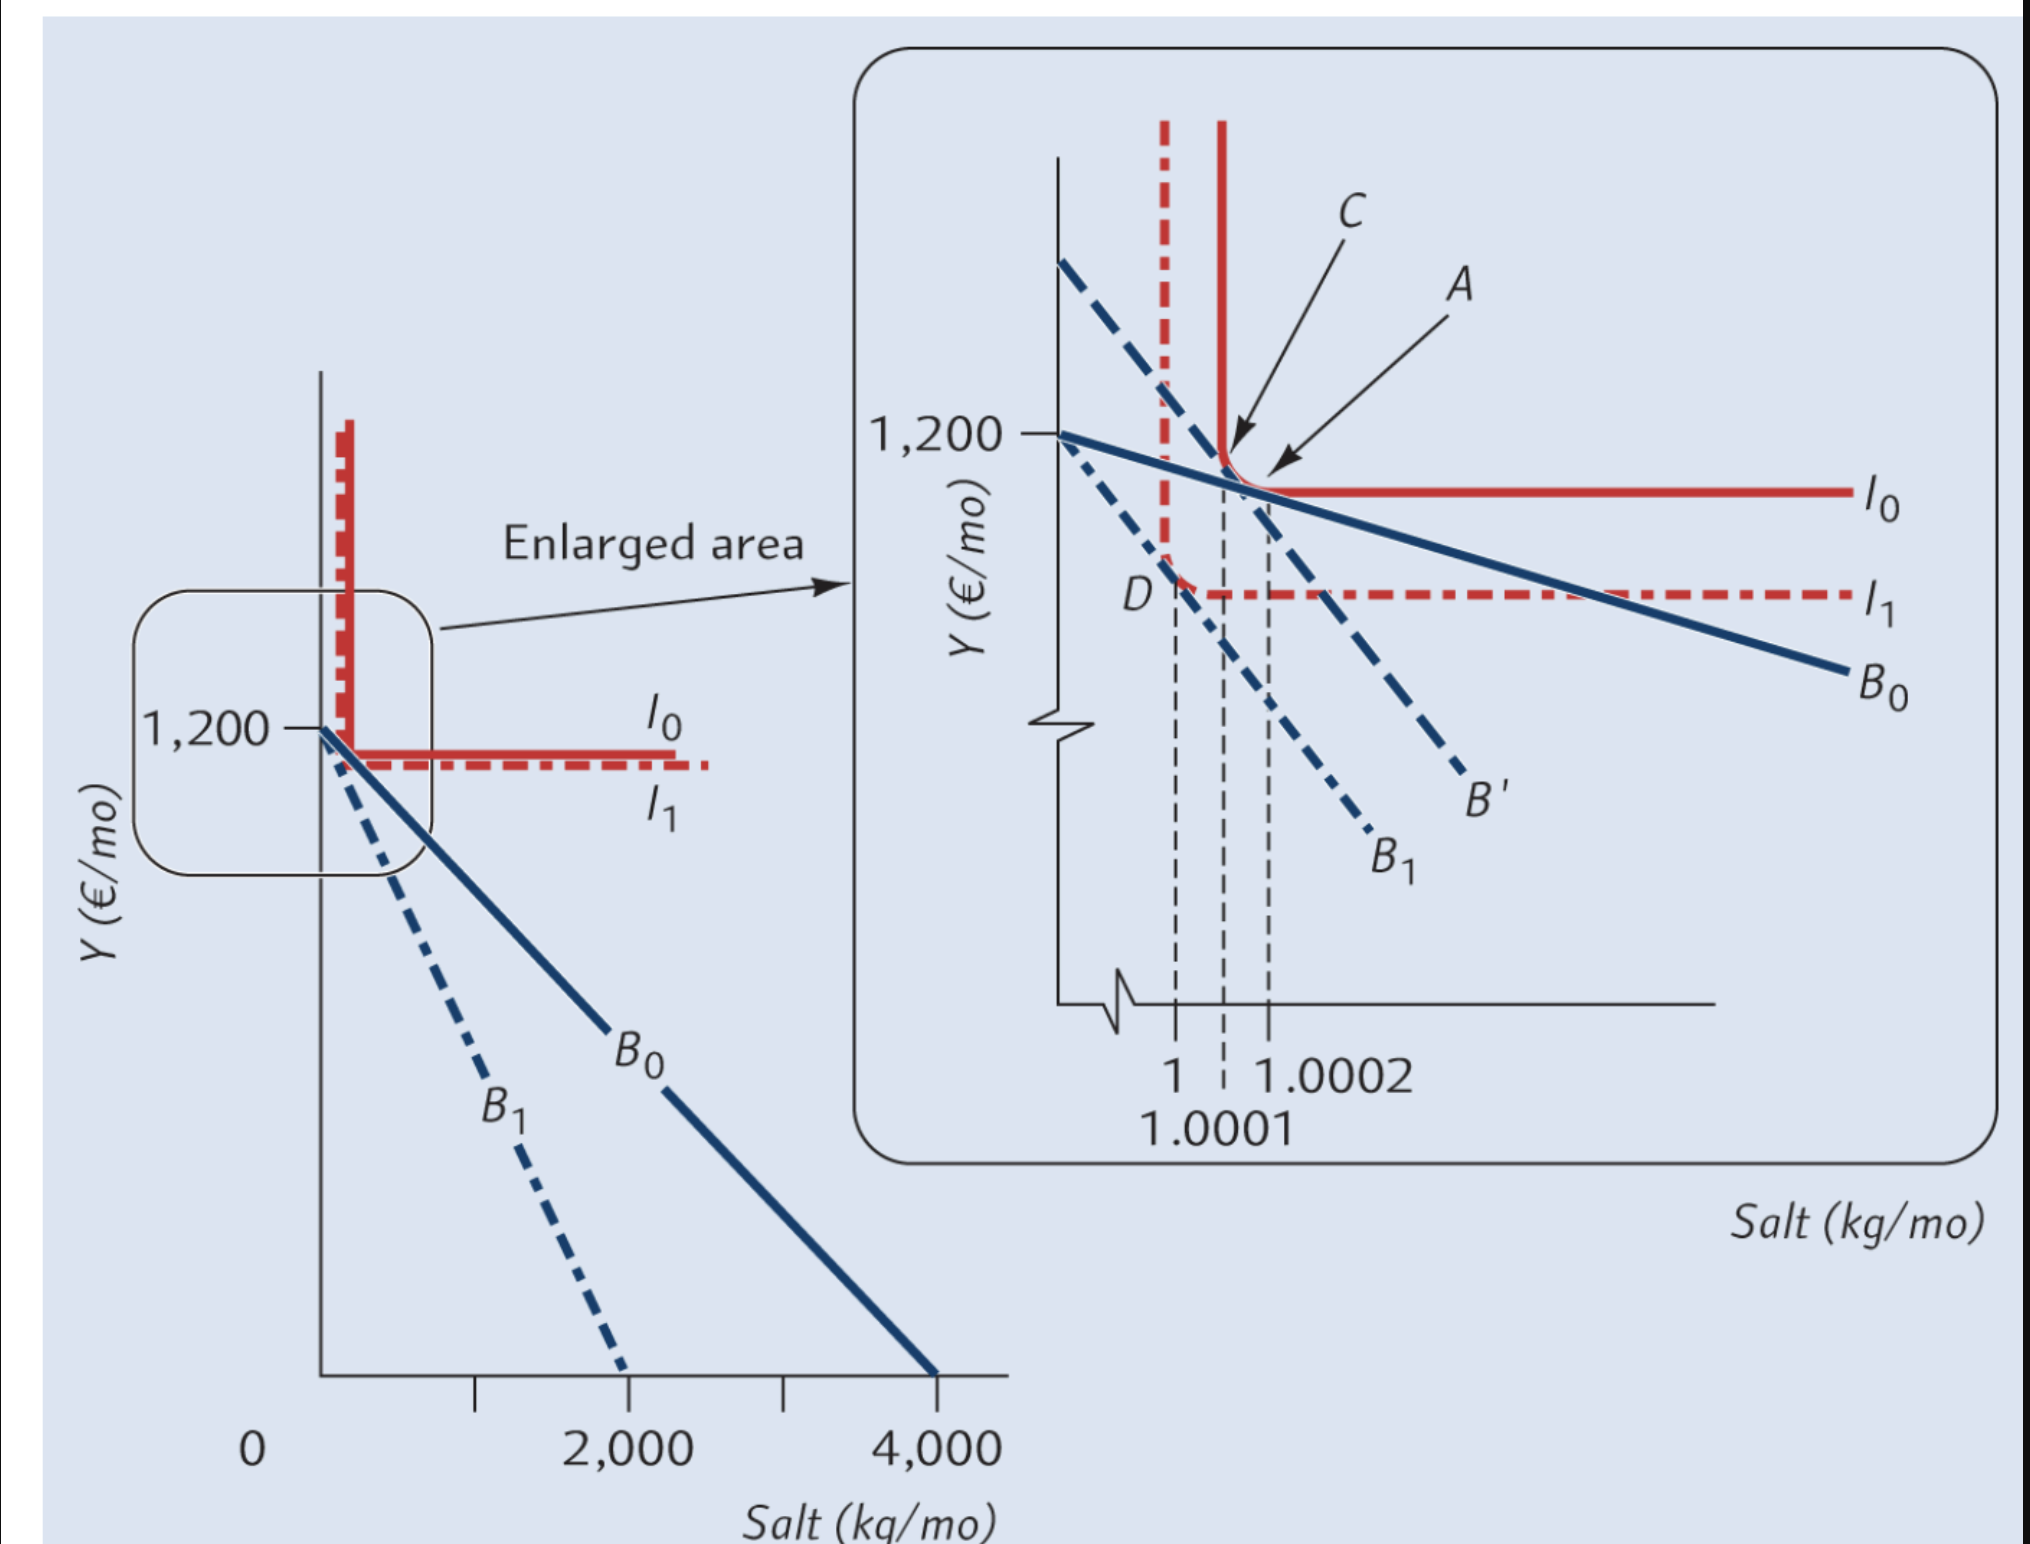
What feature of the graph shows that salt has a negligable budget share?
Cusp of ICs occur at v small quantities
Small income effect (tiny proportion of expenditure)

When will the total effect of a price change be really small?
Og equilibrium bundle lies near vertical intercept of the budget constaint → causes small income effect (C→D)
Near the pivot point of budget constaint → large rotation produces small movement
Indifference curves have a nearly right-angled shape → causes small sub effect (A→C)
Why is housing price sensitive?
Many substitution possibilities (cheaper / smaller / less central housing) → high sub effect
Large budget share → high income effect
Generally, what makes a good more price sensitive?
Many close subs → large sub effect.
Large share of income → large income effect

What are the two conditions for a small total effect, eg salt?
Og BAB is near the vertical intercept
Indifference curves are nearly right-angled

What feature of this graph represents that there are lots of substitution possibilities?
ICs have smooth, convex shape
Large sub effect