BIOL1501: Ecology LAB EXAM 1
 Call Kai
 Learn
 Practice Test
 Spaced Repetition
 Match
 Flashcards
 Knowt Play
1/38

Earn XP
Description and Tags
notes from lab pre-reading
Name | Mastery | Learn | Test | Matching | Spaced | Call with Kai | Chat |
|---|
No analytics yet
Send a link to your students to track their progress
39 Terms
Lab 1 Learning Goals
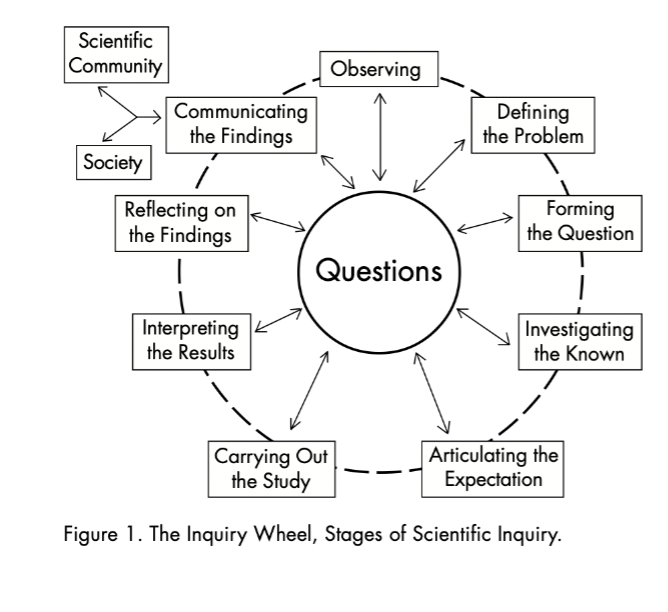
Discuss what is – and what is not - science
● Consider biases and sources of error involved in data interpretation
● Describe main characteristics and goals of manipulative and natural experiments
● Identify different ecological interactions in the local urban environment
● Initiate the use of the iNaturalist platform as a means to become an amateur naturalist and citizen scientist
Hypothesis Testing
Hypotheses aim to understand the relationships between variables
variables
the factors that can change or be measured in ann experiment.
scientific question
The main source of inquiry in your study that tries to understand the relationship between variables to explain an observed phenomenon
hypothesis
testable explanation of an observed phenomenon
prediction
a specific result you expect to find if your hypothesis is correct
experimental design
for systematically testing the hypothesis is developed (after hypothesis has been developed) → meant to test specific predictions that arise from the hypothesis about how a predictor variable affects the response variable of interest
manipulative experiment
the researcher manipulates the predictor variable and measures how a response variable changes due to these alterations
independent variable
predictor variable
response variable
dependent variable
natural experiment
No interference with the outcome of the study by changing or controlling a variable; examines the natural variation that is present in living systems; predictor variable → explanatory variable
response variable → observational variable
extraneous variables
unwanted factors that create experimental error
random error
inconsitent deviations in data caused by natural variation
systematic error
refers to consistent, directional shifts in data caused by faculty tools (mis-calibrated scale) or researcher bias (sampling only the edges of a forest instead of the interior)
ecological interactions
mutualism (+/+)
antagonism (-/+)
commensalism (0/+)
competition (-/-)
amensalism (0/-)
neutralism (0/0)
plant-pollinator interactions
mutualistic interaction
animal pollinators: any animal that acts a vector for a flowering plant’s reproduction, whereby pollen is transferred from the anther (male) to stigma (female part of plant)
co-evolution
when two organims evolve in convert with each other
pollinator syndromes
characteristics of a flower (odor, shape, color)

bees
very important ecologically

green roofs
Green roofs are roofs that are completely or partially covered with plants/vegetation. The term “green” refers to the environmental benefits, not to the color of the vegetation growing on the roof. The floor of a green roof is typically comprised of several layers that support proper growth of vegetation and protect the interior of the building from damage by water and plant root growth (Figure 4). One important function of green roofs is that they promote species diversity in urban environments by offering patches of habitat for plants, birds, and invertebrate animals, such as insects
Lab 3 Learning Goals
Describe the important sections of a lab report
● Be familiar with certain terms in descriptive statistics, including: mean, range, central tendency, variability, and standard deviation
● Use inferential statistics (specifically, a t-test) to compare number of bees per flower on different green roof terraces to test the hypothesis that terrace height impacts bee abundance
range
spread of your data calculated as the difference between your highest and lowest value
ex: consider the following data set about the length of 5 lizards: 6 cm, 4 cm, 9 cm, 8 cm, 11 cm. The range of the data is 4-11cm
central tendency
refers to the degree to which sample observations are clustered somewhere close to the middle of the range of the entire set of observations
to visualize: plot a histogram with y-axis = freq. of each sample observation and x-axis = range of observation values that are measured

mean
the sum of all observations/the number of observations (x bar)

normal distributions
represented by a curve that is bell-shaped with the peak of the curve centered at the mean (the area under the curve represents the chance of finding observed values within a data set)


standard deviation of mean
steps away from the mean (creates a range)

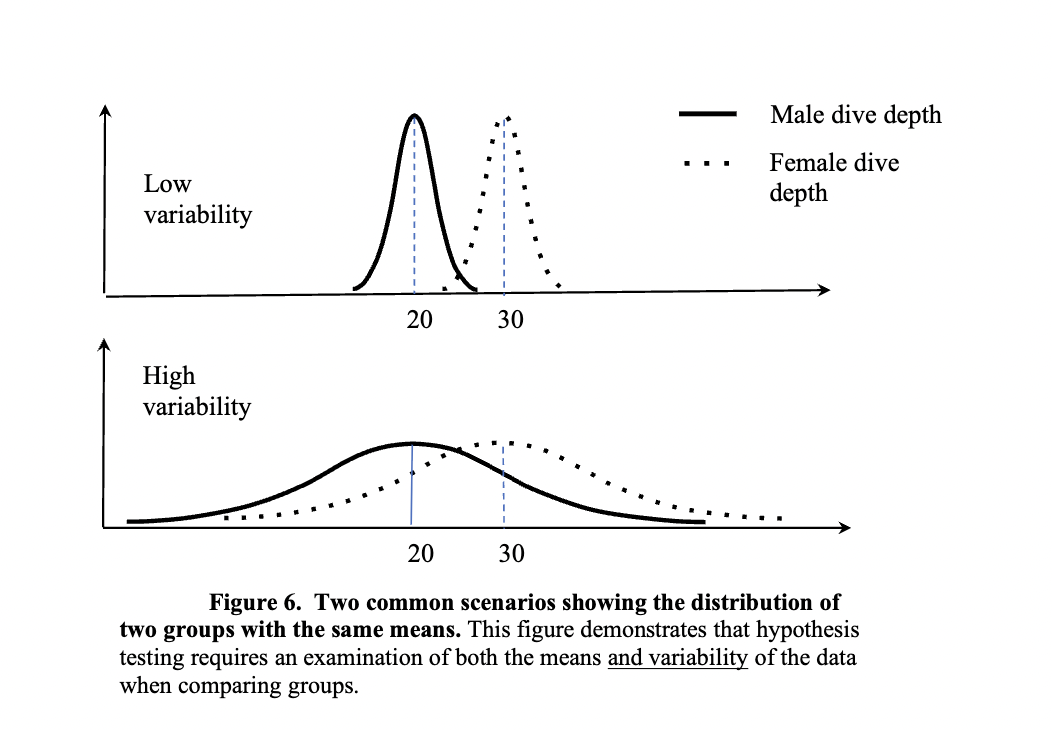
comparing 2 groups
How can we know if the difference observed between group means is enough to confidently say that the differences observed between the two samples are not due to random chance and that they represent two populations (groups)? We can use a variety of test statistics to quantify the differences and to then decide if we are willing to reject the hypothesis that states that there is no difference between the two groups (with a small risk of this hypothesis actually being correct). To compare two groups that have independent data (data in condition A is not related to data in condition B), we can use a t-test,
t-test
inferential statistical test to determine if the means of two groups is significant enough to reject the null hypothesis (states there is no difference between 2 groups)
provides t-value scale of 0-1)
comparison between T-value and t-value give probability estimates P-value


T-value
standardized value from formula
Lab 4 Learning Goals
To describe the characteristics and benefits of green roofs
- To understand why species diversity is important and how it can change over time
- To distinguish between species richness and species evenness
- To be able to calculate and interpret Simpson’s Reciprocal Index, a measure of species diversity
species diversity
refers to the number of each species and abundance of individuals per species
species richness
total number of species in an ecosystem
species evennnes
examines total number of individuals per species in an ecosystem and how similar they are for each species

simpson’s reciprocal index
1/measurement of species dominance, values ranging from 0 - 1
sensitive to changes in the abundance of individuals → needs a good sample size

Lab 5 Learning Goals
To describe characteristics and benefits of urban forests
- To identify different leaf types: broad, scale and needle-like and different leaf arrangements: compound and simple
- To use an identification guide to identify NYC street trees by species and health status using physical characteristics
- To describe Santamour’s Formula and understand how it is used to manage urban forests
- To consider how urban forests contribute to environmental justice and discuss the role that societal factors contribute to inequities
benefits of urban forests
rainwater management
temperature regulation
public health benefits
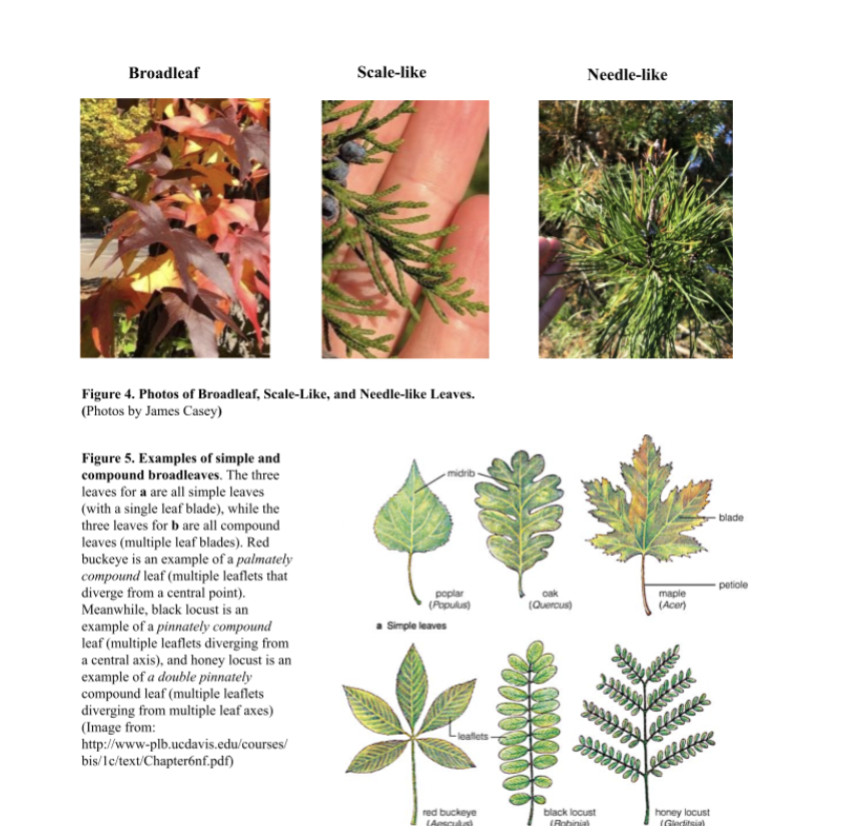
tree-species identification
leaf types: needle-like, scale-like, broadleaf
broadleaf types: single/compount
compound types: palmately/pinnately
trunks, roots, leaves, and branches all also indicate the health of a tree

diameter
circumference/pi
can be measured using diameter at breast height
Lab 2 Learning Goals
Use Google Scholar to search the scientific literature
● Practice oral scientific communication by presenting to the class
● Collect field data to test a hypothesis about bee abundance on green roof terraces