Week 2: Disaster and Risk research
0.0(0)
Studied by 0 people Call Kai
 Learn
Learn Practice Test
 Spaced Repetition
 Match
Match Flashcards
 Knowt Play
Card Sorting
1/39

Earn XP
Description and Tags
Last updated 12:10 PM on 10/11/26
Name | Mastery | Learn | Test | Matching | Spaced | Call with Kai | Chat |
|---|
No analytics yet
Send a link to your students to track their progress
40 Terms
1
New cards
Documenting disasters
Maintaining databases on disaster events can be difficult. Why?
* disasters can co-occur (hurricanes cause floods, earthquakes cause landslides, etc.)
* mortality can be difficult. to count (famine, epidemics)
* a general lack of census taking (in developing countries)
* disasters can co-occur (hurricanes cause floods, earthquakes cause landslides, etc.)
* mortality can be difficult. to count (famine, epidemics)
* a general lack of census taking (in developing countries)
2
New cards
Identifying disasters
Some people may consider certain events to be disasters while other people may not
eg.
* Eastern Ontario/ Southern ice storm
* Walkerton water crisis - E-Coli.
* Canada/US 14-hour power blackout
* love canal toxic waste spill
* three mile island nuclear meltdown
\
\*therefore, specific definition of a disaster has been developed
eg.
* Eastern Ontario/ Southern ice storm
* Walkerton water crisis - E-Coli.
* Canada/US 14-hour power blackout
* love canal toxic waste spill
* three mile island nuclear meltdown
\
\*therefore, specific definition of a disaster has been developed
3
New cards
\
Disaster threshold (CRED)
Disaster threshold (CRED)
What events officially qualify as a ‘disaster’
Threshold developed by Centre for Research on the epidemiology of disasters (CRED)
\
At least 10 deaths per event
or
100 or more persons affected (injured, homeless, etc)
or
gov’t. in the area declares a disaster
or plea for international assistance
Threshold developed by Centre for Research on the epidemiology of disasters (CRED)
\
At least 10 deaths per event
or
100 or more persons affected (injured, homeless, etc)
or
gov’t. in the area declares a disaster
or plea for international assistance
4
New cards
Exceptions to the CRED threshold:
* for droughts or famines, at least 2000 persons affected
* for technological disasters, 5 or more deaths per event
* for technological disasters, 5 or more deaths per event
5
New cards
Statistical data is reported in _____ ________
absolute terms
(number of casualties, billions of dollars in damage, etc.)
(number of casualties, billions of dollars in damage, etc.)
6
New cards
The impact of losses is felt differently from one place to the next
**example:**
* 10 fishers lost in a remote village of 200 people versus 10 factory workers in a city of 200,000
* therefore, statistics must be placed in a community/ regional context
* 10 fishers lost in a remote village of 200 people versus 10 factory workers in a city of 200,000
* therefore, statistics must be placed in a community/ regional context
7
New cards
Media and disasters
the media concentrates on:
* human interest
* visual impact
* events prioritized according to a North American perspective
* human interest
* visual impact
* events prioritized according to a North American perspective
8
New cards
A study found that an event causing the death of one North American was granted the same amount of reporting time to the deaths of:
_ Eastern Europeans
__ Middle Easterners
_ Latin Americans
__ Asians
\
_ Eastern Europeans
__ Middle Easterners
_ Latin Americans
__ Asians
\
3 Eastern Europeans
11 Middle Easterners
9 Latin Americans
12 Asians
11 Middle Easterners
9 Latin Americans
12 Asians
9
New cards
Impacts of Disaster
Impacts vary greatly by disaster type
\
**example:**
* earthquakes tend to cause more deaths than tornadoes
* floods affect more people (homelessness) than most disasters but cause fewer deaths
* droughts mainly cause economic losses (agriculture) in developed countries but they can lead to famine in developing countries
* technological disasters are more likely to occur in developed countries
\
**example:**
* earthquakes tend to cause more deaths than tornadoes
* floods affect more people (homelessness) than most disasters but cause fewer deaths
* droughts mainly cause economic losses (agriculture) in developed countries but they can lead to famine in developing countries
* technological disasters are more likely to occur in developed countries
10
New cards
Impact trends
\
Globally, most impacts from disasters have _______ over time:
\
Globally, most impacts from disasters have _______ over time:
Globally, most impacts from disasters have increased over time:
* property damage
* economic losses
* persons injured
* deaths
\
Impacts have not increased in equal proportions
* economic losses have increased at a faster rate than deaths
* property damage
* economic losses
* persons injured
* deaths
\
Impacts have not increased in equal proportions
* economic losses have increased at a faster rate than deaths
11
New cards
Increasing Impacts
Why are disaster impacts increasing?
\
Why are developing countries more affected?
\
Example:
* Haiti earthquake
\
Why are developing countries more affected?
\
Example:
* Haiti earthquake
12
New cards
Haiti Earthquake
Haiti has been the poorest country in the western hemisphere for many years
\
A __**M7.0 earthquake**__ occurred Jan.12, 2010
(strong but not severe)
\
* **One of the worst natural disasters in modern history; the death toll was over 160,000**
* The epicentre was 25km from Port-au-prince (the capital city). Most buildings in the city were destroyed
* occurred along a __**transform fault**__
* Landslides affected slums in the hillsides surrounding the city
* presidential palace collapsed
\
A __**M7.0 earthquake**__ occurred Jan.12, 2010
(strong but not severe)
\
* **One of the worst natural disasters in modern history; the death toll was over 160,000**
* The epicentre was 25km from Port-au-prince (the capital city). Most buildings in the city were destroyed
* occurred along a __**transform fault**__
* Landslides affected slums in the hillsides surrounding the city
* presidential palace collapsed
13
New cards
Reasons for Increases in Impacts: **Land Pressure**
Approximately 1 billion people live on degraded land
* poverty and lack of land availability leads to unsustainable farming practices
examples:
* deforestation
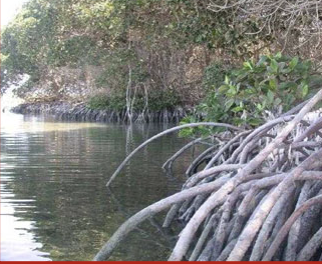
* soil erosion
* clearing mangroves for monoculture
* mangroves protect against floods
* only planting one crop, reducing biodiversity
* (see image)
* poverty and lack of land availability leads to unsustainable farming practices
examples:
* deforestation
* soil erosion
* clearing mangroves for monoculture
* mangroves protect against floods
* only planting one crop, reducing biodiversity
* (see image)
14
New cards
Reasons for Increases in Impacts: Urbanization
Around the world, people are increasingly moving from rural areas to urban areas
* slums and squatter settlements are rapidly growing in developing countries
* slums and squatter settlements are rapidly growing in developing countries
15
New cards
Vulnerability to diasater
(resiliency vs reliablity)
\
both are _____ in developing countries
(resiliency vs reliablity)
\
both are _____ in developing countries
**Resiliency**
* the rate of recovery from the occurrence of the event
\
\
**Reliability**
* the frequency with which protective devices against disasters can withstand disaster
\
\*both tend to be lower in developing countries
* the rate of recovery from the occurrence of the event
\
\
**Reliability**
* the frequency with which protective devices against disasters can withstand disaster
\
\*both tend to be lower in developing countries
16
New cards
Risk Assessment vs Risk Management
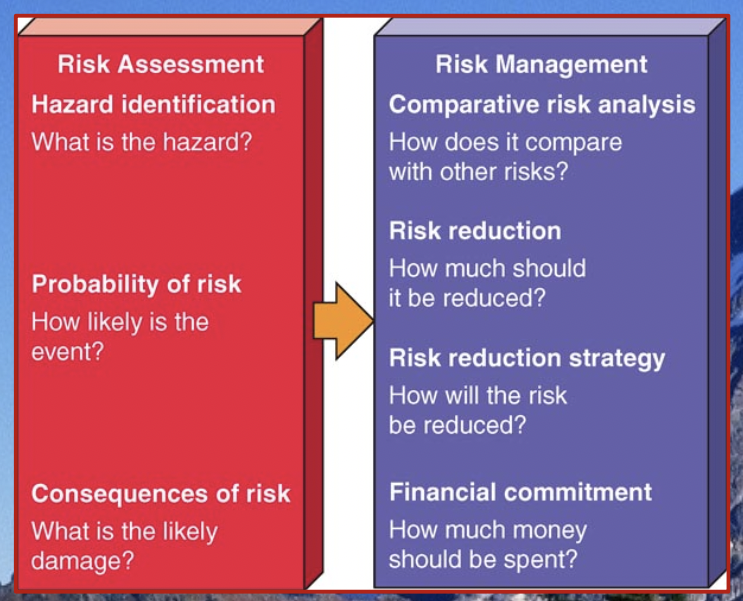
__**Risk Assessment**__
* Involves estimating the likelihood that a particular event will harm human health
\
__**Risk Management**__
* Involves deciding whether or how to reduce a particular risk and at what cost
* Involves estimating the likelihood that a particular event will harm human health
\
__**Risk Management**__
* Involves deciding whether or how to reduce a particular risk and at what cost
17
New cards
Risk
Risk is viewed by individuals as subjective.
\
What we as individuals consider to be risky is based on our own probabilistic risk assessments.
\
Risk assessments are not a modern phenomenon.
\
Example:
* there are religious examples that aim to assess the risk to the soul based on moral conduct
\
What we as individuals consider to be risky is based on our own probabilistic risk assessments.
\
Risk assessments are not a modern phenomenon.
\
Example:
* there are religious examples that aim to assess the risk to the soul based on moral conduct
18
New cards
Probabilistic risk assessment
Pascal (1657)
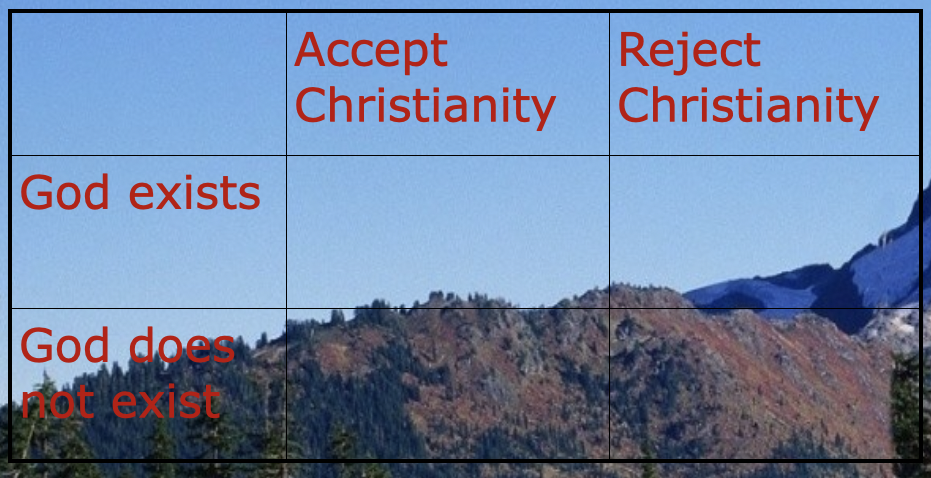
The value of accepting Christianity outweighs the value of rejecting it because the risk of rejecting it is too high
\
\
a: Soul saved
b: eternal damnation
c: miss out on pagan fun
d: pagans not “punished”
The value of accepting Christianity outweighs the value of rejecting it because the risk of rejecting it is too high
\
\
a: Soul saved
b: eternal damnation
c: miss out on pagan fun
d: pagans not “punished”
19
New cards
Event Data
It is best to have at least 100 years of Data
* This amount of data is not available for several hazards (high magnitude earthquakes, nuclear accidents, etc)
* This amount of data is not available for several hazards (high magnitude earthquakes, nuclear accidents, etc)
20
New cards
Economic loss data
often less available than event data
* there are many currencies worldwide; values must constantly be adjusted for inflation
* there are many currencies worldwide; values must constantly be adjusted for inflation
21
New cards
Statistical analysis
R = P \* L
\
R = Risk
P = Probability
L = Loss (economic, health, etc.)
\
R = Risk
P = Probability
L = Loss (economic, health, etc.)
22
New cards
Interpreting probabilities
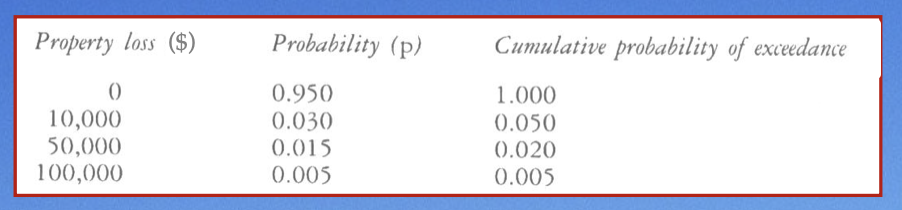
Cumulative probabilities sum to 1 therefore we can read each probability as a percent
\
example:
If an event has a probability of 0.01, that event has a 1% chance of happening
\
example:
If an event has a probability of 0.01, that event has a 1% chance of happening
23
New cards
Based on the data above, what is the total overall property loss risk?
risk for each (top to bottom)
0 x 0.0950 = 0
10,000 x 0.030 = $300
50,000 x 0.015 = $750
100,000 x 0.005 = $500
add the totals up:
$
\
0 x 0.0950 = 0
10,000 x 0.030 = $300
50,000 x 0.015 = $750
100,000 x 0.005 = $500
add the totals up:
$
\
24
New cards
Event tree
May be used when the event database is too small
* Chain of events leading to a disaster must be known
* Probabilities within the chain must be calculable
* Chain of events leading to a disaster must be known
* Probabilities within the chain must be calculable
25
New cards
Estimating risk
example:
What is the risk associated with a technological system?
* the reliability of a technological system is a product of 2 factors
\
system reliability:
human reliability vs system reliability
\
\
What is the risk associated with a technological system?
* the reliability of a technological system is a product of 2 factors
\
system reliability:
human reliability vs system reliability
\
\
26
New cards
With careful design and maintenance, a system such as a nuclear power plant or a space shuttle can achieve a high degree of technological reliability.
Human reliability is usually lower than technology reliability and is difficult to predict
\
Suppose the technological reliability of a nuclear power plant is 95% and the human reliability is 75%.
\
The overall system reliability is then 71%
(95 x 0.75 = 71)
\
Suppose the technological reliability of a nuclear power plant is 95% and the human reliability is 75%.
\
The overall system reliability is then 71%
(95 x 0.75 = 71)
27
New cards
human reliability
Even if we could make the technology 100% reliable in the previous example, the overall system reliability would be 75%.
(100 x 0.75 = 75)
\
The dependence of even the most carefully designed systems on unpredictable human reliability helps explain disasters such as the Chernobyl nuclear power plant meltdown and the *Challenger* and *Columbia* space shuttle explosions.
(100 x 0.75 = 75)
\
The dependence of even the most carefully designed systems on unpredictable human reliability helps explain disasters such as the Chernobyl nuclear power plant meltdown and the *Challenger* and *Columbia* space shuttle explosions.
28
New cards
The greatest risk factor leading to a reduction in life expectancy is ________
\
\
poverty
29
New cards
Risk Analysis
The greatest risks many people around the world face today rarely make the news media.
\
The greatest risk factor leading to a reduction in life expectancy is __**poverty.**__
\
Why?
\
**Poverty is linked to:**
* malnutrition
* increased susceptibility to fatal diseases
* lack of access to health care
* contaminated water supplies
\
The greatest risk factor leading to a reduction in life expectancy is __**poverty.**__
\
Why?
\
**Poverty is linked to:**
* malnutrition
* increased susceptibility to fatal diseases
* lack of access to health care
* contaminated water supplies
30
New cards
Risk Analysis cont.
The reduction of poverty would lead to increased life expectancy and improved human health.
\
Indirect benefits of reducing poverty:
* stimulates economic development
* reduces environmental degradation
* improves human rights
\
Indirect benefits of reducing poverty:
* stimulates economic development
* reduces environmental degradation
* improves human rights
31
New cards
Risk Perception
Risks are generally not well perceived by people.
\
* many people are not concerned with high-risk activities that are done voluntarily
\
\
**Examples:**
* smoking (1 premature death per 2 participants)
* motorcycling (1 per 60)
* Driving a car (1 per 4200)
\
\
Yet, the same people may be concerned about West Nile Virus (1 per 1 million) or airplane crashes (1 per 9 million).
\
* many people are not concerned with high-risk activities that are done voluntarily
\
\
**Examples:**
* smoking (1 premature death per 2 participants)
* motorcycling (1 per 60)
* Driving a car (1 per 4200)
\
\
Yet, the same people may be concerned about West Nile Virus (1 per 1 million) or airplane crashes (1 per 9 million).
32
New cards
Factors influencing risk perception
Risks from hazards are more accepted by people if the risks are perceived to:
* be voluntary vs imposed
* be under our control vs controlled by others
* have clear benefits vs little or no benefit
* be natural vs anthropogenic
* be statistical vs catastrophic
* be familiar vs exotic
* affect adults vs children
* be voluntary vs imposed
* be under our control vs controlled by others
* have clear benefits vs little or no benefit
* be natural vs anthropogenic
* be statistical vs catastrophic
* be familiar vs exotic
* affect adults vs children
33
New cards
Improving risk perceptions
How can we become better at perceiving risks?
\
* carefully evaluate what the media presents
* compare risks
* the question is not “is it safe” it is “ how risky is it compared to other risks”
* Concentrate on the most serious risks to your own health and don’t worry about risks over which you have no control
\
* carefully evaluate what the media presents
* compare risks
* the question is not “is it safe” it is “ how risky is it compared to other risks”
* Concentrate on the most serious risks to your own health and don’t worry about risks over which you have no control
34
New cards
Changing nature of risk
There has been a shift in risks over the last few generations:
* shift from infectious diseases toward chronic degenerative diseases
* accidents shift from being more common in the workplace to rare due to improved safety regulations
* death rates from natural disasters are generally lower than they were in the past in developed countries
\
As technology has advanced, it has introduced new hazard threats.
\
**Examples:**
* nuclear power plants
* chemical spills
* pesticides
* ozone depletion
* acid precipitation
* shift from infectious diseases toward chronic degenerative diseases
* accidents shift from being more common in the workplace to rare due to improved safety regulations
* death rates from natural disasters are generally lower than they were in the past in developed countries
\
As technology has advanced, it has introduced new hazard threats.
\
**Examples:**
* nuclear power plants
* chemical spills
* pesticides
* ozone depletion
* acid precipitation
35
New cards
life expectancy
Life expectancy is increasing.
\
We have a good ability to measure risks to our health quantitatively as a result of many years of scientific research.
\
We have a good ability to measure risks to our health quantitatively as a result of many years of scientific research.
36
New cards
role of gov’t in risk
There has been an increased role of government in risk assessment and risk management.
\
Examples:
* departments devoted to disaster relief
* traffic safety
* public health
\
There has been an increased involvement of laypeople in risk management decisions.
\
Examples:
* Greenpeace
* Sierra Club
\
Examples:
* departments devoted to disaster relief
* traffic safety
* public health
\
There has been an increased involvement of laypeople in risk management decisions.
\
Examples:
* Greenpeace
* Sierra Club
37
New cards
countries transition from developing to developed, there are increased expectations on their gov’t from the public
This creates pressure on governments and sometimes expectations of the people can be unrealistic depending on the wealth of the country.
38
New cards
**Potential exam Question:**
what is a disaster that could lead to deaths in a developing country but not in a developed country
what is a disaster that could lead to deaths in a developing country but not in a developed country
Drought
39
New cards
**Potential exam Question:**
\
Haiti earthquake occurred on what type of fault line?
\
Haiti earthquake occurred on what type of fault line?
Transform
40
New cards
**Potential exam Question:**
\
Where is Haiti on the map?
\
Where is Haiti on the map?
\