ADV 281 Exam 2: Deck 6
 Call Kai
 Learn
 Practice Test
 Spaced Repetition
 Match
 Flashcards
 Knowt Play
1/108

There's no tags or description
Looks like no tags are added yet.
109 Terms

What is this?
Underfitted

What is this?
Good Fit/Robust

What is this?
Overfitted
Correlation measures…
The strength and direction of the relationship between two quantitative variables
Pearson correlation requires:
Two quantitative variables, Paired observations, A meaningful linear relationship, No extreme outliers, Independent observations
Two Quantitative Variables means (For Pearson correlation requirements)
Both variables should be measured at the interval or ratio level
Paired Observations means (For Pearson correlation requirements)
Each participant needs a score on both variables
A Meaningful Linear Relationship means (For Pearson correlation requirements)
The relationship between the two variables should roughly follow a straight line, not a curve
No Extreme Outliers means (For Pearson correlation requirements)
There shouldn’t be any unusual values far from the rest of the data, since one outlier can distort the correlation
Independent Observations means (For Pearson correlation requirements)
Each participant’s scores shouldn’t be influenced by any other participant’s scores
Pearson’s r tells you which two things?
Direction and Strength
Positive correlation (+)
As X increases, Y tends to increase
Negative correlation (−)
As X increases, Y tends to decrease
For Direction, A Pearson’s r near 0 means…
No clear linear relationship
For Strength, a Pearson’s r closer to ±1 means…
A stronger relationship
For Strength, a Pearson’s r closer to 0 means…
A weaker relationship
Which Pearson’s r shows the STRONGEST relationship?
r = −.82
Students who study more hours tend to get higher exam scores. What direction is this correlation?
Positive
Students who spend more hours on TikTok tend to get lower GPAs. What direction is this correlation?
Negative

What Correlation is this?
Perfect Positive Correlation

What Correlation is this?
Zero Correlation

What Correlation is this?
Perfect Negative Correlation
Rules of Thumb for Effect Sizes
0 – .2 = Weak, .3 – .49 = Moderate, > .5 = Strong
In the Rules of Thumb for Effect Sizes, 0 - .2 is:
Weak
In the Rules of Thumb for Effect Sizes, .3 - .49 is:
Moderate
In the Rules of Thumb for Effect Sizes, >.5 is:
Strong
A Pearson’s r of .15 is…
Weak
A Pearson’s r of .42 is…
Moderate
A Pearson’s r of .68 is…
Strong
A Pearson’s r of −.61 is…
A strong negative relationship
The Calculation of r steps
Find how far each person's X score is from the X mean, Find how far each person's Y score is from the Y mean, See whether those deviations tend to point in the same direction or opposite directions, Standardize the result so that the final correlation ranges from −1 to +1.
What question is r basically asking?
Do people who are above average on X also tend to be above average on Y?
If people’s X and Y deviations tend to point in the SAME direction, r will be…
Positive
If people’s X and Y deviations tend to point in OPPOSITE directions, r will be…
Negative
Why is the result standardized at the end?
So the final correlation always ranges from −1 to +1
Students who are above average in hours studied tend to be above average in exam scores. What does this suggest about r?
r is positive
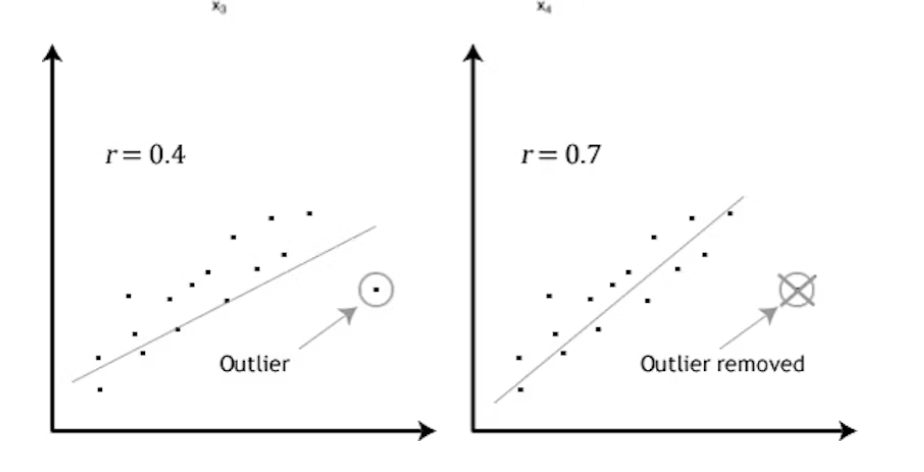
What does this graph show about outliers and Pearson’s r?
One extreme outlier can dramatically change r, making the relationship look weaker (0.4) than it really is without the outlier (0.7)
Test statistic
A number that summarizes the observed data so the statistical test can evaluate the evidence. Its exact meaning depends on the test being used
What question does the test statistic answer?
What pattern did the test detect?
Examples of test statistics
r, t, F, b
The common test statistic for Correlation
r, and often t for testing it
What does a Correlation help evaluate?
The direction and strength of a linear relationship, and whether it differs from zero
The common test statistic for an Independent-samples t-test
t
What does an Independent-samples t-test help evaluate?
How large a difference between group means is relative to its estimated uncertainty
The common test statistic for ANOVA
F
What does ANOVA help evaluate?
How much variation between group means there is relative to variation within groups
The common test statistic for a Chi-square test
χ²
What does a Chi-square test help evaluate?
How much observed categorical data differ from what would be expected under the null hypothesis
Which test uses categorical data?
Chi-square test
What question does the p-value answer?
How surprising are these results under the null hypothesis?
P-value
It tells us how compatible the observed results are with a specified null hypothesis and statistical model
The p-value asks: How likely are we to see THIS data if we assume…
The null hypothesis is true
A p-value is compared to which hypothesis?
The null hypothesis
A study finds r = .35 between influencer credibility and purchase intention, with p = .01. What does the p-value tell us?
These results would be very surprising if there were truly no association in the population
When P < 0.05, it…
Passed
When P > 0.05, it…
Failed
Research question example (Influencer study)
Is perceived influencer credibility associated with consumers’ purchase intentions?
Research hypothesis example (Influencer study)
Perceived influencer credibility is positively associated with purchase intention.
What’s the difference between a research question and a research hypothesis?
A research question asks what you want to find out; a research hypothesis states the answer you predict
Which of the following is a research hypothesis?
“Students who see more TikTok ads will have higher purchase intention.”
What are the two Statistical Hypotheses?
Null Hypothesis and Alternative Hypothesis
Null Hypothesis (H0)
There is no relationship or difference in the population
What is an example of a Null Hypothesis:
There is no association between perceived influencer credibility and purchase intention in the population
Alternative Hypothesis (H1)
There is a relationship or difference in the population
What is an example of a Alternative Hypothesis:
There is a nonzero linear association between perceived influencer credibility and purchase intention in the population
Null hypothesis for a Correlation
The population correlation is zero
Null hypothesis for an Independent-samples t-test
The population means are equal
Null hypothesis for ANOVA
All population group means are equal
Null hypothesis for a Chi-square test of independence
Two categorical variables are independent in the population
“The population means are equal” is the null hypothesis for which test?
Independent-samples t-test
“All population group means are equal” is the null hypothesis for which test?
ANOVA
Two-tailed alternative
There is a relationship or difference, but no direction is specified
Which of the following is an example of a Two-tailed alternative?
“Influencer credibility is associated with purchase intention”
One-tailed alternative
A specific direction is predicted
Which of the following is an example of a One-tailed alternative?
“Higher perceived influencer credibility is associated with higher purchase intention”
Easier way to describe a Two-tailed Alternative Hypothesis
“There’s a relationship, but I’m not saying which way”
Easier way to describe a One-tailed Alternative Hypothesis
“There’s a relationship, and I’m predicting which way”
A statistical test compares…
The observed data with what we would expect under the null hypothesis
In a statistical test, we evaluate…
How compatible the observed data are with the null hypothesis
P value tells us:
Assuming the null hypothesis is true, what is the likelihood that your results happened by chance
Type I error
Rejecting the null hypothesis when it is actually true (false positive)
Type II error
Failing to reject the null hypothesis when it is false (false negative)
A Type I error is also called a…
False Positive
A Type II error is also called a…
False negative
The probability of a Type I error is controlled by…
The significance level, alpha (α)
The probability of a Type II error is commonly represented by…
Beta (β)
Which of the following is an example of a Type I error:
A researcher concludes influencer credibility is associated with purchase intention, but in the population there’s actually no association
Which of the following is an example of a Type II error:
A researcher fails to detect a real association between influencer credibility and purchase intention
A study concludes that a new energy drink ad increases sales, but in reality it has no effect. What is this?
Type I error (false positive)
An ad really does increase sales, but the study finds no significant effect. What is this?
Type II error (false negative)

What size effect does this t-test graph show?
A small effect, since the two groups overlap 92%
Effect size
It describes the magnitude of the result, such as how strongly two variables are associated or how far apart two groups are
Effect size asks…
How strong or large is the relationship or difference?
Study A: n = 40, r = .45, may not reach .05. Study B: n = 1,000, r = .10, may reach .05. What does this show?
A statistically significant result isn’t always a strong one. Study B may pass because of its huge sample, even though its effect is weak.
In the example, which study has the stronger relationship?
Study A (r = .45, moderate)

What does this show?
No Relationship

What does this show?
A Moderate Positive Relationship

What does this show?
A Strong Positive Relationship

What does this show?
A Perfect Positive Relationship

What does this power analysis graph show?
The smaller the effect size, the larger the sample size needed to detect it