Supply Chain Management Exam 3
 Call Kai
 Learn
 Practice Test
 Spaced Repetition
 Match
 Flashcards
 Knowt Play
1/58

There's no tags or description
Looks like no tags are added yet.
59 Terms
Three quality perspectives
Product quality
Design quality
Conformance quality
Eight dimensions of quality
Performance
Reliability
Durability
Conformance
Aesthetics
Support/Responsiveness
Perceived Quality
Serviceability
Total Quality Management Framework (TQM)
Frontline employees
Middle management
Top management
Cost of Poor Quality (COPQ)
Unmanaged quality issues generate massive financial drains
Iceberg
Cost of Quality (COQ) 4 categories
Prevention Costs
Appraisal Costs (inspect, test)
Internal Failure Costs (defects discovered before delivery)
External Failure Costs (defects discovered after delivery)
DMAIC Improvement Cycle
Define
Measure
Analyze
Improve
Control
Ishikawa (Fishbone) Diagram Six Branches (analyze)
Environment
People
Equipment
Management
Materials
Process
ISO 9000
A set of internationally accepted standards for quality management systems established by the International Organization for Standardization
Requires organizations to fulfill customer quality requirements, comply with applicable regulatory mandates, drive continuous improvement, and document all core operational procedures
Malcolm Baldrige National Quality Award
Managed by the U.S. National Institute of Standards and Technology (NIST)
Recognizes measurement/analysis/knowledge management, workforce, operations, and results
Logistics Management
The process of planning, implementing, and controlling the efficient, effect forward and reverse flow and storage of goods, services, and related information between point or origin and point of consumption
Perfect Order 6 Requirements
Complete
On time
Undamaged with intact packaging
Shipped using the specific mode and carrier requested by customer
Accurate documentation and billing
Advanced Shipping Notification and real-time tracking visibility
Integrated Logistics Management Six Core Activity Areas
Order processing
Inventory management
Transportation management
Warehouse management
Material handling and packaging
Network design
Cost-to-service trade-off
Increasing customer service levels increases logistics costs
Cost-to-cost trade-off
Reducing spending in one activity increases costs in another
Total Landed Cost
The sum of all direct manufacturing and logistics-related expenses required to move a product from origin to final destination
Total landed cost = manufacturing + in-transit freight + warehousing + packaging + tariffs/duties + in-transit holding cost
Freight Pricing Economic Principles
economies of scale and economy of distance
Economies of Scale
The transportation cost per unit of weight decreases as the total shipment size increases, spread fixed costs over more pounds
Economy of Distance
The transportation cost per unit of distance traveled decreases as total distance increases, spread fixed costs over more miles
Freight Consolidation/LTL Strategies
Market area consolidation
Pooled delivery consolidation
Scheduled delivery consolidation
Market Area Consolidation
Combining small shipments from a single shipper destined for customers located within the same geographic region
Pooled Delivery Consolidation
Combining small shipments from multiple distinct shippers going to the same destination region
Scheduled Delivery Consolidation
Establishing designated delivery days for specific geographic zones, requiring buyers to hold orders until scheduled consolidation shipment runs
Modes of Transportation and Carrier Types
Availability: Geographic reach
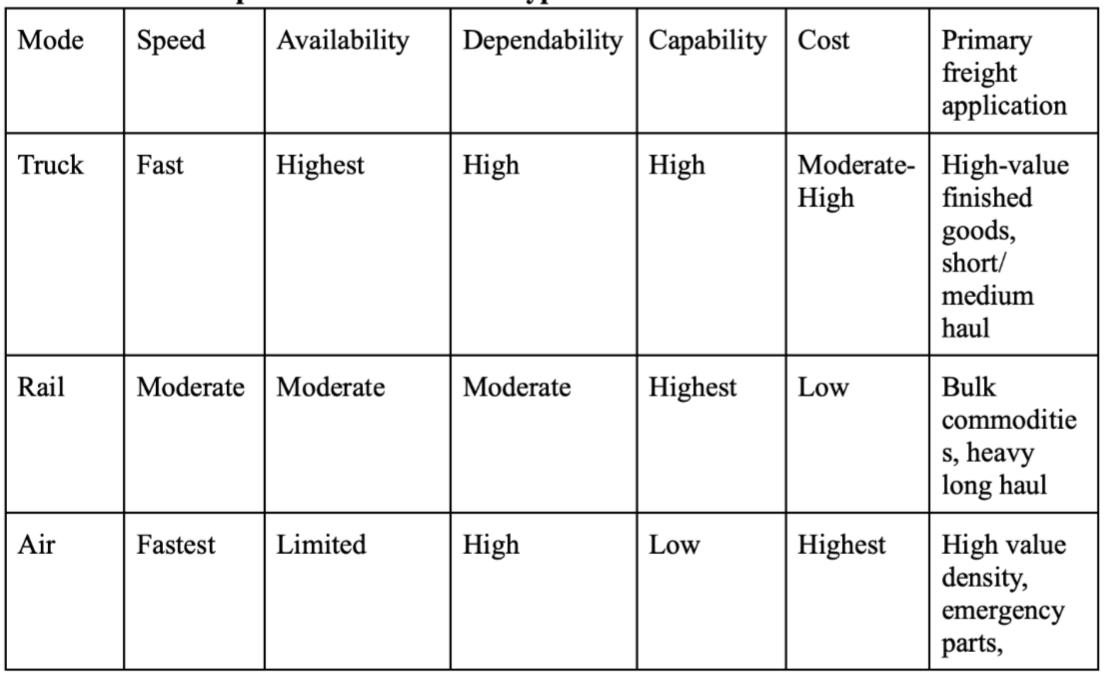
Trucking Industry Operating Segments
Truckload
Less-Than-Truckload (LTL)
Specialty Parcel Carriers
Carrier Legal Types
Common carriers
Contract carriers
Private carriers
Common Carriers
Serve the general public under published rates and non-discriminatory service obligations
Contract Carriers
Provide customized transportation services exclusively to specific customers under negotiated, long-term contracts
Private Carriers
Fleet equipment owned and operated directly by the firm transporting its own goods
Value Density
The ratio of a product’s monetary value to its weight (value/weight)
Determines whether a manager should choose fast, expensive air transport or slow, cheaper ground transport
Warehouse Functions Beyond Storage
Stockpiling (storing seasonal inventory)
Production Support (storing raw materials and subassemblies)
Break-bulk (receiving large shipments and breaking them into smaller)
Cross-docking
Fulfillment Centers (shipping, pick, packing)
Last-mile Delivery
Most expensive because no economies of scale
Independent Demand
Demand for finished goods created directly by end customers
Uncertain, must be estimated using forecasting models
Managed using reorder point inventory system
Dependent Demand
Demand for raw materials, parts, subassemblies, and components directly driven by the production schedule of a higher level parent item
Materials Requirement Planning (MRP)
A computer-based inventory management system that calculates the exact quantities and timing required for raw materials, subassemblies, and components needed to manufacture finished products
Distribution Requirements Planning (DRP)
Applies MRP-like time-phased logic to manage finished goods inventory positioning across regional distribution networks
DRP outputs serve as major inputs to factory master production schedules
Capacity Requirements Planning (CRP)
Converts planned order releases from the MRP system into workload hours required at individual work centers
Compares required work center hours against available capacity via Load Profiles to identify over-capacity bottlenecks or under-utilized equipment
Enterprise Resource Planning (ERP)
Comprehensive database software that integrates all core business planning functions (manufacturing, finance, sales, HR, and procurement) into a single transactional platform
Advanced Planning & Scheduling (APS)
Modern software systems that integrate materials and capacity constraints simultaneously in relay-time, eliminating iterative manual planning steps
MRP 3 Core Inputs
Master Production Schedule (MPS)
Bill of Materials (BOM)
Inventory Records File
Master Production Schedule (MPS)
Specifies what finished products will be built, in what quantities, and specific time buckets (weeks or days) across the planning horizon
Indicates Available-to-Promise (ATP) inventory available for new customer orders
Bill of Materials (BOM)
A detailed document or visual product structure tree listing all raw materials, subassemblies, intermediate parts, and exact quantities required to build one unit of an end item
Inventory Record Files
Contains current on-hand inventory balances, scheduled receipts (orders placed previously that are en route), safety stock requirements, supplier lead times, and lot-sizing rules
Lot Sizing Rules
Lot-for-lot (L4L): order exact quantity needed in each period
FOQ: order a fixed batch size every time an order is placed
POQ: order an amount that covers requirements for a fixed number of future periods
MRP Outputs
Primary Reports
Secondary Reports
Primary Reports
Schedules of planned order releases that trigger purchase orders for raw materials and work orders for factory production
Secondary Reports
Performance evaluation metrics, exception reports flagging late orders, and inventory cost tracking
Bill of Materials Levels
Finished end item
Major subassemblies and direct components
Component parts making up level 1 subassemblies
Raw materials
Sales & Operating Planning (S&OP)
An executive-level cross-functional process that reconciles sales, marketing financial, and operations plans into a single tactical plan. Occurring over a 3-18 month planning horizon. Resolves functional conflicts between departments.
S&OP

S&OP Steps
Create functional inputs (gather past performance and sales data)
Unconstrained Marketing Plan (demand forecasts without considering capacity constraints)
Initial Resource Plan (operations and logistics evaluate capacity and supply constraints)
Balanced Plan
Financial Review
Executive Meeting
Implementation & Follow-up
Aggregate Planning
Determines production rates, workforce levels, inventory holdings, and subcontracting needs across product families
Aggregate Planning Three Core Strategies
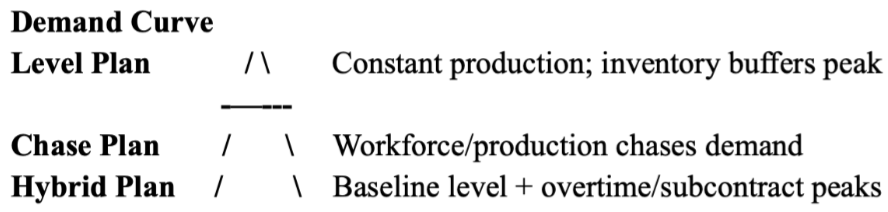
Level Production Strategy
Production is managed at a constant rate in every period of demand functions
During low demand period, excess production builds up as inventory
During high demand periods, accumulated inventory is drawn down to satisfy sales
Advantages: Stable workforce, no hiring/firing costs, high equipment utilization
Disadvantages: High inventory holding costs, risk of inventory obsolescence
Best applied when: Highly skilled union labor, expensive machinery, low inventory holding costs
Chase Production Strategy
Production rate is adjusted in each period to match expected demand exactly, keeping inventory levels low and stable
Production changes are achieved by:
Hiring and laying off workers as demand fluctuates
Varying overtime hours
Subcontracting excess demand to third-party manufacturers
Advantages: Minimal inventory holding costs, reduced risk of excess stock
Disadvantages: High hiring and layoff costs, low employee morale, training costs, potential quality variance from subcontractors
Best applied when: High per-unit inventory holding costs, low-skilled perishable goods
Hybrid Strategy
Combines elements of level and chase strategies
A firm maintains a stable baseline workforce to meet base demand, using overtime, temporary workers, or subcontracting to cover seasonal demand peaks
Total Cost Six Categories (Sum)
regular labor cost
overtime cost
subcontracting cost
inventory holding cost
hiring cost
firing cost
Yield Management
Adjusts prices in real time based on demand forecasts, booking patterns, and remaining capacity to maximize total revenue from perishable assets
Supply Chain Resilience
The capability of a supply chain to anticipate, withstand, recover from, and adapt to unexpected disruptions
Key Strategies to Enhance Resilience
Improving supply chain visibility, building inventory buffers, establishing dual-sourcing redundancies, and improving inter-firm communication