EARTH309 Exam 1
 Call Kai
 Learn
 Practice Test
 Spaced Repetition
 Match
 Flashcards
 Knowt Play
1/65

There's no tags or description
Looks like no tags are added yet.
66 Terms
What does GIS stand for?
Geographic Information System
What are the uses of GIS?
Spatial mapping, analysis, database management, visualization
What is GIS?
Layers of information using spatial and aspatial data
What is spatial awareness?
The ability to perceive and understand the relationships between objects in space, including their distances and positions.
How can GIS be applied to sustainability issues?
Most sustainability issues have geographic contexts
12 categories
What can you map with GIS?
Locations, quantities, categories, comparisons, density, spatiotemporal change, movement over time, networks, narratives
12 categories of sustainability issues tackled by GIS
Understand and visualize information
Identify problems
Monitor and assess issues
Manage and respond to events
Understand trends
Perform forecasting
Optimize planning and decision making
Implement solutions
Enhance community awareness
Engage stakeholders
Empower communities
Create compelling narratives
Spatial vs aspatial
Spatial: location is critical aspect of information
Aspatial: data is not tied to location
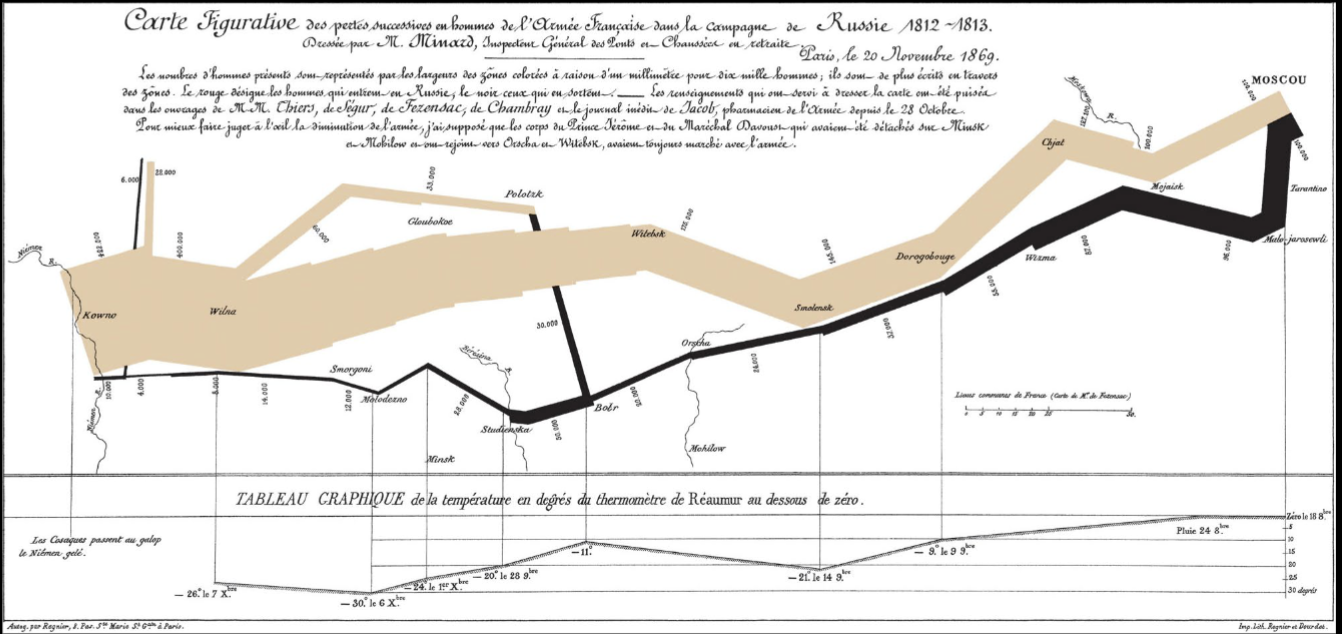
Charles Minard
Engineer, mapped Napolean’s invasion of Russia
The map had 6 types of data, 2 dimensions: number of Napoleon’s troops, distance traveled, temperature, lat long, direction of travel, location relative to date
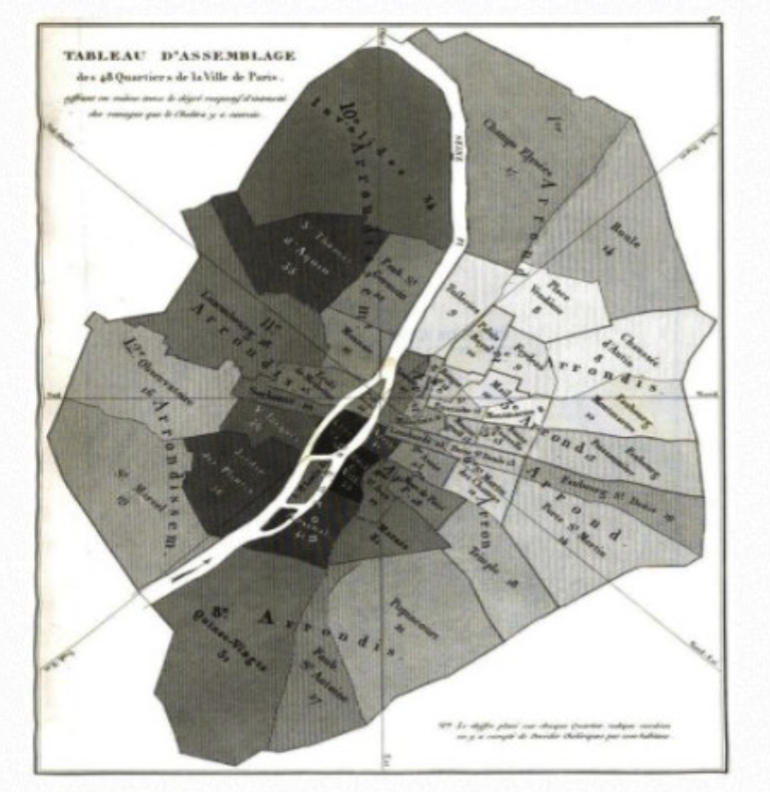
Charles Picquet
Geographer/cartographer, mapped 1834 cholera outbreak in Paris
Represented 48 Parisian districts by color gradient according to cholera deaths per 1000 people
John Snow
Mapped 1854 cholera outbreak in London to see if cholera was related to well water
Mapped streets, cholera deaths, and water pump locations and found that outbreaks were waterborne, rather than “bad air” (miasma theory)
Roger Tomlinson
Father of GIS
Created first GIS, coined the term GIS
Brief History of GIS (60s-2020s)
60s: early GIS systems
70s: first public domain GIS (MOSS and GRASS), first Earth-sensing satellites
80s: better computing tech, commercial vendors of GIS
90s: early internet, personal computers more common, Esri becomes industry leader
2000s: better computing tech, free/open-source GIS packages
2010s: increased data availability, cloud-based mapping, geoapps, location enabled apps
2020s: world events put real-time data and maps in public eye (COVID, elections, etc)
Aspects of real-world features on GIS maps (3)
Locations of features on Earth’s surface
Attributes: things that are known about the features (name, populations, etc)
Spatial relationships among features
Topology (definition, 3 types)
Spatial relationships between features
Adjacency: 2 polygons next to each other
Connectivity: 2+ lines meeting at a point
Containment: 1 polygon lying completely within another polygon
Types of map data (2)
Discrete: objects exist in a defined space
-specific locations/boundaries
-points, lines, polygons
Continuous: data exists everywhere over a surface
-ex: elevation
-rasters
Vector Data (definition + advantages)
Stores discrete data (points/lines/polygons)
Advantages:
-Geographic accuracy
-Flexible for cartography (looks nice)
-Suited for certain types of analysis (areas, lengths, connections)
-Stores many attributes
-Compact information storage
Raster Data (definition + advantages)
Stores continuous data over a surface
Advantages:
-Suited to store continuous data
-Extensive set of analysis tools
-Simple and rapid analyses
Map Scale
Ratio of distance on the map to distance on the ground
Further away from earth = smaller fraction
Large scale vs Small scale map
Large Scale: small geographic extent, more detailed, ratio is large, “view” is closer to Earth
Small Scale: large geographic extent, more generalized, ratio is small, “view” is further away
Source Scale
Scale at which the data is captured
Don’t analyze or display data at scales much different than the scale of the source data
Data Quality
Fitness of a dataset for a particular purpose (scale, type of data, ethics/legality)
Determining Data Quality (5)
Geometric accuracy
Thematic accuracy
Data completeness
Precision
Logical consistency
Metadata
Information about the data set including source scale, resolution, provider
Citing GIS Sources
Dataset Name (year) [source type]. Producer name, Producer contact info. Resource URL: [date accessed].
Project File
Container for a particular set of GIS maps, tools, data, layouts, etc
Organized in a main project folder
Maps vs Scenes
Maps: 2D
Scenes: 3D
Both: display GIS data together with symbols, labels, etc
Ribbon
“Menu” buttons at the top of the application
Context sensitive: ribbons change depending on what part of the project you are working on
Catalog Pane
Accesses many items in the project
Four tabs:
-Project: local resources including maps, toolboxes, databases, etc
-Portal: online resources
-Favorites: stored locations for your project
-Notifications: info about things like software updates
Layers
Stores properties and settings for display, each layer’s symbols/settings can be customized to appear or behave as desired
Geodatabase
Home geodatabase contains core data that will be added to layers, adopts name of project
Folder Connections
Data in folders or geodatabases stored outside of the home geodatabase, but used in the project
Data Management Importance
Be aware of where computer saves project or file (default locations), don’t change folder/project name later, avoid spaces and special characters in folder/file names
Categorical/Thematic Maps
Portray spatial distribution of specific data themes for selected geographic areas
Attribute Data (4 types)
Nominal, Categorical, Ordinal, Quantitative
Nominal
Names or identities of objects
Each feature likely to have its own value
Map style: Single symbol map w/ labels
Ex: airports, counties, states
Categorical
Data separated into distinct groups (unrankable)
Map type: Unique values map
Ex: volcano type, highway plass, land type
Ordinal
Categorical data with implicit or natural order
Map style: Unique values map (if non-numeric), Graduated color (if numeric and polygons)
Ex: low/medium/high slope, grades (A, B, C…), habitat rank (unsuitable, acceptable, ideal)
Quantitative Data
Data in the form of counts/numbers where each value has a unique, objective numerical value
Map style: Graduated color (if polygons), Graduated symbol (if points or lines), Dot density, Chart maps
Ex: temperature, elevation, number of eruptions, population
Using color in mapmaking (HSV Color Model)
Hue: Base pigment
Saturation: Depth of the pigment (shade), intensity of color
Value: Brightness of the pigment, tint (lighter) or shade (darker)
General rules:
-Vary HUE for changes in CATEGORY (diff category = diff color)
-Vary SATURATION or VALUE for changes in QUANTITY (more quantity = darker value of the same color)
-Vary BOTH for DIVERGENT QUANTITIES like positive/negative or cold/warm values (ex: red for hot, blue for cold, purple for middle values)
Differentiating categorical data
Vary shape, line type, pattern, hue, or font style
Differentiating numeric data
Vary symbol size, thickness, value/saturation, font size
Data Classification
Placing a range of values into a small number of groups, represented by a different color or symbol size
Quantitative data MUST be divided into classes before mapping
Modifiable Areal Unit Problem (MAUP)
Data often measured over one areal unit (ex: census block) and then combined into set of larger areal units (ex: counties), which are usually arbitrarily defined
Size and shape of arbitrary aggregation units (ex: states or countries) may influence recorded values
Large polygons have greater prominence on maps, attracts greater attention since large stands out
Problem: Spatial patterns may be obscured by aggregation scheme
Reducing effects of MAUP
Normalize values by (ex: rather than number of farms per state, you can do…)
Area of features (density of farms/sq. mile)
Percent of total (percent of farm coverage per state)
Other fields (agricultural production per capita)
Use dot density or graduated/proportional symbol map to reduce effects of visual MAUP
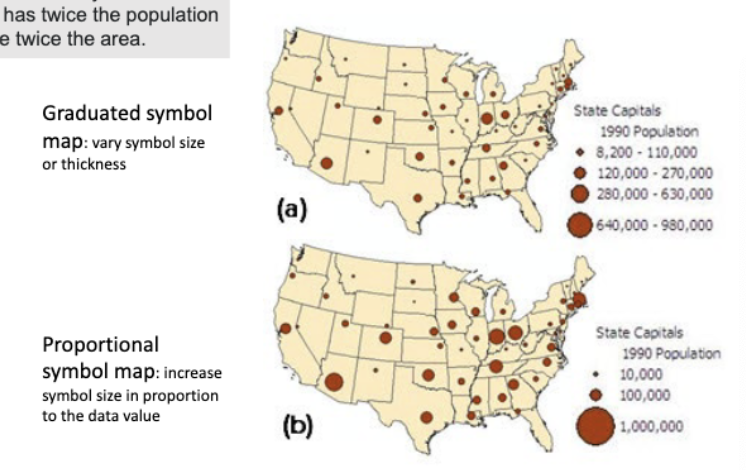
Graduated vs Proportional Symbols
Graduated: groups observations into distinct classes (ex: 3 categories of city size: <1 million, 1-4 million, and >4 million)
Proportional: shows relative differences in quantities among features, unclassed symbols scaled directly to data (ex: Toronto has twice the population of Vancouver so Toronto’s symbol is twice as big)
Layouts
Composition of one or more map frames, plus supporting elements like title, legend, descriptive text, etc, to make one formal cartographic design
Map Frame
Map placed within a layout (smaller map that may show where the main map is in space)
Seven Essential Map Elements
Title
Credit (Cartographer name or organization)
Date of map
Source and date of data
Scale bar
Legend
Directional reference (North arrow)
Five Principles of Map Design
Concept before compilation: think about purpose and audience
Hierarchy with harmony: make important features visually prominent
Simplicity from sacrifice: great design tends towards simplicity
Maximum information at minimum cost: maximize amount of info gleaned at a glance, 30 second rule
Engage emotion to elicit understanding: every map has a bias, consider color connotations, suitable projections (can distort size of areas based on projection)
Visual Hierarchy
Making the most important features stand out the most
Achieved using color, contrast, foreground/background, size/thickness, symbol/font, spacing/grouping
Layout Design (6 things to consider)
Visual center: ~5% higher than geometric center
Alignment: use columns and align edges of map, legend, credits, etc
Negative Space: balance elements evenly, don’t leave big empty spaces, consider orientation (vertical or horizontal)
Neatlines: defines spaces, establishes importance
Inset Maps: sometimes need to add detailed area of principle map or scaled out map to show overall location of principle map
Foreground/Background: consider which elements should be on “top” of other elements
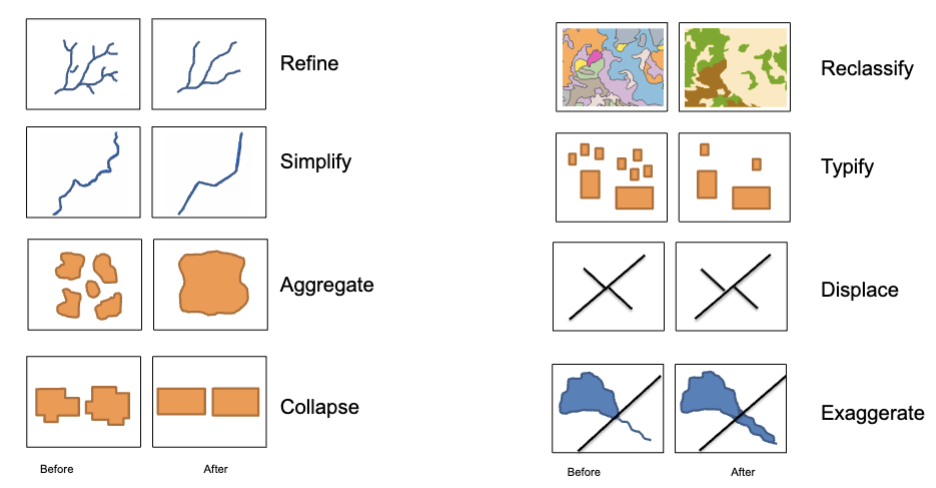
Cartographic Generalization (8 methods)
Refine
Simplify
Aggregate
Collapse
Reclassify
Typify
Displace
Exaggerate
When to omit data
Privacy issues, sensitive information, unintended economic consequences
Small Multiples Maps
Multiple small maps that can illustrate a change over time or compare multiple locations in one map view
Coordinate System
Coordinate space following cartographic standards and tied to a specific location on Earth’s surface
Reference system used to define positions of spatial data within a common geographic framework
Types of Coordinate Systems (2)
Geographic: location on ellipsoid defined by latitude and longitude, based on spherical globe coordinates, not desirable for maps or analysis due to distortion
Projected: location defined on a flat surface using Cartesian coordinates (x,y) that specify horizontal and vertical position, units are meters/km/ft/etc, better for map use
Map Projections (3)
Mollweide Equal-Area: oval
Mercator: square
Albers Equal Area: like a half donut
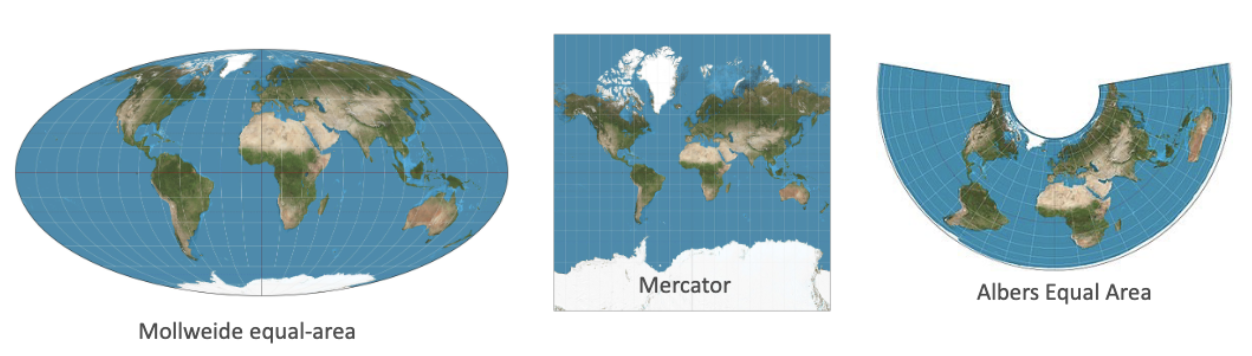
Classes of Map Projections (3)
Cylindrical: preserves direction and shape
Conic: preserves distance and area
Azimuthal/Planar: preserves distance and area
Coordinate system choice affects…
Data analysis, mapping projection, mapping message, data alignment
UTM
Universal Transverse Mercator
60 N-S oriented zones worldwide at 6 degree bands of longitude
No distortion along central meridian
Preserves all four map properties well, but none perfectly
Good projection for large scale maps
State Plane
Small zones designed for each state
Minimal distortion for areas in a single map zone
Custom State Projections
Allows referencing locations for specific states on a single projection and coordinate system
Michigan uses GEOREF
Change CS of Map
Changes how layers in the map are displayed
Does NOT alter CS of the data sources used in the map
Change CS of Data Set
Changes the coordinates in the SOURCE FILE permanently
Good practice to have all data in the same CS
Define Projection Tool vs Project Tool
Define Projection: creates or changes only the CS label, does NOT change coordinates in the file, keeps original data set, use only when CS is missing or inforrect
Project: changes coordinates in the file permanently!