Systematics
 Call Kai
 Learn
 Practice Test
 Spaced Repetition
 Match
 Flashcards
 Knowt Play
1/35

Earn XP
Description and Tags
BIO 1131
36 Terms
Systematics
the science of classifying organisms and determining their evolutionary relationships
Phylogenetic tree
a hypothesis — in the form of a diagram — that shows the evolutionary relationships of a group of organsims. ie, how organisms are related to one another
Carl Linnaeus created _________
classification aka taxonomy
Remember that the ____________ system is the use of _____________ nomenclature. This means:
lineann, binomial
→ only genus is capitalized
→ both genus and species are italicized
Taxa/taxon (singular
a group at any lvl of classification hierarchy
Analogous traits + example
similarities that are NOT due to shared ancestry — rather, by shared environment or identical independant mutations
ex: flying squirrel vs sugar glider
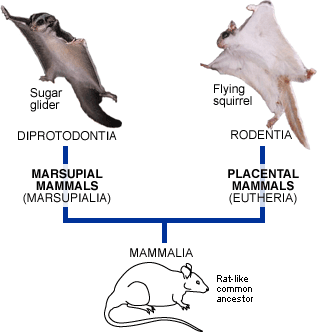
Analogous traits is caused by ____________ evolution
convergent
cladistics
an approach to classification that reflects evolutionary history
homologous traits
characteristics shared because they were inherited from a common ancestor, even if they now serve different functions.
phylogenetics
the study of evolutionary relationships
ancestral lineage represents _______ ; the longer the ______, the longer the _____.
time, branch, time
on a phylogenetic tree, it doesn’t matter where the words are; trees can be rotated around any _____ ___ (___), which means that:
branch points (nodes)
→ physical proximity of taxa on the tops does NOT indicate relatedness
are certain taxa considered more/less advanced than others? why?
NO. all species alive today share the common ancestor LUCA and thus don’t differ in length of evolutionary history

rather than ladder-like, evolution produces patterns of ____________ that are ___-like
relatedness, tree
why is not including all species within a taxon potentially misleading?
it may suggest a “less diverse” taxon; phylogenetic trees can look different if parts are collapsed or pruned

relatedness is indicated by:
how RECENTLY two taxa share a common ancestor
relatedness is NOT indicated by the # of nodes between taxa; why?
because the number of nodes depends on whether other taxa are included or not
kinds of groupings (3)
Monophyletic: aka a clade, it’s composed of one ancestral species and ALL of its descendants
Paraphyletic: contains an ancestor and SOME of its descendants
Polyphenetic: lacks the common ancestor of all of its members — thus doesnt accurately reflect the group’s evolutionary history
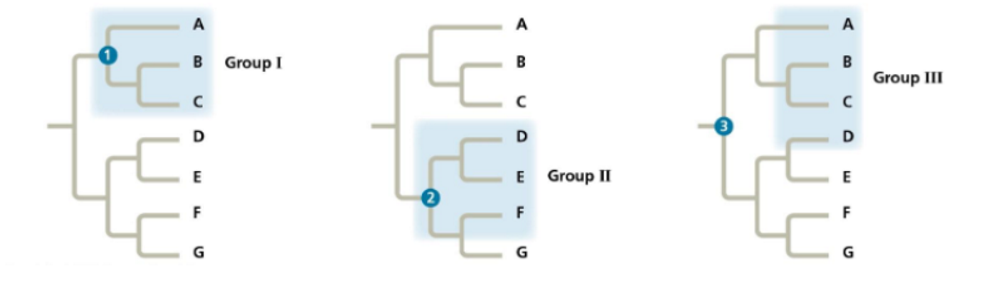
identify the groupings
monophyletic
paraphyletic
polyphenetic

explain cladistics
Cladisitics is an approach to systatmatics in which common ancestry is the primary basis for classifying organisms
→ uses homologies to define clades
sister taxa 👯
two or more lineages or clades that result from the splitting of a single ancestral lineage

ingroup vs outgroup
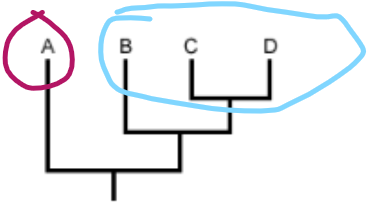
The outgroup is one or more species outside the group of interest. This group of interest is the ingroup.
☆ Systematists compare ingroup species among themselves and w the outgroup to differentiate between

identify the ingroup and the outrgoup
A is the outgroup here
BCD is the ingroup
how is morphology👽 or molecular🧬 data used to build phylogenetic trees?
Systematists compare ingroup species among themselves and with the outgroup to differentiate between shared derived vs. ancestral characteristics.
species with shared derived characters are grouped together 🤝
this thereby determines which characters were derived at various branch points.
👽morphological vs 🧬molecular data
Phylogenetics were originally done — and are still mostly done for fossils — via morphological data, but the standard now is to compare molecular sequences of DNA/RNA/proteins

shared derived vs shared ancestral characters
Ancestral: a characteristic inherited from a distant ancestor and shared broadly across a large group of organisms (ex: backbones are a derived character of vertebrates bc they are present in all vertebrates)
Derived: a newer modification found in a smaller subset (ex: backbones are a derived character of mammals bc all mammals have them, BUT so do other vertebrates — ie they don’t distinguish mammals)
Principle of Parsimony
the most likely phylogenetic tree is the one that involves the fewest number of evolutionary transitions (gains/losses/changes of a train)

2 types of trees
cladograms and phylograms
cladogram vs phylogram
Cladograms: have no info about timing or amount of change
Phylograms: show branching patterns and branch lengths are proportional to either the amount of genetic change or the times of the branching points
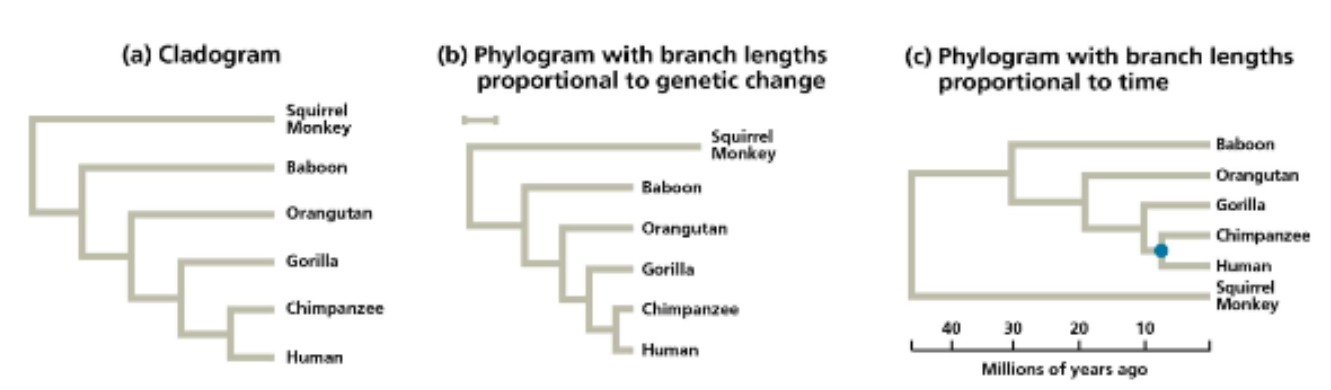
2 methods by which dates can be added to trees
we can date nodes/branching points 2 ways:
🦴 Fossils in combination w radiometric dating and/or stratigraphy
⏰ Molecular clock method
Stratigraphy
study of rock layers, layering
describe the molecular clock method
A method that uses the rate at which genetic differences accumulate over time to estimate the time since two species/lineages diverged from a common ancestor. Individual genes vary in how clock-like they are (some mutate faster than others)
→ its best to use genes w/o a strong effect on fitness — they’re less affected by selection

how can mutations/alleles be the same between two different species?
there could be selection; meaning parallel evolution. We might expect more mutation but maybe this pair of species are under the same selection pressure!

what do we say/ is generally true and thus justifies use of a molecular clock
Genes that have no effect on fitness have a constant rate of evolutionary change