Biology 150 b (part 3)
 Call Kai
 Learn
 Practice Test
 Spaced Repetition
 Match
 Flashcards
 Knowt Play
1/14

There's no tags or description
Looks like no tags are added yet.
15 Terms
Videos
Incomplete Dominance, Codominance, Polygenic Traits, and Epistasis!
Alleles and Genes
Mutations
Qualitative vs Quantitative traits
Define a qualitative trait?
How is a qualitative trait expressed?
Define a quantitative trait?
How is a quanitative trait expressed? (specific term)
A qualitative trait is a biological characteristic distinct categories rather than a continuous spectrum. ("yes-or-no" expression)
Expressed by one gene (typically 2 alleles → 2 version of gene (B/b))
A quantitative trait is a biological characteristic that varies along a continuous spectrum (continuous distribution)
Polygenetic traits: expression is influenced by multiple loci (multiple alleles in multiple places), often on multiple chromosomes
Quantifying quantitative traits
What are the 2 elements quantify quantitative traits?
Define variation
Frequancy of polygenic phenotypes
Variance in traits with very few genes
Variation and mean
Variation is a statistical measure showing how much individual traits spread from the mean → determine how wide (lots of variation) or narrow (little variation) a curve of distribution will look like.
TO FILL
TO FILL
Heritability
Define heritability.
Name the 3 factors that affect the differences in phenotype.
Define phenotypic plasticity
Heritability is the relative contribution of genetic factors to phenotypic variation within a population - only genetic effects can be passed down to the next generation.
VP = VG + VE
VP: Total variation of a physical trait
VG: Genetic variation
VE: Environmental variation
Differences in phenotypes are due to:
-Genetics
-Environmental influences
-Interaction of environment and genetics
How much quantitative traits are expressed can also depend on the environment individuals are experiencing
-Traits where environment = little effect on phenotypic expression = highly heritable (human eye color)
-Traits where environment = not a big effect on phenotypic expression = not highly heritable (human height 20% → enviroment, 80% → environment)
Broad/ Narrow Sense Heritability (H2/ h2)
Define Broad Sense Heritability
What is the formula?
What are the genetic effects included and the issue with Broad Sense Heritability?
Define Narrow Sense Heritability (h2)
What is the formula and how do we interpret the results?
What are the genetic effects included with Narrow Sense Heritability?
What does it dictates?
The proportion of total phenotypic variance in a population that is explained by all genetic factors combined
See image
VP: Total variation of a physical trait
VG: Genetic effects (amount of variation due to genes)
VE: Environmental variation (amount of variation due enviro.)
Combines
-Additive effects
-Dominance effects
-Epistatic effects
Problem: Dominance + epistasis effects are not reliably transmitted to the offspring (parents do not pass on their complete genotypes (combination of alleles → dominance not passed) or specific multi-gene/multi-allele combinations to their children; they only pass on individual alleles (one per locus via meiosis)
The proportion of total phenotypic variance in a population that is due to additive genetic variance
h2 = VA / VP
VP: Total variation of a physical trait
VA: Variation due to an additive allele
0 = no phenotypic variation is driven by additive alleles
1 = all phenotypic variation is driven by additive alleles
Additive genetic variance = component of genetics that parents reliably pass down to their offspring
It dictates how much a trait will respond to selection in the next generation
Quantifiying Heritability
How do when quantify heritability in a perfect world?
How do when quantify heritability in a real world?
How do I interpret the graphs?
What is the formula
What do the variables (R and S) stand for ?
In a low heritability sytem what would R and S be?
In a high heritability sytem what would R and S be?
How to interpret the results?
Summarize this.
By comparing differences between genetically identical individuals in different environments
The most common way is to quantify heritability is to measure traits for parents and their offspring
Look at the image
h2 = R / S
R = Response to selection (Difference between mean trait value of offspring vs. mean trait value of parent generation before selection (measures difference between reproducing individuals and offspring))
S = Selection strength (Difference between mean trait value after selection vs. entire population trait value (measures difference between reproducing individuals vs all individuals)) 6. In a low heritability system, strength of selection (S) will be much greater than the response to selection (R)
In a high heritability system, S and R will be very close to one another
Interpretation of h2
0 = no heritability and no population change
1 = there is heritability and population change → offspring match match midparent value exactly and R = S
If the trait has no variation, then the mean of S in reproducing and not reproducing is identical and the population doesn’t change
• Here is our number of fingers example!
Summary:
-If selection is very strong, a phenotype will change even if heredity is relatively weak (as long as it’s not 0)
-If heredity is very strong, small selection pressures can accumulate large effects on phenotypes
-Evolutionary change happens quickest when selection and heredity are both strong

Types of selection
What are the three types of selection that occur in quantitative traits?
Explain directional selection and provide an example.
Explain stabilizing selection and provide an example.
Explain disruptive selection and provide an example.
Directional, stabilizing, disruptive
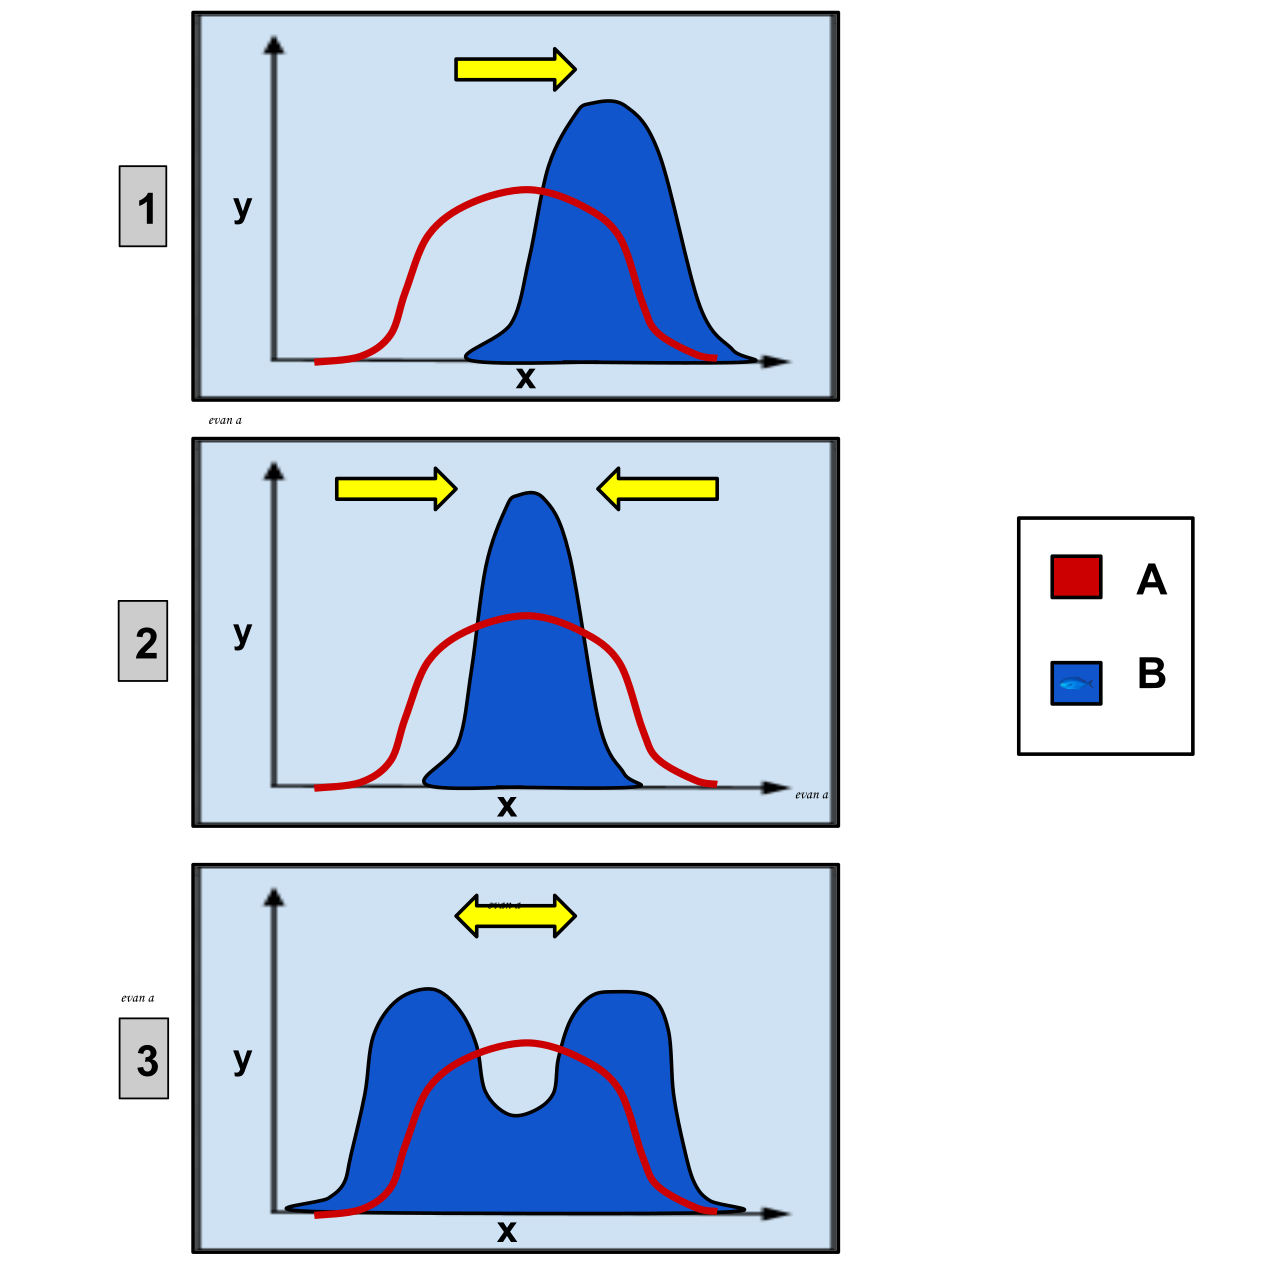
Moves a trait in a particular direction (the curve moves to the right or left toward an extreme of a trait (can be +/-)
Example: Moth in industrial revolution UK → increased pollution favored darker moths, when pollution lessened directional selection favored lighter moths
When there is a selection for (favoring) the mean, the result is less variance in a population and it happens often when there are evolutionary tradeoffs (the curves becomes skinny) - most relative static traits exprience some degree of stabilizing selection
Example: A bird will lay eggs, having more egs increases the energy used by the parents, having fewer eggs results in a higher risk of failed breeding season → stabilizing selcetion balances these tradeoffs and finds a middle ground
Is basically the opposite of stabilizing selection (it is selection against the middle/mean or for (favoring) both extremes (can lead to speciation)
Example: In crossbills display disruptive selection in bill size because small beaked birds and specialize on small pinecones, large beaked birds can specialize on large pinecones… but there is no middle sized pinecone
Heritability of traits
Which traits are not very heritable?
Why isn’t phenotypic plasticity heritable?
If plasticity allows organisms to adapt quickly, why isn’t everything plastic?
What is a centimorgan and how is it measured?
Phenotypic plasticity, additives alleles, epistasis genes, polygenetic traits
These traits are mostly influenced by the environment that are not passed down.
It is liked to tradeoffs. (Example of the fishes in the slides)
cM = recombination frequency x 100
The recombination frequency is the distance between the genes
Genetic linkage
What is genetic linkage?
What is linkage equilibrium?
What is linkage disequilibrium?
Give an example of linkage disequilibrium.
Genetic linkage is the tendancy of genes located close together on chromosomes to be inherited together (less likely separated by recombination during meiosis (look at notes/ pictures)
Linkage equilibrium is the presence of one allele haviing no no dependance on the presence of another in apopulation (when genes are inherited completly independantly = independant assortment)
This is when a version of an alleles is more likely to be associated with another allele for another trait
This is due in part because of proximity on the on the chromosome making them move together during crossover
In yellow monkeyflowers, this happens because of where the plants live:
Inland flowers live where summers get hot and dry fast. To survive, they carry a bundle of genes that make them grow fast, stay small, and flower early before they dry up.
Coastal flowers live where cool fog keeps the ground wet all year. They carry a bundle of genes that make them grow big, live longer, and flower late.
Because these survival genes sit right next to each other on the flower's DNA—and because bees usually pollinate neighbors rather than flying miles between the coast and inland—those traits stay locked together. You rarely find a giant coastal monkeyflower that flowers early, or a tiny inland one that flowers late. Their genes move as a team rather than mixing freely.
It is also perpetuated when certain traits are advantageous when found together → can reduce variation in a population
Qualitative and Quantitative trait on the genome
Finding Qualitative Traits on the Genome
Finding Quantitative Traits on the Genome
What is Quantitative Trait Locus (QTL) Analysis
How is the mapping done?
What are the cons?
Define GWAS
What are the cons?
Manhattan plots: what do the data points above the red line indicate about the genes being studied?
Why doesn't finding an associated genetic marker always mean you've found the exact gene causing a disease?
Qualitative Traits, it can be very easy to find the connection between a specific gene and an observed phenotype (1:1 connection, find the source of variation within a phenotype = comes from the same locus)
Quantitative traits, this connection is a lot harder to find, but it’s vitally important for understanding evolution in Quantitative characteristics
QTL analysis helps scientists figure out which specific gene spots are responsible for measurable traits (like how tall you are)
QTL: Specific region of DNA that correlates with a polygenic quantitative trait
Mapping relies on SNPs or SSRs to track chromosomal segments inherited from both parents
QTLA requires breeding plants or animals, which takes generations and only shows traits between those specific parents. Compared to GWAS that skips the breeding part and take an existing population and analyse the patterns linked to traits across many individuals.
Scans the entire genome of many different individuals to find genetic variations linked to particular traits
Cons:
-Take many individuals, often a long time to achieve crosses
-Has low mapping resolution (identifies broad regions, not exact mutations or single genes)
-Only captures variation that happens to segregate between the parents chosen for the experimental cross
It means that they are likely involved in the expression of the trait.
Because they are multiple genetic markers and environmental factors heavily influencing the outcome.
Gene tree
What happens when distantly related species independently evolve similar physical traits?
What are the pros and cons of morphological trees?
What are the pros and cons of molecular trees?
What data is used for each tree?
Explain what is tree redux.
Convergent evolution (similar phenotypes)= analogous structures/ homoplasty, like how the unrelated golden mole and marsupial mole evolved identical burrowing traits.
Morphological tree:
Pros:
-Accessible, practical
-Can show the direction of evolutionary change
Cons:
-Relatively few tra
- Result false bc convergent evolution
.
Data:
Morphological tree: Detailed analysis of physical characteristics
Molecular tree: DNA base pairs or protein amino acid sequences
Refers to revisiting phylogenetic trees, shifting from only physical traits (morphological tree) to incorporating genetic data and molecular clocks to more accurately map evolutionary relationships.
Molecular clocks
What is molecular clock and how is it measured?
Why do we use neutral mutations?
Why might matching DNA sequences sometimes give us misleading results compared to complex physical traits?
What are the key requirements?
A molecular clock is like a biological timer using the steady accumulation of neutral genetic mutations to estimatw when species diverged.
Because they don’t affect survival. Natural selection ignores them, so they build up at a steady, predictable rate, making them reliable for tracking evolutionary time. Natural selection discards harmful mutations or quickly spreads beneficial ones. Because selection constantly alters them, they don't accumulate at the steady, predictable rate needed for a clock.
Non-coding regions accumulate neutral mutations steadily. However, because DNA only has four bases (homoplasty), random mutations frequently cause unrelated species to independently match, creating false signals that disrupt the steady ticking of a molecular clock.
Calibration: Genetic differences must be anchored to real time using outside data like fossils. Gene Selection: The chosen gene must exist across every species in the studied group (e.g., cytochrome c works across mammals, whereas a chitin gene cannot build a tree for all animals).
Coalescence trees
Define coalescence.
Coalescence is tracing gene copies in modern individuals backward in time until they merge into a single ancestral gene copy.