Tools to evaluate sustainability from product to system
 Call Kai
 Learn
 Practice Test
 Spaced Repetition
 Match
 Flashcards
 Knowt Play
1/39

There's no tags or description
Looks like no tags are added yet.
40 Terms
What is the environmental food impact?
Emission of greenhouse gases
Eutrophication
Resource consumption (land, energy, water)
Loss of biodiversity
Toxicity
Emission of GHG → What are the primary greenhouse gases associated with food production?
Methane (CH4) from ruminants, manure, and soils;
nitrous oxide (N2O) from nitrogen in fertilizers, manure, and soils.
CO2 from fossil fuels, deforestation and organic soils
What are the main sources of greenhouse gas emissions from wild-caught seafood?
Fuel and refrigerants (e.g., R22).
Eutrophication → what is eutrophication?
The process in which a body of water becomes overly enriched with minerals and nutrients, primarily nitrogen and phosphorus, leading to excessive growth of algae and aquatic plants
What percentage of eutrophication is contributed by agriculture?
75%.
What is the limiting factor for eutrophication in freshwater versus land and sea?
Phosphates (phosphorus) are typically the limiting factor in freshwater, while nitrogen is often the limiting factor on land and at sea.
What are the main causes and solutions for agricultural and processing eutrophication?
Causes: fertilizers in agriculture and waste-water from processing or net-pen aquaculture
Solutions include more precise fertilization, water treatment and nutrient recirculation, and closed aquaculture.
Resource consumption → What are the main categories of resource consumption evaluated in food environmental impacts?
Land (deforestation, desertification, competition), energy (fertilizer production, field work, fishing, processing, transports), and water.
What are the other critical environmental impact categories beyond climate change, eutrophication, and resource consumption?
Biodiversity (loss of species and ecosystem services) and toxicity (use of pesticides, cadmium, and antifouling paints in the food chain).
What are commonly used quantification methods for environmental performance?
Life Cycle Assessment (LCA)
Ecological Foot-printing
Eco-efficiency
Technology assessment
Environmental Impact Assessment (EIA).
What is Life Cycle Assessment (LCA)?
A tool that systematically and quantitatively expresses how a product affects the environment from raw material extraction to waste (cradle-to-grave)
LCA helps you map environmental pressures, indentify if they are large or small and understrand in depth and see the system effects so you can…
Communicate and prioritize actions, be safe in debeate and optimize activities
What are the four main steps of Life Cycle Assessment (LCA)?
Goal and scope
Life cycle inventory
Impact assessment
Interpretation
Goal and scope → You must define the purpose of LCA, what must you answer? o
You must answer:
Why is the LCA being done
Who is the commissioner
Who is the audience
How are the results going to be used
It is a sialogue between the commissioner and practitioner
Goal and scope → what common questions must you respond to know the goal and the scope of the model?
How large is the environmental impact of the product?
Which part of the life cycle is affecting the most?
Is the alternative product A better than B?
Whay should in order to make the most improvement?
What is a functional unit in LCA?
A normalisation of data to a common "denominator" that reflects the system's function (e.g., 1 kg of food, 1 liter of beverage, 1 m2 of protected surface for 10 years).
Goal and scope → how to define the systems boundaries?
Where is the cradle?
Where is the grave?
What cut-offs can be done?
What does the Life Cycle Inventory (LCI) step involve?
Collecting specific and generic data on input resources (energy, materials, land, water) and output emissions (to air, water, soil, waste, and by-products) for each step within the system boundaries.
What does the Impact Assessment step do in LCA?
Calculates results by translating inventory data into potential environmental impacts (such as global warming potential in kg CO2 eq, acidification in kg SO2 eq, and eutrophication in kg NO3 eq).
What does the Interpretation step involve in LCA?
Analyzing results, checking completeness, consistency, sensitivity/uncertainty, and revisiting previous steps if needed.
What is the eventual problem with LCA?
The allocation problem: LCA gets complicated when a single process makes multiple products (e.g., a cow produces meat and leather and dairy).
What are the four main methods to handle allocation when multiple products or by-products emerge from a process?
Sub-divide the production process
Use system expansion
Allocate the environmental burden based on physical attributes (e.g., mass, energy content),
Allocate the environmental burden based on economic value.
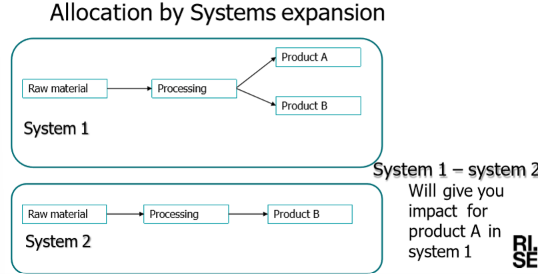
What is allocation by system expansion?
A method where the system boundary is expanded to include the additional functions of co-products, subtracting the avoided impacts of alternative production systems from the main product system.
Identify the main product you are studying (e.g., Product A).
Identify the co-product (e.g., Product B).
Determine what Product B replaces. Imagine Product B is a bio-based plastic. If we didn't make it here, the world would have to make that plastic out of fossil fuels.
Expand the system. You expand your study to include the production of that avoided fossil-fuel plastic.
Subtract the avoided impact (The Credit). Because your process created Product B (which saved the world from making fossil-fuel plastic), you give your main product (Product A) an "environmental credit." You subtract the impact of the avoided fossil-fuel plastic from the total impact of your system.
ENVIRONMENTAL SUSTAINABILITY OF COMPANIES → How is the overall "environmental performance" of a company organized and calculated?
Product Life Cycle Performances:
The impacts of the products the company makes, from cradle to grave (raw materials, manufacturing, consumer use, disposal).
Influenced by: Product development, sourcing, packaging, and transport.
Environmental Performances of Selected Technology:
The impacts of the specific machinery, equipment, and production lines the company chooses to use.
Influenced by: Engineering choices, factory design, and equipment efficiency.
Environmental Performances of Operations:
The daily, ongoing impacts of running the business (e.g., heating the factory, lighting the office, company vehicle fleets, business travel).

What does the "Degrees of freedom to make changes" graph illustrate in the context of product/company development?
It illustrates a core rule of sustainable design: The earlier you make changes, the easier and cheaper it is.
Degrees of freedom are highest at the idea and lab scale stages and decrease significantly as a process moves to pilot and full scale.
If you want to make a product more sustainable, you must do it at the "Idea" stage. If a company waits until the product is already in full production, they have locked themselves into whatever environmental footprint that design has

What is the average greenhouse gas impact of present food consumption in Sweden per person per year compared to the sustainable level?
Present food consumption is around 2 tonnes (CO2 eq) per person and year, whereas the global sustainable level is below 1.5 tonnes (consistent with limiting warming to <1.5 °C).
ENVIRONMENTAL SUSTAINABILITY CONSUMPTION → How is total environmental impact calculated in food consumption?
Total environmental impact = amount of product * (impact / amount of product).

How do different diets compare in terms of reduced climate impact per person and year?
From highest to lowest impact: increased meat consumption, today's diet (~2 tonnes), no-waste diet, season-adjusted diet, dietary guidelines (1.4–1.7 tonnes), climate-smart median diet (0.9–1.3 tonnes), ovo-lacto vegetarian diet, and vegan diet.

What is the effect of changing the functional unit (FU) from mass to nutritional metrics like protein or iron?
Changing the FU changes the comparative environmental impact metrics (e.g., GWP per gram of protein is 1.4 times higher than kg, and per mg of iron is 6 times higher).

What are the main challenges and solutions regarding the "Environmental Sustainability of Consumption"?
1. The Overshoot: In countries like Sweden, the emissions from just food consumption (1.5–2 tonnes CO₂/person) already exceed the total sustainable limit for an individual (1.5 tonnes).
2. The Biggest Lever: Shifting diets away from meat and animal products toward plant-based foods (a vegetarian/vegan diet) drastically reduces the climate footprint.
3. The Measurement Problem: Comparing food by weight (1 kg vs 1 kg) is unfair. We must use "Nutrient Density" as a functional unit to compare foods based on their health value per unit of environmental impact.
4. The Behavioral Challenge: Changing consumption requires guiding consumers through thousands of daily "micro-decisions" using tools and better information.
What is the Nutrient Rich Food 9.3 (NRF9.3) index used for in sustainable consumption?
As a starting point for dietary quality scores to assess nutrient density in combination with environmental assessments.
What are the main takeaways regarding food and the environment?
Food contributes substantially to global/local impacts, greenhouse gas increases will affect global production, indicators are not always aligned, and we need to address both what we eat and how we produce food.
What is social sustainability?
assessing the impacts on all stakeholders involved in the value chain. This includes:
Workers (e.g., Are they paid fairly? Are there unsafe conditions?)
Local Communities (e.g., Does the factory pollute their water? Does it support local jobs?)
Consumers (e.g., Is the product safe? Does it respect cultural heritage?)
Society (e.g., Does the business pay taxes? Is it involved in political conflict?)
Value Chain Actors (e.g., Are suppliers treated fairly?)
What is Social Life Cycle Assessment (S-LCA)?
S-LCA is a tool used to measure the social and human impacts of a product across its entire life cycle (from raw materials to disposal).
How it works: It focuses on stakeholders (workers, local communities, consumers, society) and measures impact categories like human rights, working conditions, and health/safety.
Difference between social and environmental sustainibility:
Environmental (E-LCA): Has a very solid scientific basis. A gram of CO₂ is a gram of CO₂ everywhere in the world.
Social (S-LCA): There is no general scientific basis. It is highly stakeholder-based and study-specific. What is considered "fair pay" or "acceptable working hours" changes depending on the country, culture, and the specific companies involved.
How is Social Life Cycle Assessment (SLCA) structured?
Stakeholder Categories: Who is affected? (Workers, Local Community, Society, etc.)
Impact Categories: What is the broad issue? (Human rights, Working conditions, Health and safety, Governance).
Subcategories & Indicators: How do we measure it? For example, under the stakeholder "Workers" and category "Human Rights," the subcategory might be "Child Labor." The indicator would be the percentage of child labor in the workforce.
What are the main steps in Social Life Cycle Assessment (SLCA)?
Goal and scope definition
Life cycle inventory (data collection across unit processes)
Impact assessment (using referencing scales from ideal performance +2 to starkly below compliance -2, or risk levels)
Interpretation (completeness, consistency, sensitivity checks, and materiality assessment).
How is the data in social LCA?
Like the environmental version, the Social LCA requires collecting data on every step of the process. However, instead of looking at inputs like water and energy, it looks at things like:
Number of accidents
Wages paid compared to the living wage
Hours of training provided
Occurrence of child labor
How is the impact assessment done in SLCA?
Because social data is often qualitative (hard to put into a strict number), the S-LCA uses a Reference Scale (shown on page 68). It scores the performance of a company on a scale from -2 to +2:
+2: Ideal performance (Best in class)
+1: Beyond compliance (Doing more than the law requires)
0: Compliance (Following local laws and basic societal expectations)
-1: Slightly below compliance
-2: Starkly below compliance (e.g., using illegal child labor)
How to check if SLCA strudy is valid:
Completeness check: Did we cover all the important steps?
Consistency check: Did we apply the same rules to all parts of the supply chain?
Sensitivity check: What happens if our data is slightly wrong?