Performance Measurement
 Call Kai
 Learn
 Practice Test
 Spaced Repetition
 Match
 Flashcards
 Knowt Play
1/69

There's no tags or description
Looks like no tags are added yet.
70 Terms
4 attributes of an effective attribution process
account for all the portfolio’s returns or risk exposure
reflect the investment decision-making process
quantify the active decision of the PM
provide a complete understanding of the excess return/risk of the portfolio
Performance attribution
how that performance was achieved or how the risk was incurred
explain absolute or relative return
what portion was driven by active mgr. decisions
decompose excess return into component sources
decompose risk
Performance Evaluation
Draw conclusions regarding the quality of performance
Distinguish manager luck from skill
Return attribution
analyze the impact of the active investment decision on returns
Risk attribution
analyze the risk consequences of those decisions
absolute or benchmark relative terms
Micro attribution
understanding the drivers of a mangers returns and whether those drivers are consistent with the stated investment process
analyzes the small decisions that lead to gains/losses such as security selection, sector allocation
Macro attribution
Decision #1: deviations from the strategic asset allocation
success = overweighting an asset class that outperforms its benchmark (or combined weighted benchmark)
Decision #2: selection of investment managers
seccess = selecting a manager that outperforms their benchmark
Return-based attribution
Uses historical total portfolio returns to estimate the sources of performance without examining individual holdings.
Best used: When detailed portfolio holdings or transaction data are unavailable.
Advantage: Easiest and least data-intensive to implement.
Disadvantages: Least precise; relies on statistical estimates and is vulnerable to data manipulation or model selection bias.
Holdings-based attribution
uses actual holdings (beginning of period)
all transactions are assumed to occur at the end of the day
accuracy improves when data has shorter time intervals
most appropriate for investment strategies with little turnover
Transaction-based attribution
Uses both the holdings and the transactions during the evaluation period
Most accurate, but most difficult and time consuming to implement
more complex version of holdings-based
Top-down vs Bottom Up
Top-down: Start with the total return → work backward to estimate the sources.
Bottom-up: Start with individual securities/trades → build up to the total return.
Top-down → returns based
Bottom-up → holdings-based and transaction based
Brinson-Hood-Beebower (BHB) - Equity Atrribution
Use the chart like you are trying to find the area (length * width) of the square you need
Rewards mangers when they overweight a sector with return > 0 and underweight a sector with a return < 0
drawback is that if all sectors returns > 0 you can’t overweight them all so you are punished and on the alternative if all sector returns are < 0 you can underweight them all
To draw square AI is bull shit (BS)

Brinson-Fachler (BF) - Equity Atrribution
Differs from BHB only by the second term (rb - Rb) versus just rb
rB -RB = return on the sector - return on the benchmark.
Therefore, it takes into account if the sector beat the benchmark, whereas BHB does not.

Factor-based - Equity Attribution
Fundamental factor model
decompose contributions to excess returns from factors
RMRF = return on market minus risk free rate → market risk premium
SMB = small minus big → small-cap vs large-cap stocks
HML = high minus low → value vs. growth stocks (book-to-market ratio)
WML = Winners minus losers → momentum: past winners vs. past losers

Exposure Decomposition - Fixed Income Attribution
Top-down approach
Benchmark vs Portfolio
Benchmark
duration
yield curve positioning
sectors (i.e. government corporate)
Portfolio
active decisions to deviate from benchmark exposures
how well, relative to the benchmark, did active decisions work out, what contribution to active return
used primarily for client reports, easy to understand
Examples:
active duration bets → increase duration relative to benchmark in anticipation of falling rates
yield curve positioning → barbell for a flattening curve
sectors → overweight credits in anticipation of spreads narrowing
Yield curve decomposition (duration based) - Fixed Income Attribution
Can be either top-down or bottom-up
Estimates the returns based on duration
%total return = %income return + %price change
%price change = -ModDur * Δyield
Applied to both the portfolio and the benchmark
difference = effect of active PM decision
requires more data points than exposure decomp.
Typically used in reports for analysts and PMS
Yield curve decomposition (full repricing) - Fixed Income Attribution
Instead of using estimates
therefore does not have residuals unlike duration based
prices out each security
most complex attribution of the three fixed income approaches
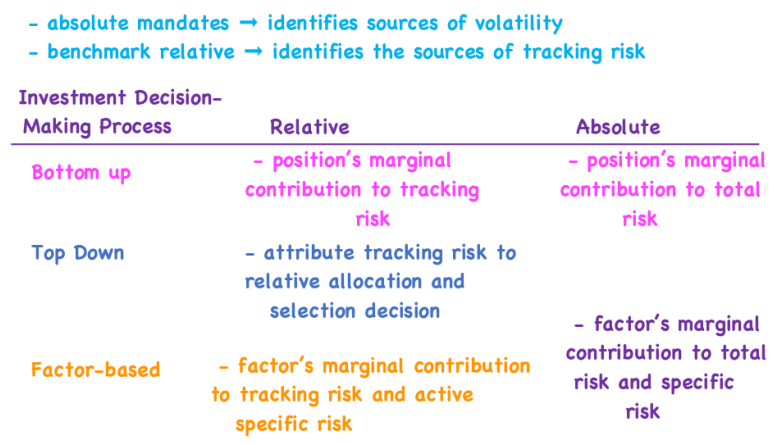
Considerations in selecting a risk attribution approach
Liability-based benchmarks
focus on the cash flows the assets must generate
track a fund’s progress towards fully funded status or track the performance of assets relative to the changes in liabilities
characteristics of the liabilities influence the composition of the asset portfolio
Properties of a valid benchmark
unambiguous - securities/weights clearly identified
investable - possible to replicate and hold the benchmark to earn its return
measurable - on a reasonably frequent and timely basis
appropriate - consistent with the PMs style or area of expertise
reflective of current investment opinions - manager should be familiar with constituent securities
specified in advance - constructed prior to evaluation period
accountable - manager should accept it.
Absolute return benchmark
a minimum target return
not investable, do not satisfy benchmark validity criteria
Factor-model-based benchmarks
are ambiguous, not specified in advance, may not be investable
(e.g. many ways to get value exposure)
Manager universe
manager peer group
broad group of manager with similar investment disciplines
expected to beat median manager
fails all tests of benchmark validity
Custom-security-based
built to reflect investment discipline of a specific manager
satisfies all benchmark validity criteria
will reflect the investment process + all constraints
Benchmark quality
Return on portfolio (P) = benchmark (B) + active return (A)
benchmark = market return (M) + incremental style return (S)
There P = M + S + A
Difficulties in benchmarking alternative investments
lack of investible market indexes
frequent use of leverage
limited liquidity
lack of readily available market values benchmark
use of IRR vs. twrr
Benchmarking Hedge Funds
encompass a broad range of possible strategies
may have an unlimited investment universe
rf + spread is sometimes used
fund manager universe may be used as a benchmark
Private equity benchmarks
mostly peer group benchmarks
Limitations
valuation methods may differ
RR depends on timing of gains/losses/CFs
PME - public market equivalents
base on aggregated cash flow data
Sharpe Ratio
risk-adjusted return of an investment or portfolio

Treynor Ratio
risk-adjusted performance measure that evaluates how much excess return a portfolio generates for each unit of systematic (market) risk it takes on
uses systematic risk
requires an appropriate benchmark as a proxy for systematic risk
works well for diversified portfolios

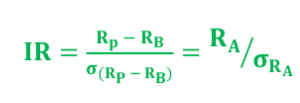
Information Ratio
active return per unit of active risk
Appraisal Ratio
measures an investment manager's stock-picking skill by comparing a fund's alpha to its unsystematic (residual) risk

Sortino Ratio
measures an investment's risk-adjusted return relative specifically to downside risk rather than total volatility
can assess performance when return distributions are not symmetrical
Therefore, better for hedge funds & commodity trading funds

Capture ratios
measures the PM’s participation in up and down markets
upside capture (UC) - when benchmark is positive
downside capture (DC) - when benchmark is negative
Upside/downside ration = UC/DC
measures the asymmetry of return
> 1 = positive asymmetry (convex return profile)
< 1 = negative asymmetry (concave return profile)
Longer-term use case, drawdowns are more critical for short-term
Uses geometric means to measure

Drawdown
Measures how much a portfolio has fallen from its previous peak
It is a measure of downside risk, focusing on losses rather than overall volatility
Maximum drawdown
cumulative peak-to-trough loss during a continuous period
Drawdown duration
total time from first drawdown to recovery

Semideviation
Denominator of the sortino ratio

Manager Universe - Investment Manager Selection
The feasible set of investment managers, screened based on:
suitability
investment style
active versus passive management
Quantitative Factors in Management Selection
Performance track record
Attribution/appraisal
Qualitative Factors in Management Selection
Investment Due Diligence
philosophy
investors investment beliefs and rationale for generating returns
process
how the philosophy is implemented
people
portfolio
are the actual holdings and risk exposure consistent with the philosophy and process
Operational Due Diligence
process and procedure
internal controls, trade settlement, valuation etc.
investment vehicle
legal structure, custody, administration, regulatory oversight
terms
fess, liquidity, redemption restrictions setc
monitoring
Type I Error - Manager Selection
H0: manager has no skill
Rejecting the null when its true
Hiring / retaining a manager who subsequently underperforms
type I errors are errors of commission = create explicit costs (vs. Type 2 = errors of omission = create opportunity costs)
psychologically, Type I errors are more painful
Type II Error - Manager Selection
not hiring / firing a manager who subsequently outperforms
less likely to be measured
Style Analysis
Managers self-reported risk exposures are compared the the results of a returns-based or holdings-based style analysis
Should be consistent over time, deviations signal issues such as style drift
Returns-Based Style Analysis (Quantititative)
top-down approach
Determines the managers investment style by examining historical portfolio returns.
Involves estimating the portfolio’s sensitivities to security market indexes representing a range of distinct factors
Does not require a large amount of difficult or hard to acquire data
comparable across managers through time
provides an objective check not subject to window dressing
Drawbacks:
portfolio being analyzed may not reflect the current or future portfolio exposures
illiquid securities tend to have stale prices (smoothed returns)
Holdings-based style analysis (Quantitative)
Bottom-up approach
classifies the actual holdings in a portfolio at a point in time (estimates current risk factors)
comparable across managers and through time
subject to window dressing
requires manager transparency
Capture rations, drawdowns
Investment Philosophy
The managers underlying assumptions about the factors that drive performance
Passive: seek risk premiums from factor exposures
Active: security mispricing can be both identified and exploited
Behavioural: created by the actions of other market participants, temporary but numerous
Structural: created by internal or external rules and regulations → long lived
Questions to ask on investment philosophy
Can the manager clearly and consistently articulate their investment philosophy
Are the assumptions credible and consistent
How has the philosophy developed over time
Are the return sources linked to credible and consistent inefficiencies
Investment Personnel
Does the investment team have sufficient expertise and experience
Do they have sufficient depth
what is the level of key person risk
what kinds of agreements and incentives exist to retain and attract key employees
what has been the turnover
Investment Making Decision Process (4 Elements)
Signal creation (idea generation)
Signal Capture (Idea Implementation)
Portfolio Construction
Monitoring the Portfolio
Signal Creation (Idea Generation)
Signal creation (idea generation)
how are investment ideas generated
is the information:
unique (informational edge)
timely (timing edge)
implemented differently
Signal Capture (Idea Implementation)
Transitioning the idea into an investment position
what is the process
is it repeatable
Portfolio Construction
How positions are implemented
How are allocations set and adjusted
should be consistent with the investment philosophy and process
Are allocations consistent with conviction
over/under-weightings
How has growth in AUM affected portfolio characteristics
Are stop-losses used to manage risk
What types of securities are used how are hedges implemented
How are long and short ideas expressed - paired or indep.
What levels of liquidity are maintained - any limitations
Groupthink
occurs when a team minimizes conflict and dissent in reaching and maintaining a consensus
some members may withhold information and perspectives
(go along to get along)
Mitigation: keep team size 3-5
Authority bias
Group defer to a group member that is a subject matter expert or in a position of authority
Mitigation: secret ballot for votes
Aversion to complexity
disproportionate attention is given trivial issues at the expense of important but harder to grasp topics
aka Parkinson’s Law
Mitigation: meeting agendas drafted in advance → most important topics covered first
Two Broad Types of Investment Vehicles
Individually managed accounts
Pooled or comingled vehicle
Individually Managed Accounts
Advantages
Ownership
not liquidity effects from other investors
Customization
Tax efficiency
Transparency
Disadvantages
Costs
Tracking risk
If SMA is customized performance will reflect investors constraint
Makes attribution messy
Investment behaviour
attempts to manage the account negates the benefit of hiring a manager
Pooled or Comingled Vehicle
Money from multiple investors is held as a single portfolio and managed without potential customization for any investor
Liquidity
various types of liquidity based on the investment vehicles (ETF most liquid to PE least liquid)
down side and upside - less liquid more often means higher return
Often have performance based fees
GIPS Standards
Globally accepted standards for calculating and presenting investment returns
Used for:
firms
asset owners
verifiers
Not an audit it says nothing about the legitimacy of the returns
GIPS 5 Objectives:
Promote investor interests and instill investor confidence
Ensure accurate and consistent data
Obtain worldwide acceptance of a single standard for calculating and presenting performance
Promote fair global competition among investment firms
Promote industry self-regulation on a global basis
GIPS Definition of Firm
an investment firm, subsidiary, or division held out to the public as a ‘distinct business entity’
Distinct business entity (needs all three)
unit, division, department, or office that is organizationally and functionally segregated from other units, divisions, departments, or offices
that retains discretion over the assets that it manages
that should have autonomy over the investment decision-making process
GIPS Reporting Frequency
Regular portfolios (time-weighted returns): monthly at month-end
Private market portfolios: quarterly
Pooled funds not in the composite: annually
Modified Dietz Approach
a method of calculating portfolio returns that adjusts for the size and timing of external cash flows (deposits and withdrawals)
Use when interim valuations at the time of cash flows are unavailable or costly
Less accurate than the two segment approach

Fair Value - GIPS Definition
the amount at which an investment could be sold in an orderly, arm’s length transaction between willing parties
should be the objective, observable, unadjusted quoted market price for an identical investment in an active market as of the measurement date
If the above is not possible then in order the follow:
quoted prices for similar investments in active markets
quoted prices for identical or similar investments in markets that are not active
market-based inputs, other than quoted prices, that are observable for investment
subjective, unobservable inputs
Composite
a group of portfolios managed according to a similar investment mandate, objective, or strategy
firms must include all actual, discretionary, fee-paying segregated accounts in at least one of the firm’s composites
eg: Composite A: US large-cap equity, Composite B US small-cap equity, Composite C: US Equity
An account could fit in the US large-cap and US equity composite
GIPS Reporting Timeline
A firm new to GIPS must initially present at least 5 years of historical performance (or since inception if less than 5 years). Add one year annually until 10 years are shown, then maintain a rolling 10-year history, dropping the oldest year each year.
Ie if a 20 year fund decided to report GIPS they would backdate at least 5 years of reporting, then year by year build until they have 10 years.
Required Elements of GIPS
composite and benchmark annual returns for all years
# of portfolios (if > 6) in each composite at period end
amount of assets in the composite
total firm assets at the end of each period
a measure of internal dispersion of individual portfolio returns for each annual period for each composite (# p >= 6)
3 yr. annualized ex-post s.d. of the composite and benchmark (if monthly composite returns are available)
Including Performance for an Acquired Co.
substantially all the investment decision makers are employed by Firm A
The decision-making process remains substantially intact and independent within Firm A
Firm A has records which document and support the reported performance
There must be no break in the track record between Firm A and Firm B
Verification Process
learn the firms policies and procedures
sampling of portfolios
sufficient testing on the sample to ensure the firm satisfies certain fundamental requirements
review selected portfolios - treatment of interest, dividends, taxes
Test construction/maintenance of composites
Review the firms GIPS Report for compliance
How to Define a Firm
adopt the broadest, most meaningful definition of a firm
Company ABC could be defined as Company ABC
When does a firm need to disclose the number of portfolios in a composite
When there are 6 or more portfolios