Quiz #5 - LING 313
 Call Kai
 Learn
Learn Practice Test
 Spaced Repetition
 Match
Match Flashcards
 Knowt Play
1/84

There's no tags or description
Looks like no tags are added yet.
Name | Mastery | Learn | Test | Matching | Spaced | Call with Kai | Chat |
|---|
No analytics yet
Send a link to your students to track their progress
85 Terms
How many types of Basic waves
2 types
transverse
longitudial
Transverse Wave
particles move upward and downward in a perpendicular motion

Longitudinal Wave
particles move forward and backward

what is similar between transverse and longitudinal waves
the particles themselves do not travel but the wave does
can be represented the same way as the transverse wave
both follow the principles of simple sine waves
something pushes its neighbour once they recover from it push it retracts (ossilations)
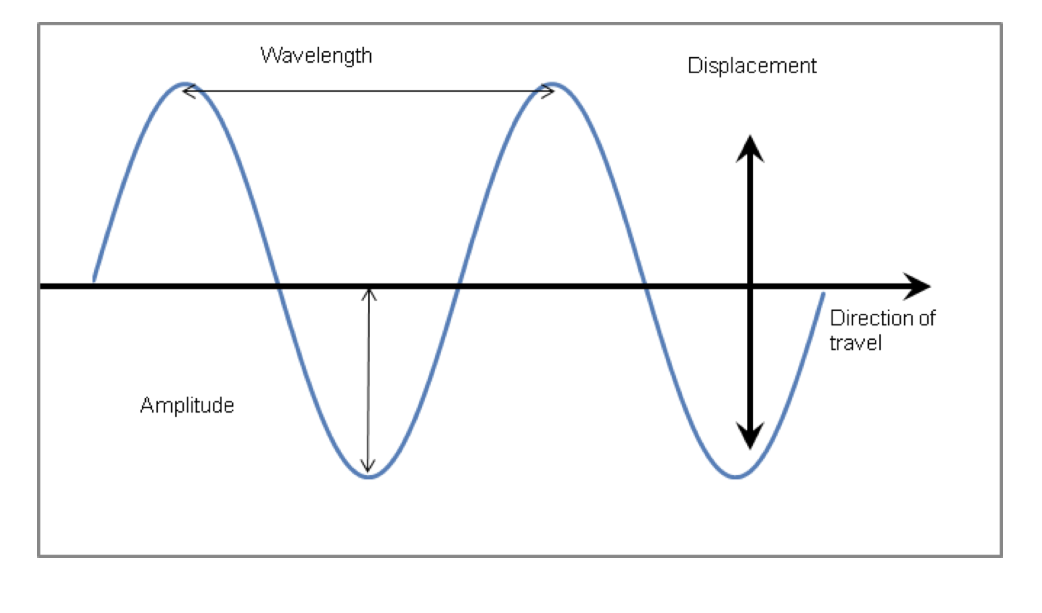
Explain transverse waves
Particles that we see move up and down
the particles are moving perpendicularly to the way the wave is moving
ex: a stadium people don’t move they just go up and down
Propogate
the movement of a wave through a medium that transfers energy, momentum, and information from one location to another without permanently displacing the medium's particles
Explain longitudinal waves
particle movement travels in the same direction as the wave
high-pressure zones correspond to the peaks, low pressure zones to the vally

Characteristics of simple waves
Frequency
Intensity
Phase
Frequency
how many cycles per second (how many full circles of movement)
measured in Hz
number of full cycles per second
Intensity
how strong are the oscillations (amplitude value gives us this)
measures in dB
Phase
when did the wave start
often measured in degrees (relative to another wave)
What is the formula for frequency when the period is in milliseconds?
Frequency = 1000 ÷ period (ms)
1 second = 1000 ms, so the number of cycles in one second = 1000 ÷ period in ms.
Frequency vs Pitch
frequency is an acoustic property
pitch is something that we perceive after interpreting those frequencies
the perception of frequencies are colored by the limitations of our hearing system
Amplitude
the distance betwwen the zero line and the peak or vally
displacement from the zero line
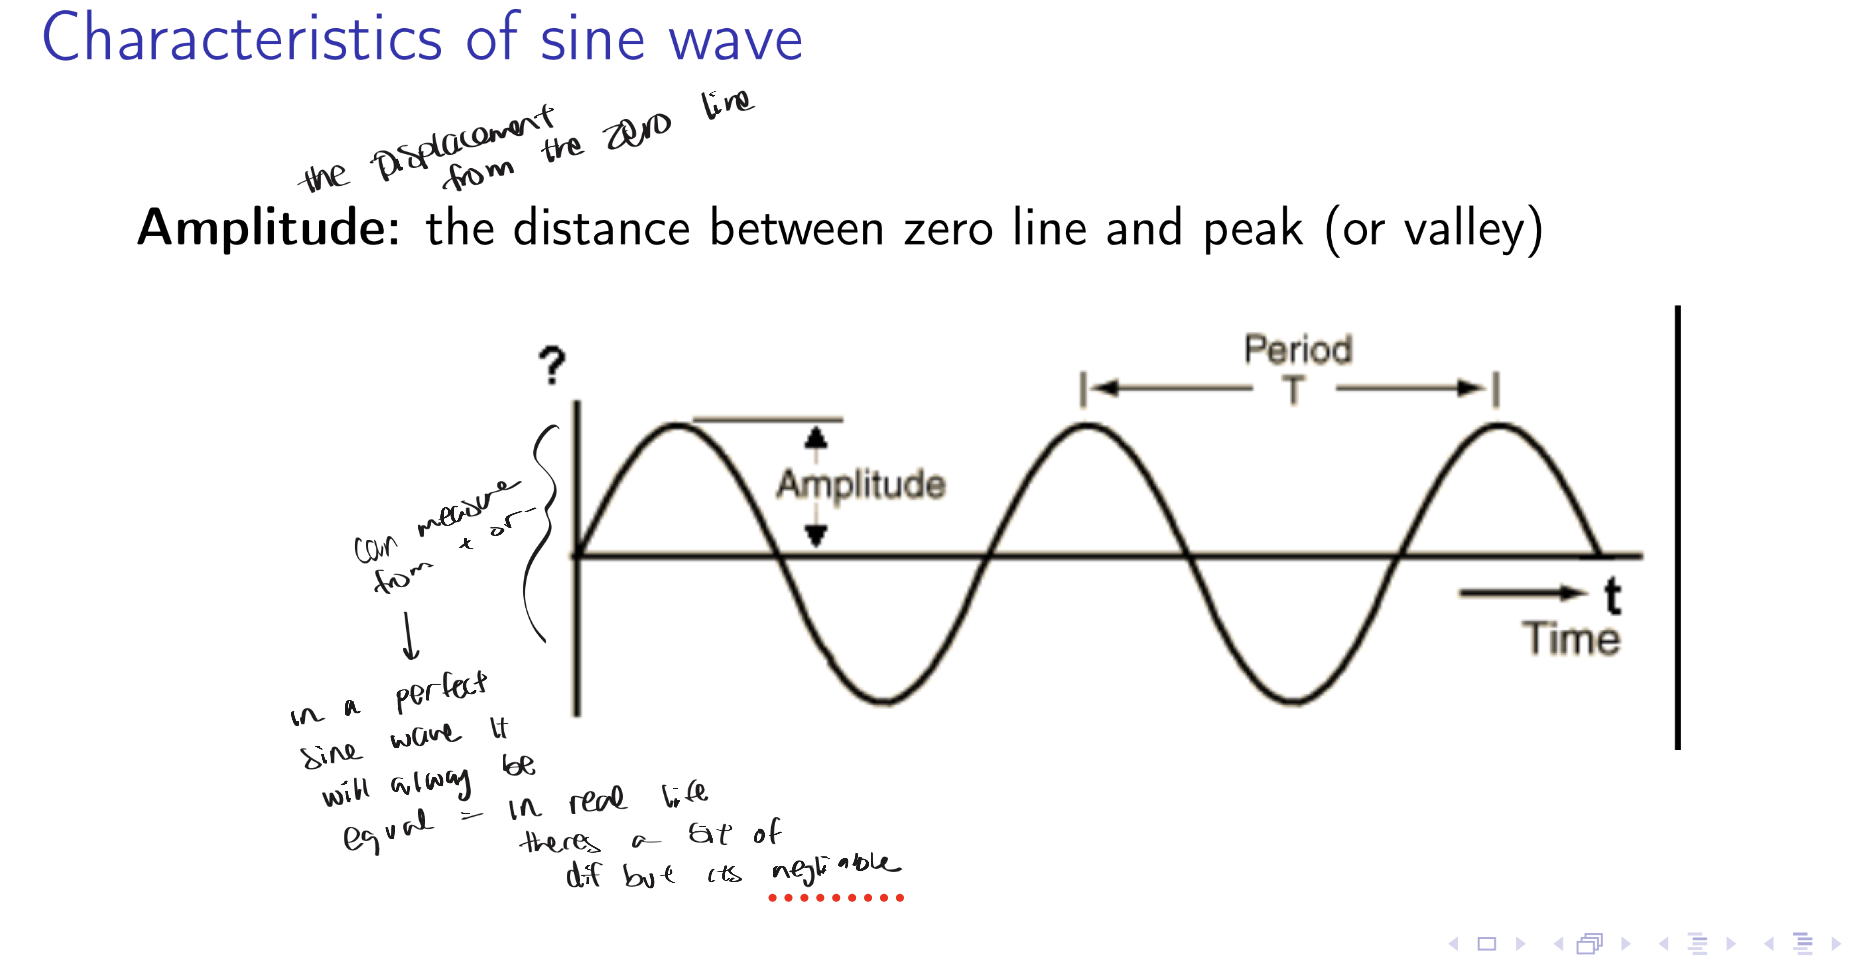
What would amplitude look like in a perfect sine wave
always be equal displacement positively and negatively from the zero line
ni real life there is a bit of buffer (but that is negligable)
amplitude vs loudness
amplitude is an acoutic property
loudness is something we perceive after interpreting amplitude in our hearing system
Phase
the timepoint when the wave started

Noise cancellation
180 degrees after the wave which cancels the sounds out
A wave graph has DISTANCE on the x-axis. What does it show, and what is one cycle called?
A picture of the wave spread out in space; one cycle = wavelength
Distance on the x-axis means it's a snapshot of the wave spread out in space (many particles at one moment), so one cycle is the wavelength (λ).
A wave graph has TIME on the x-axis. What does it show, and what is one cycle called?
One particle moving over time; one cycle = period
Time on the x-axis means it's one particle moving over time, so one cycle is the period (T).
what are speech sounds made up of
complex waves

Sine waves
simple waves with regular oscilating patterns

explain this sine wave
100hz (oscillates 100 times per second)
x and y axis represent
x - time
y- amplitude (pressure varaition in the air)
100 vs 200 hz wave

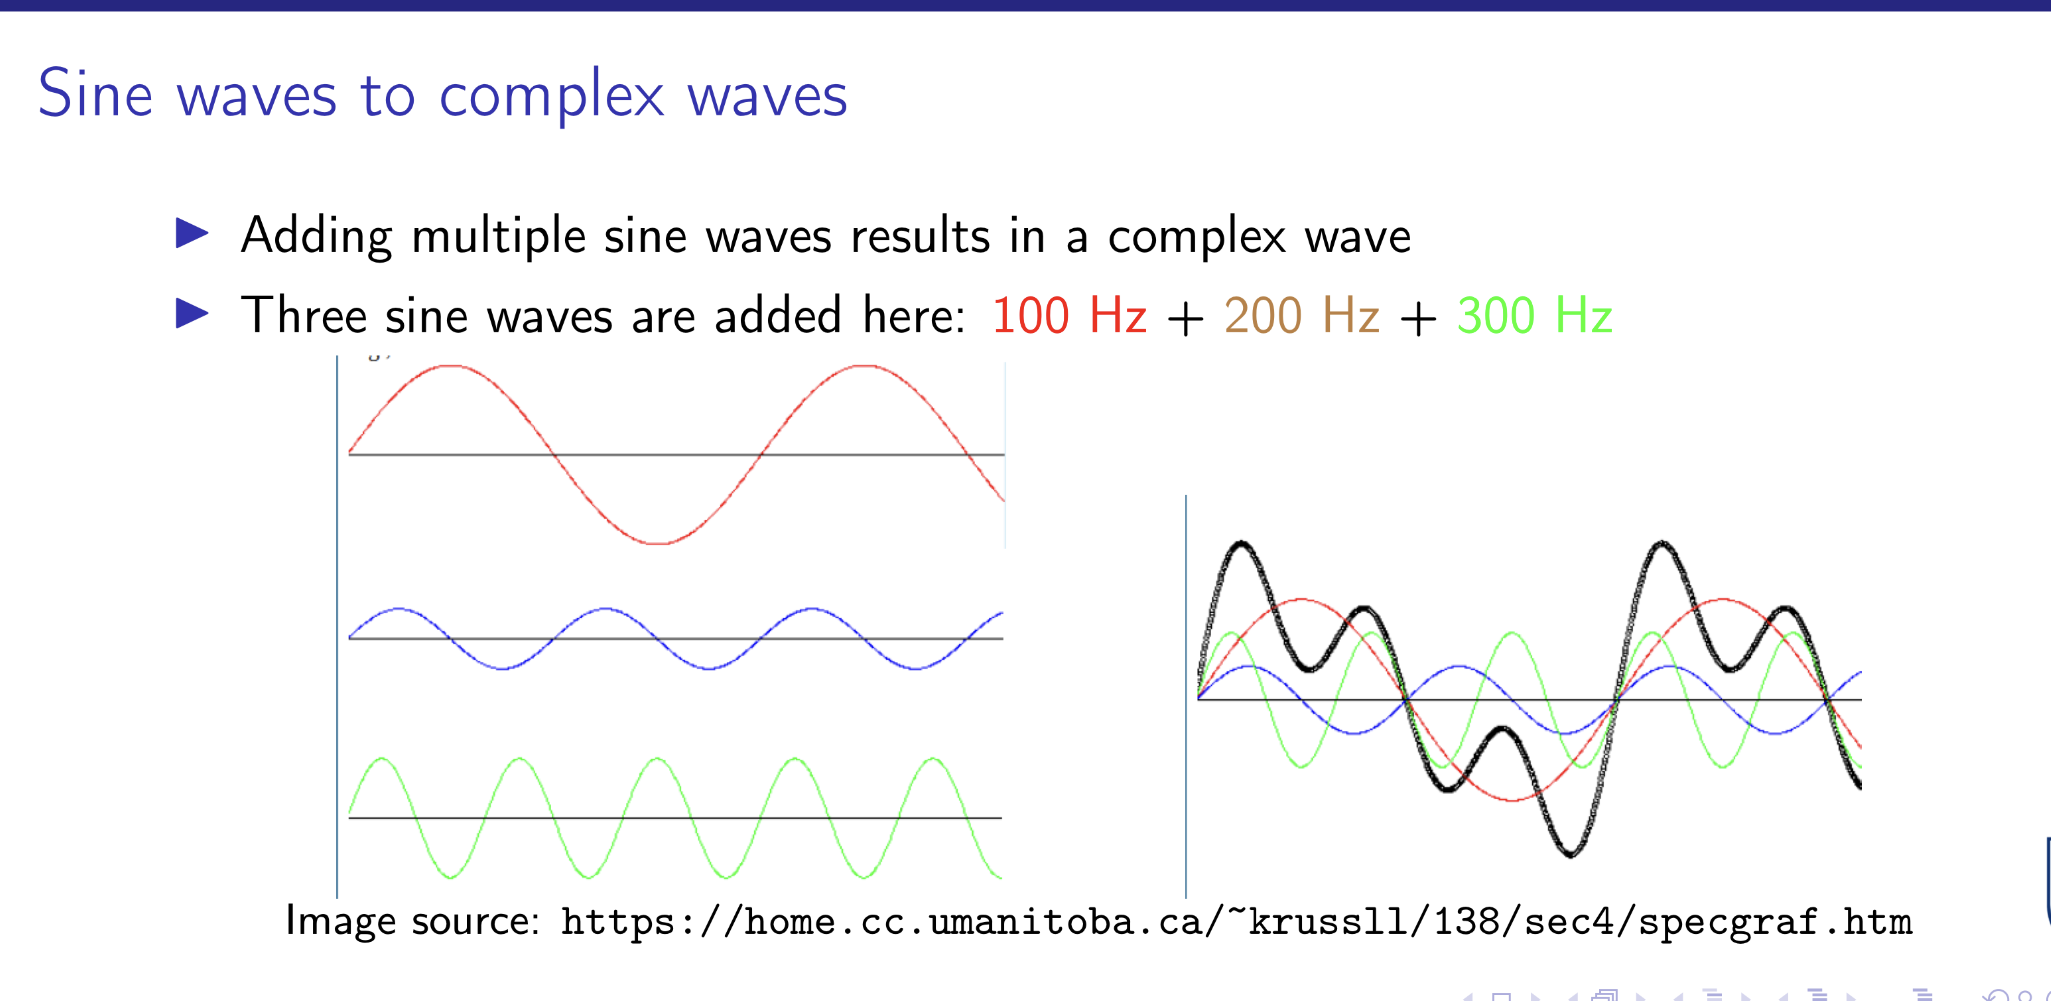
Sine wave → complex wave (how is it done)
adding multiple sine waves results in a complex wave
What do period waves mean in speech sounds
vowels, sonorants, prevoicing

periodicity
repeating patterns
aperiodic waves in speech sounds
voiceless fircatives

combination of periodic and aperiodic waves
voiced fricatives


cues in waveform (5)

complex waves to power spectrum
make a list of the sine waves in a complex wave
frquency
amplitude

complex waves to spectra
make a graph with frequency on the x axis and amplitude on the y axis

how are specturm and waveform different in terms of the info they provide
specturm doesnt have time
not changes across time its just a snapshot
spectra of vowels interesting info from spectrum
Fundamental Frequency (F0)
Formants (F1, F2, etc)
Individual Harmonics - component frequencies
Spectral Tilt
Fundamental Frequency
1st harmonic
lowest frequency that your vocal folds produce

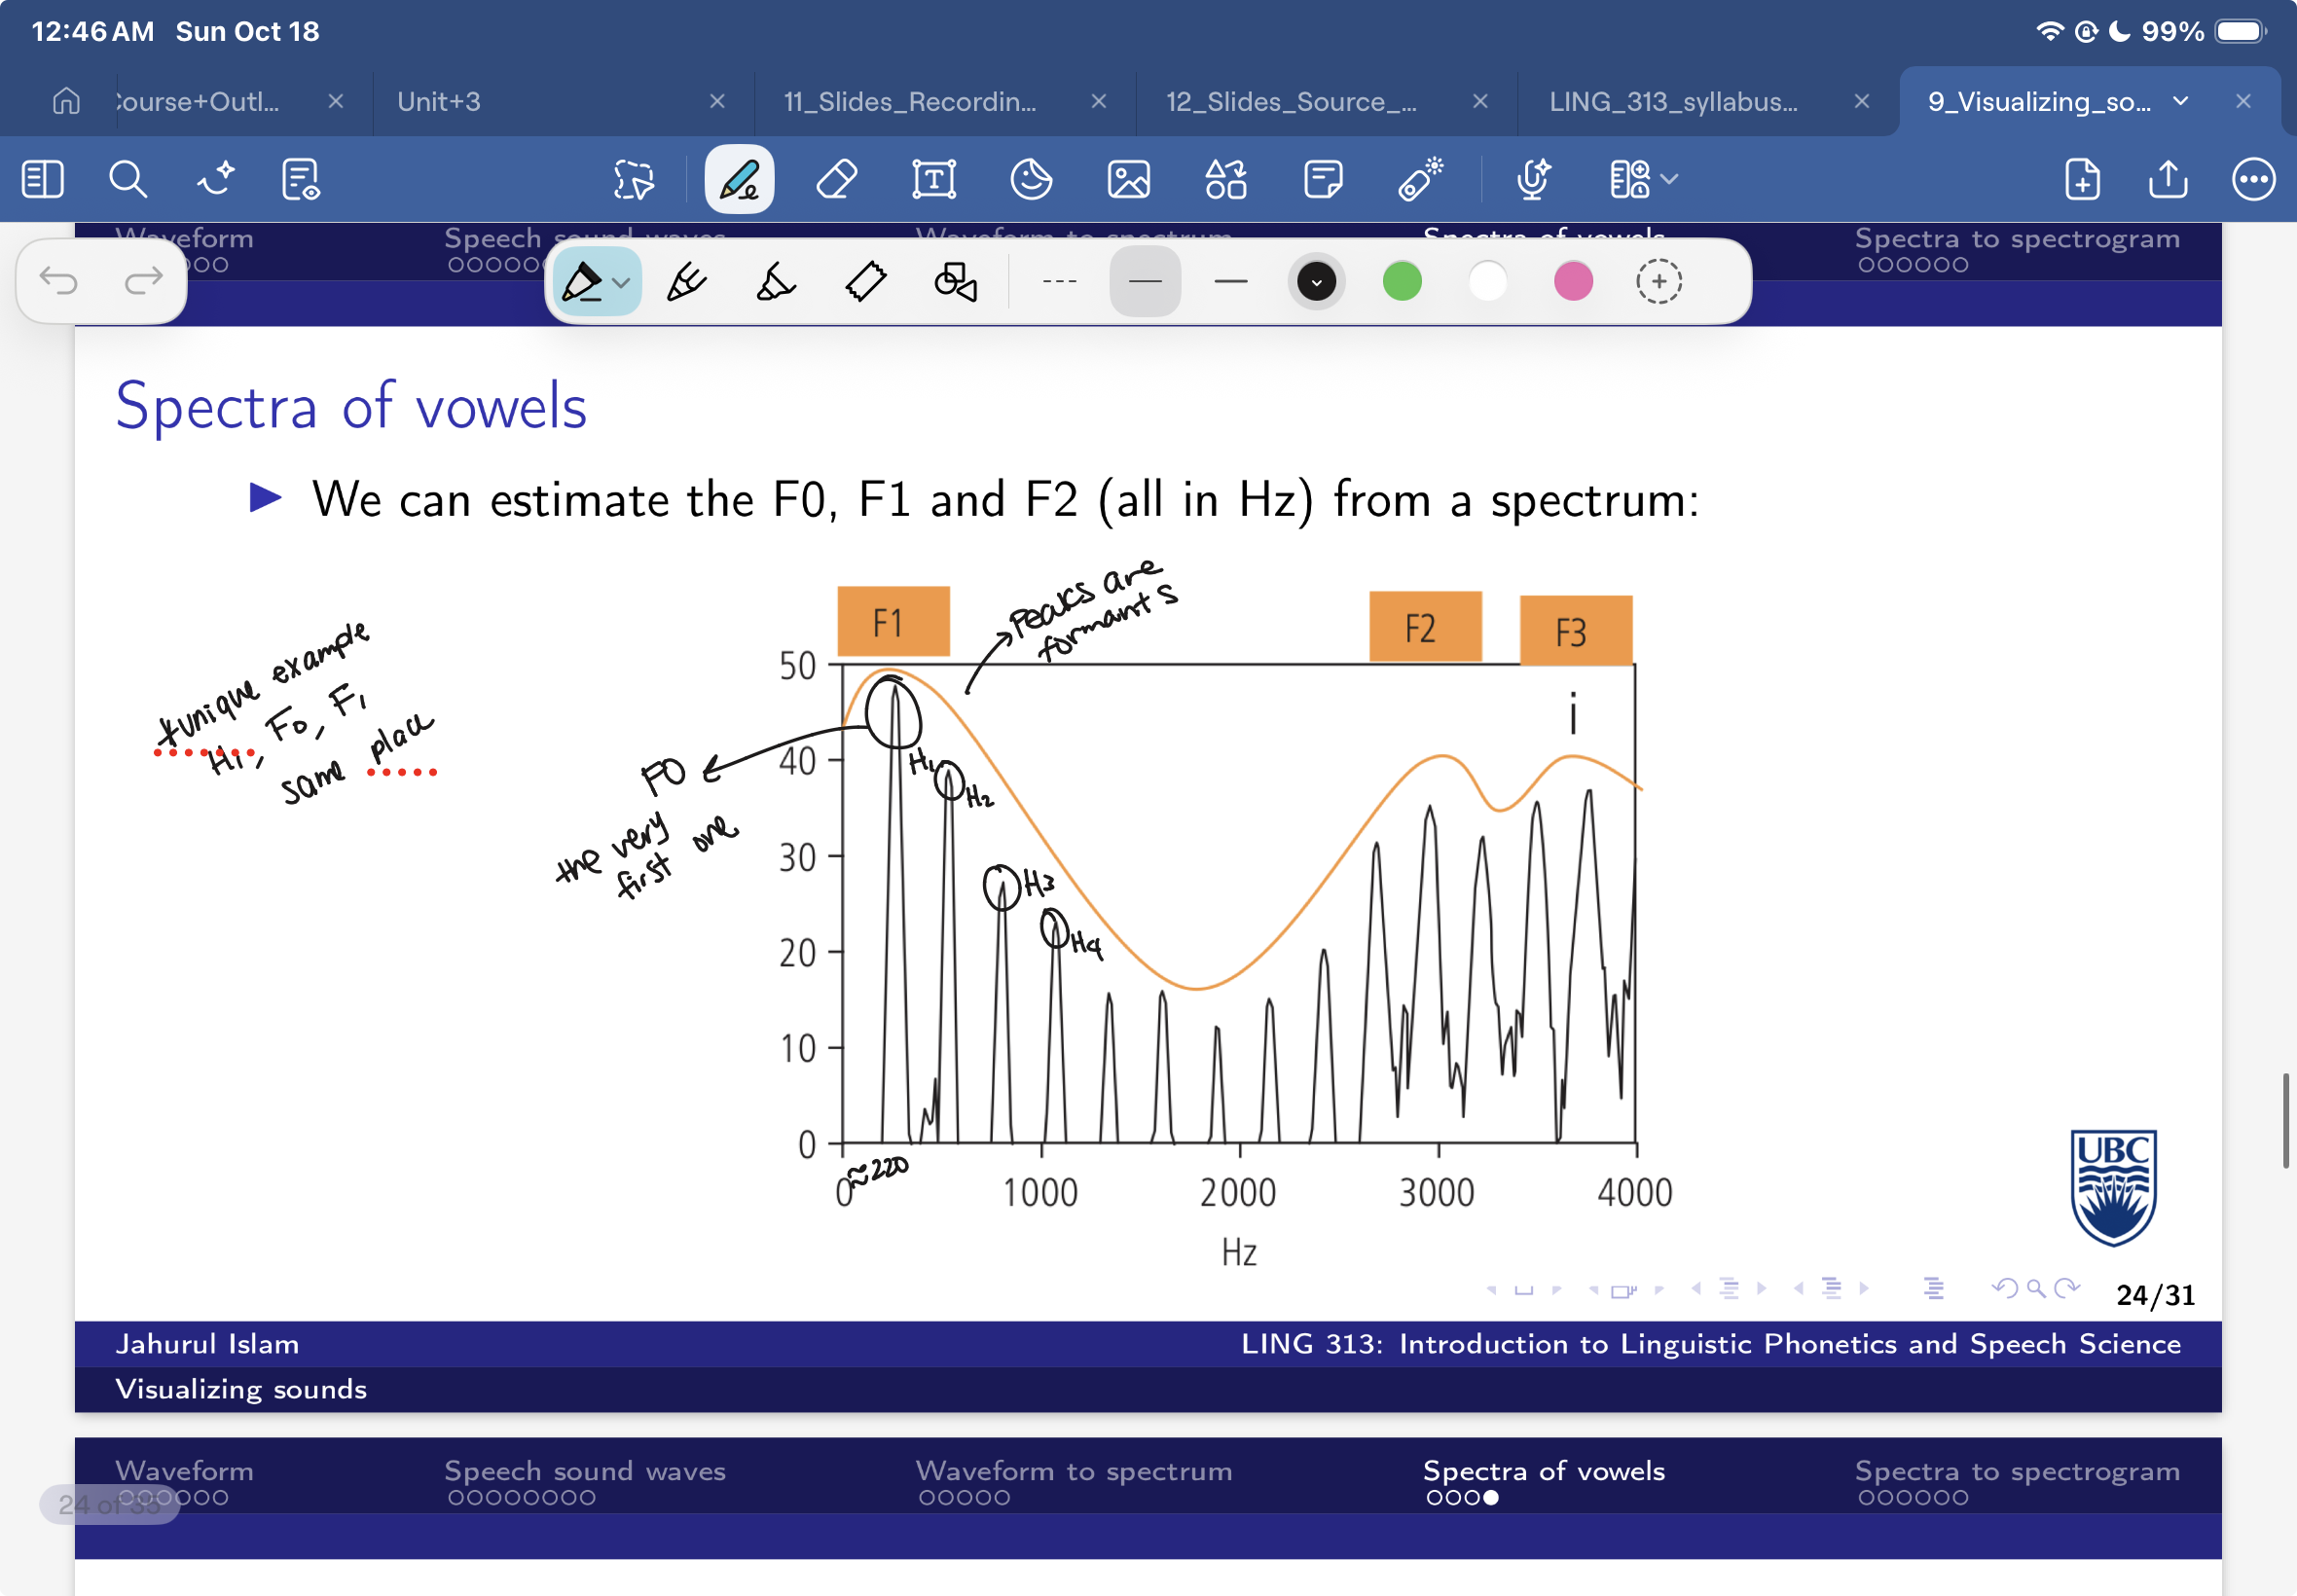
Formants
vowels show these


spectra to spectrogram
find the peaks in a spectrum and draw shades as verical lines
rotoate the spectrum 90 degrees anticlockwise
extract a clip from the right side of the figure (marked in red)
repeat with mulitple spectrum
what does high darkness mean on a spectrogram
higher amplitude
amplitude
how far the wave departs from zero

period
T
duration of one cycle in seconds

frequency
f
cycles per second in Hz

amplitude vs frequency vs phase

relationship between freqeuncy and periods
reciprocals

where does the sine wave come from
as you move on the wheel you can draw right angled triangles for your position
then extract the legnth of the hypotenuse and the “opposite” side
the sin of an angle is the ratio b/w opposite and hypotensue
as the angle changes the ratio (sine value) also changes

how does the sign wave become a curve
when the sine of an angle is plotted against that angle, the result is the classic “sine curve”
analog signals challenges
analong signals are continuous
a value exists for every possile time poin t
each value can be precise to infinitely many decimal points
this make them difficult to store, access, and analyze
computers can only store a finite list of numbers
to take advantage of modern computing we must digitze them
analog - to- digital conversion (ADC)
two steps one for each axis of the graph
sampling
measure the signal at regular moments in time (the time axis) keep those values and dump the rest
quantization
round each measurement to one of a limited set of values (the amplitude axis)
after sampling we have a table of values, these “discrete” values are what is stored on the computer
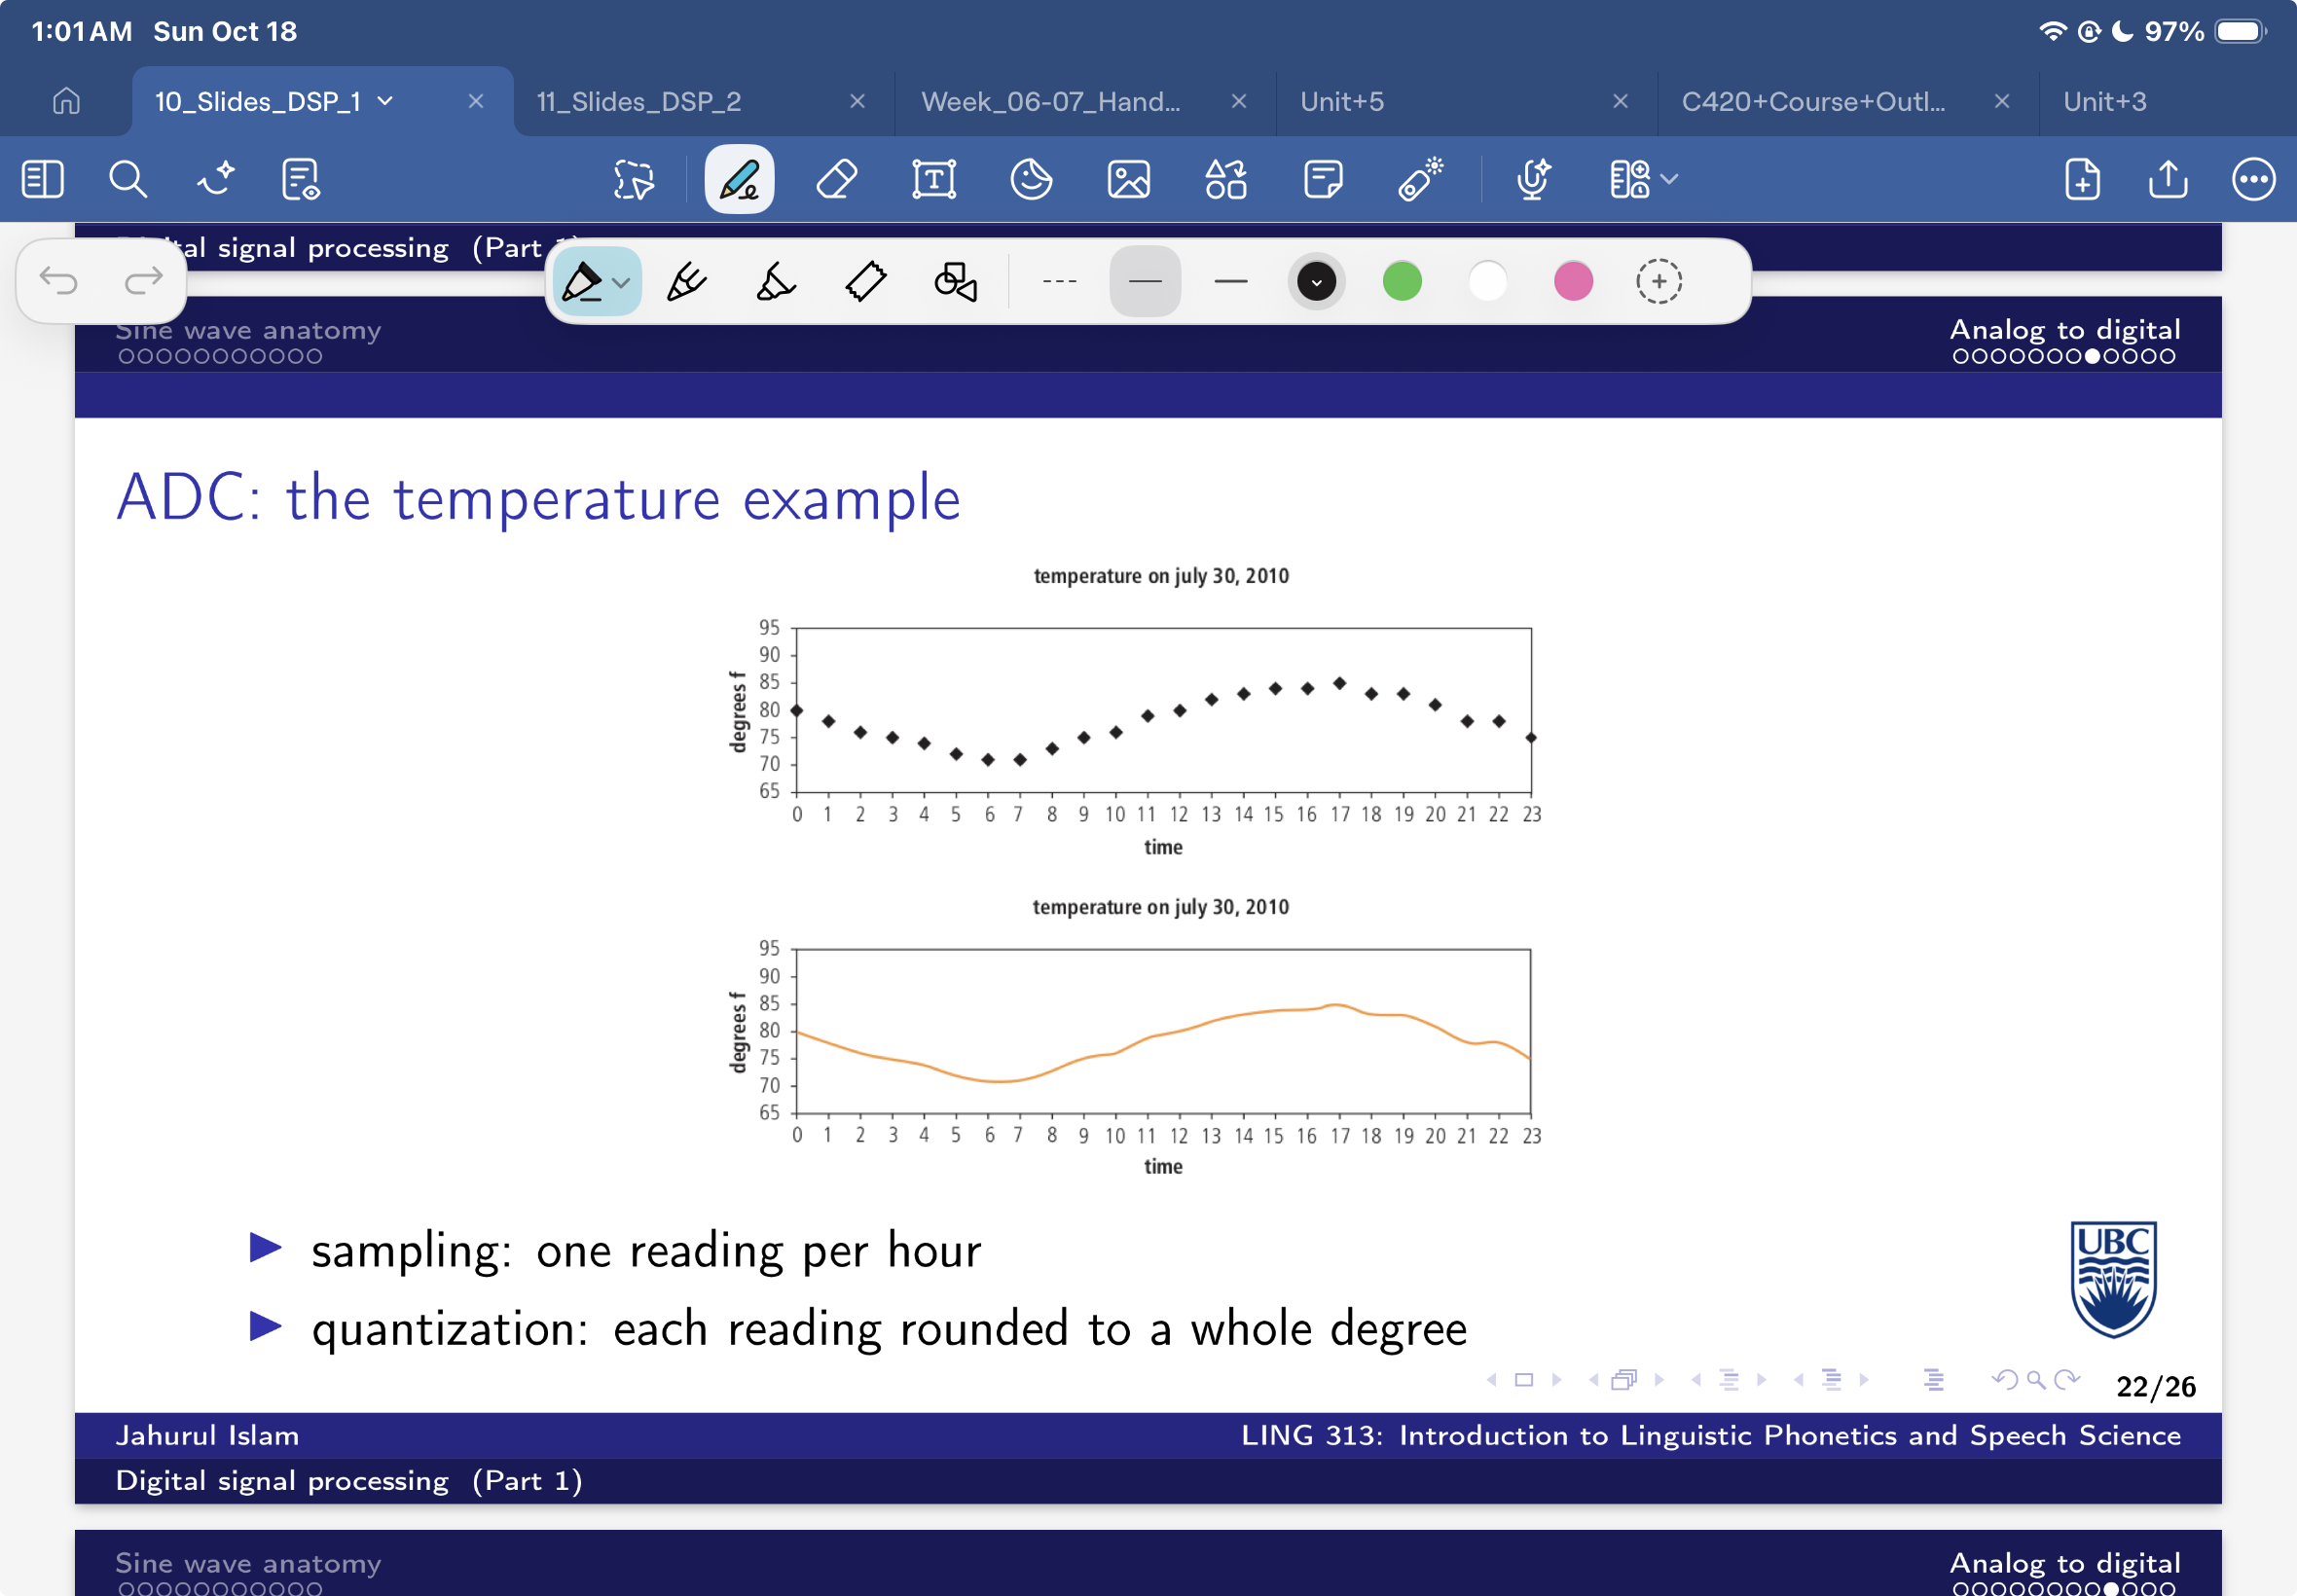
sampling rate/frequency
we decide which values are kept and which are dumped (forever)
the sampling rate says how many samples are kept per second
ex: if we keep 100 samples from a one-second interval, our sampling rate is 100hz

Nyquist theorem
to capture a compnent of freqeuncy f the sampling rate fs must be more than 2f
nyquist frequency
half the samplimng rate ie: fs/2
highest frequency a recording can represent and is a property of tthe recording settings
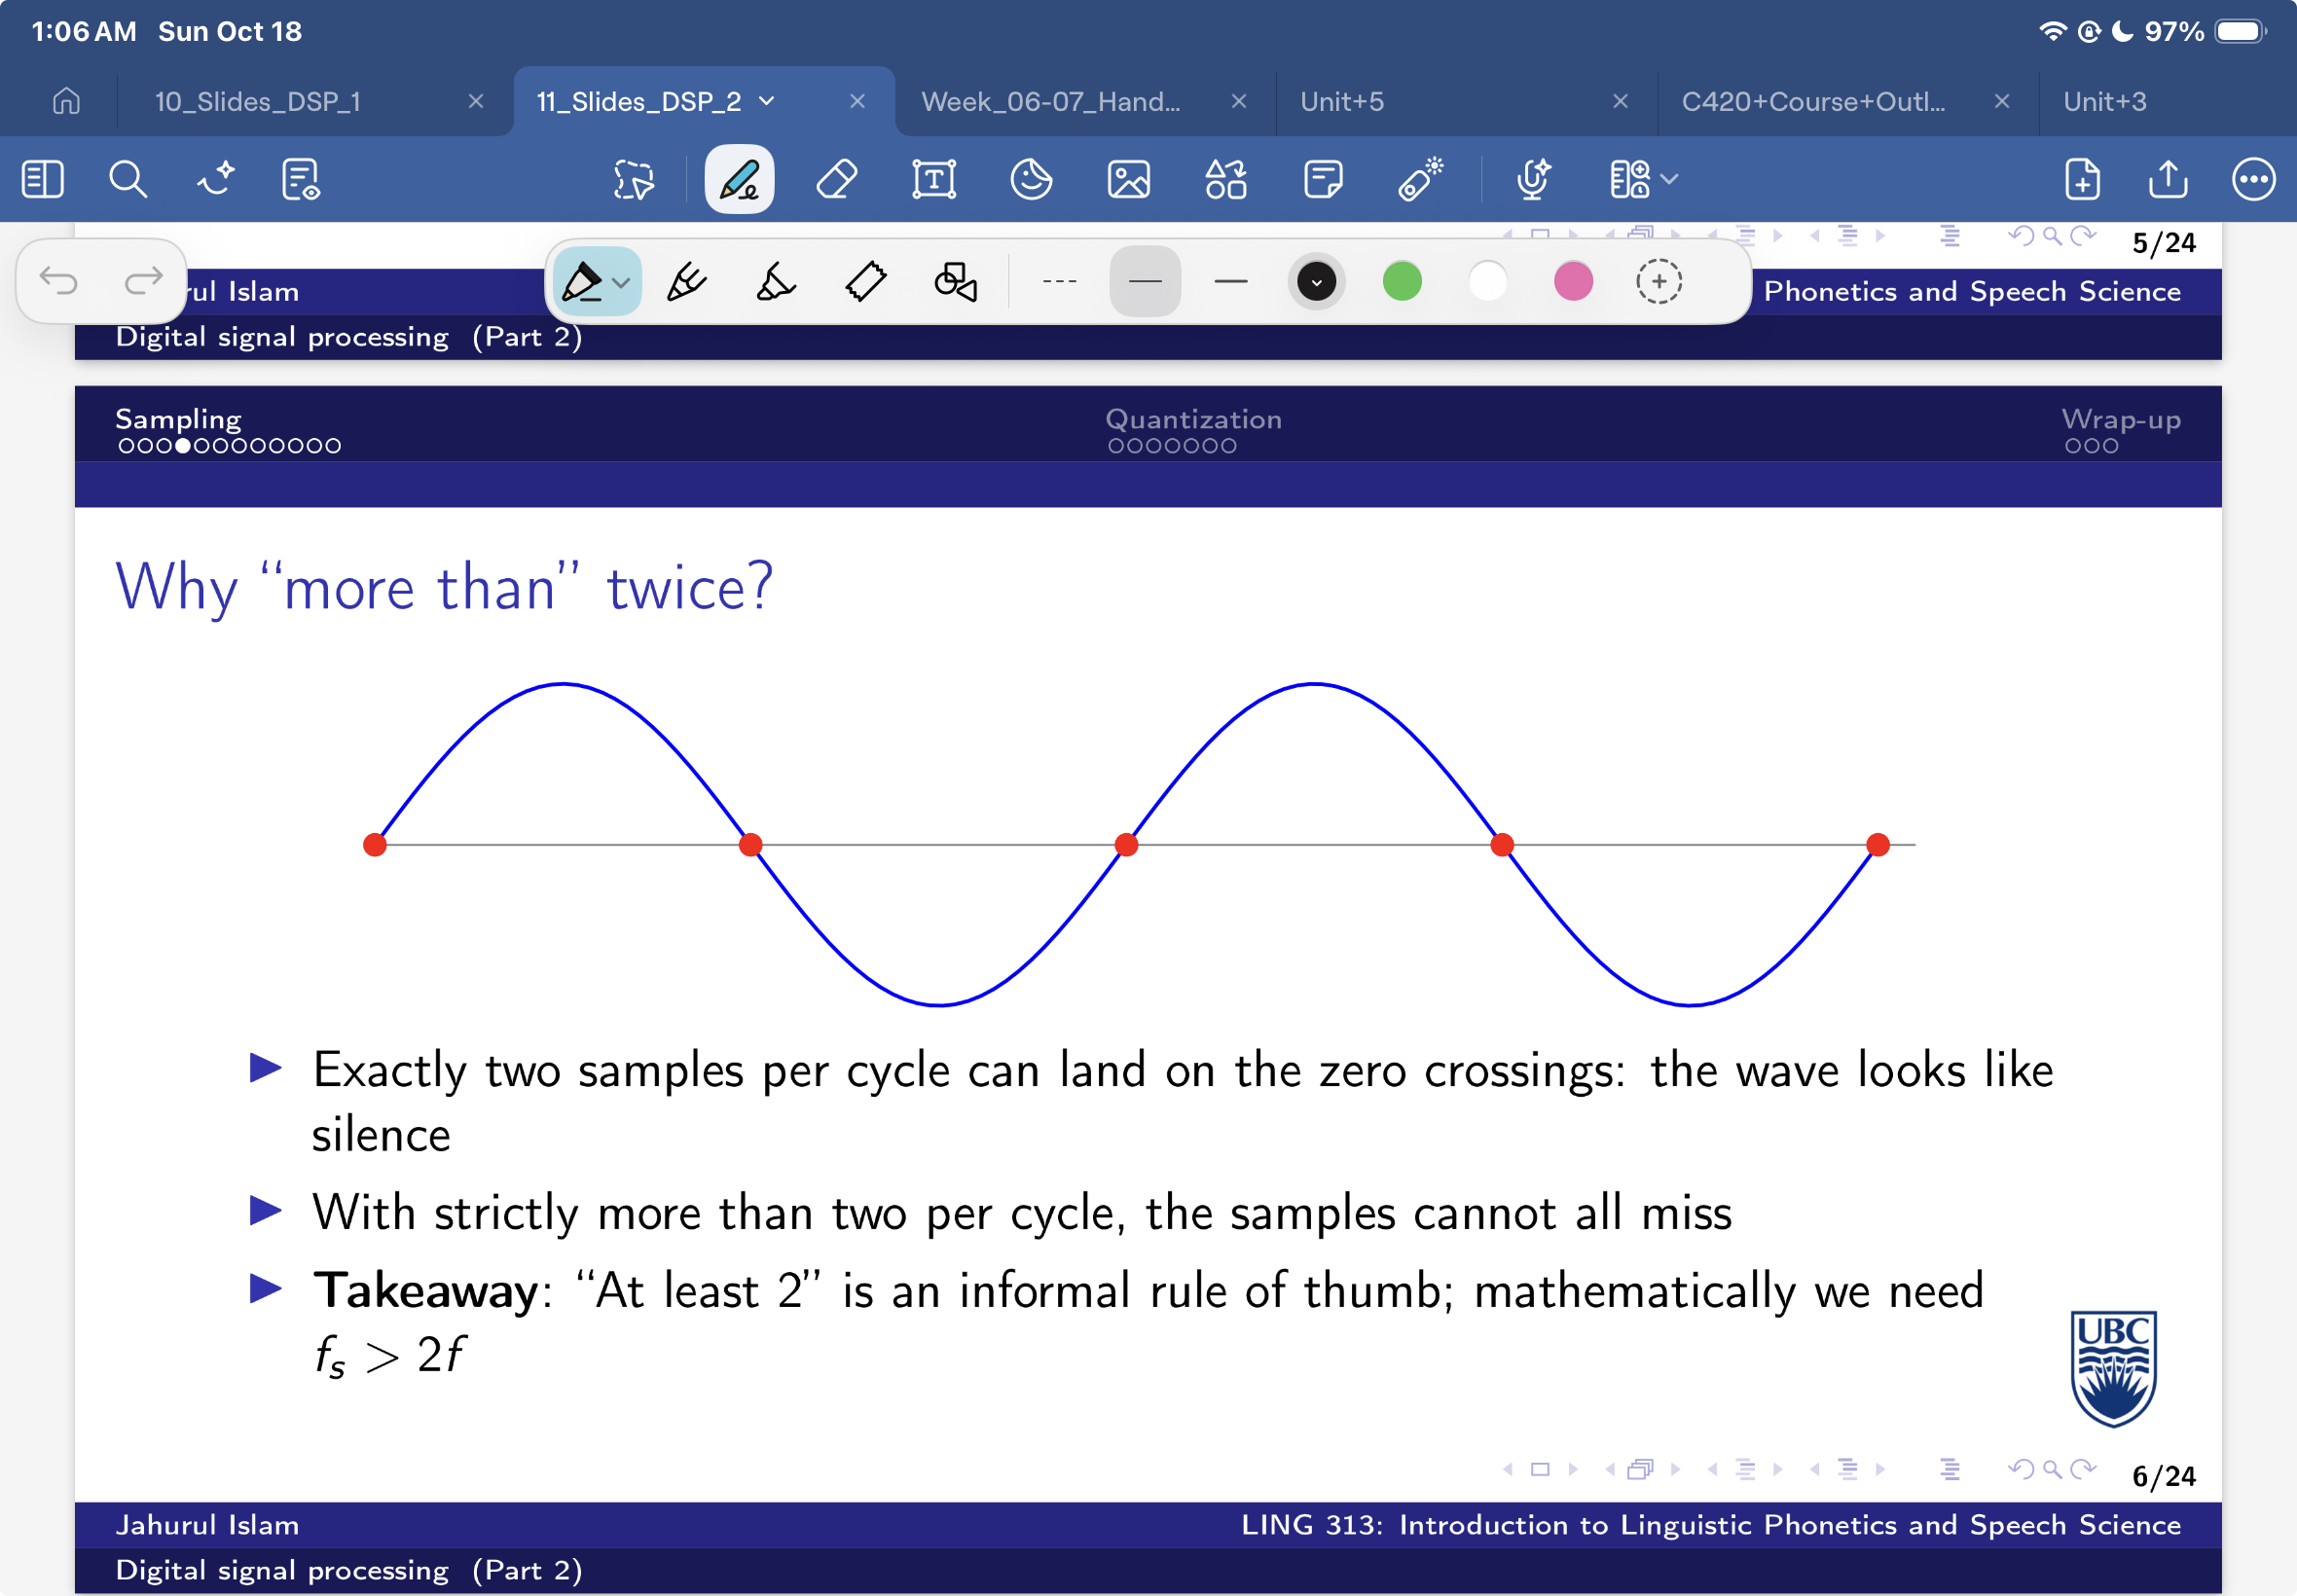
why more than 2 times
exactly 2 samples per cycle can land on the zero crossings, the wave looks like silence
with strickly more than 2 per cycle the samples cannot all miss
Aliasing
a distortion phenomenon that happens when a continuous signal is sampled too slowly, causing high-frequency components to fold into lower, false frequencies
frequencies above the nyuist freq are not lost they “fold back” and show up as false lower frequencies

anti-aliasing filter
before sampling, the recorder passes the signal through a low-pass filter that removes everything above about the nyquist frequency
this is the anti aliasing filer once aliasing has happened it cannot be undone
these day this is built into digital records and audio interfaces so we rarely have to handle it ourselves
why aliasing occurs during downsampling

quantization/sample size/ bit depth
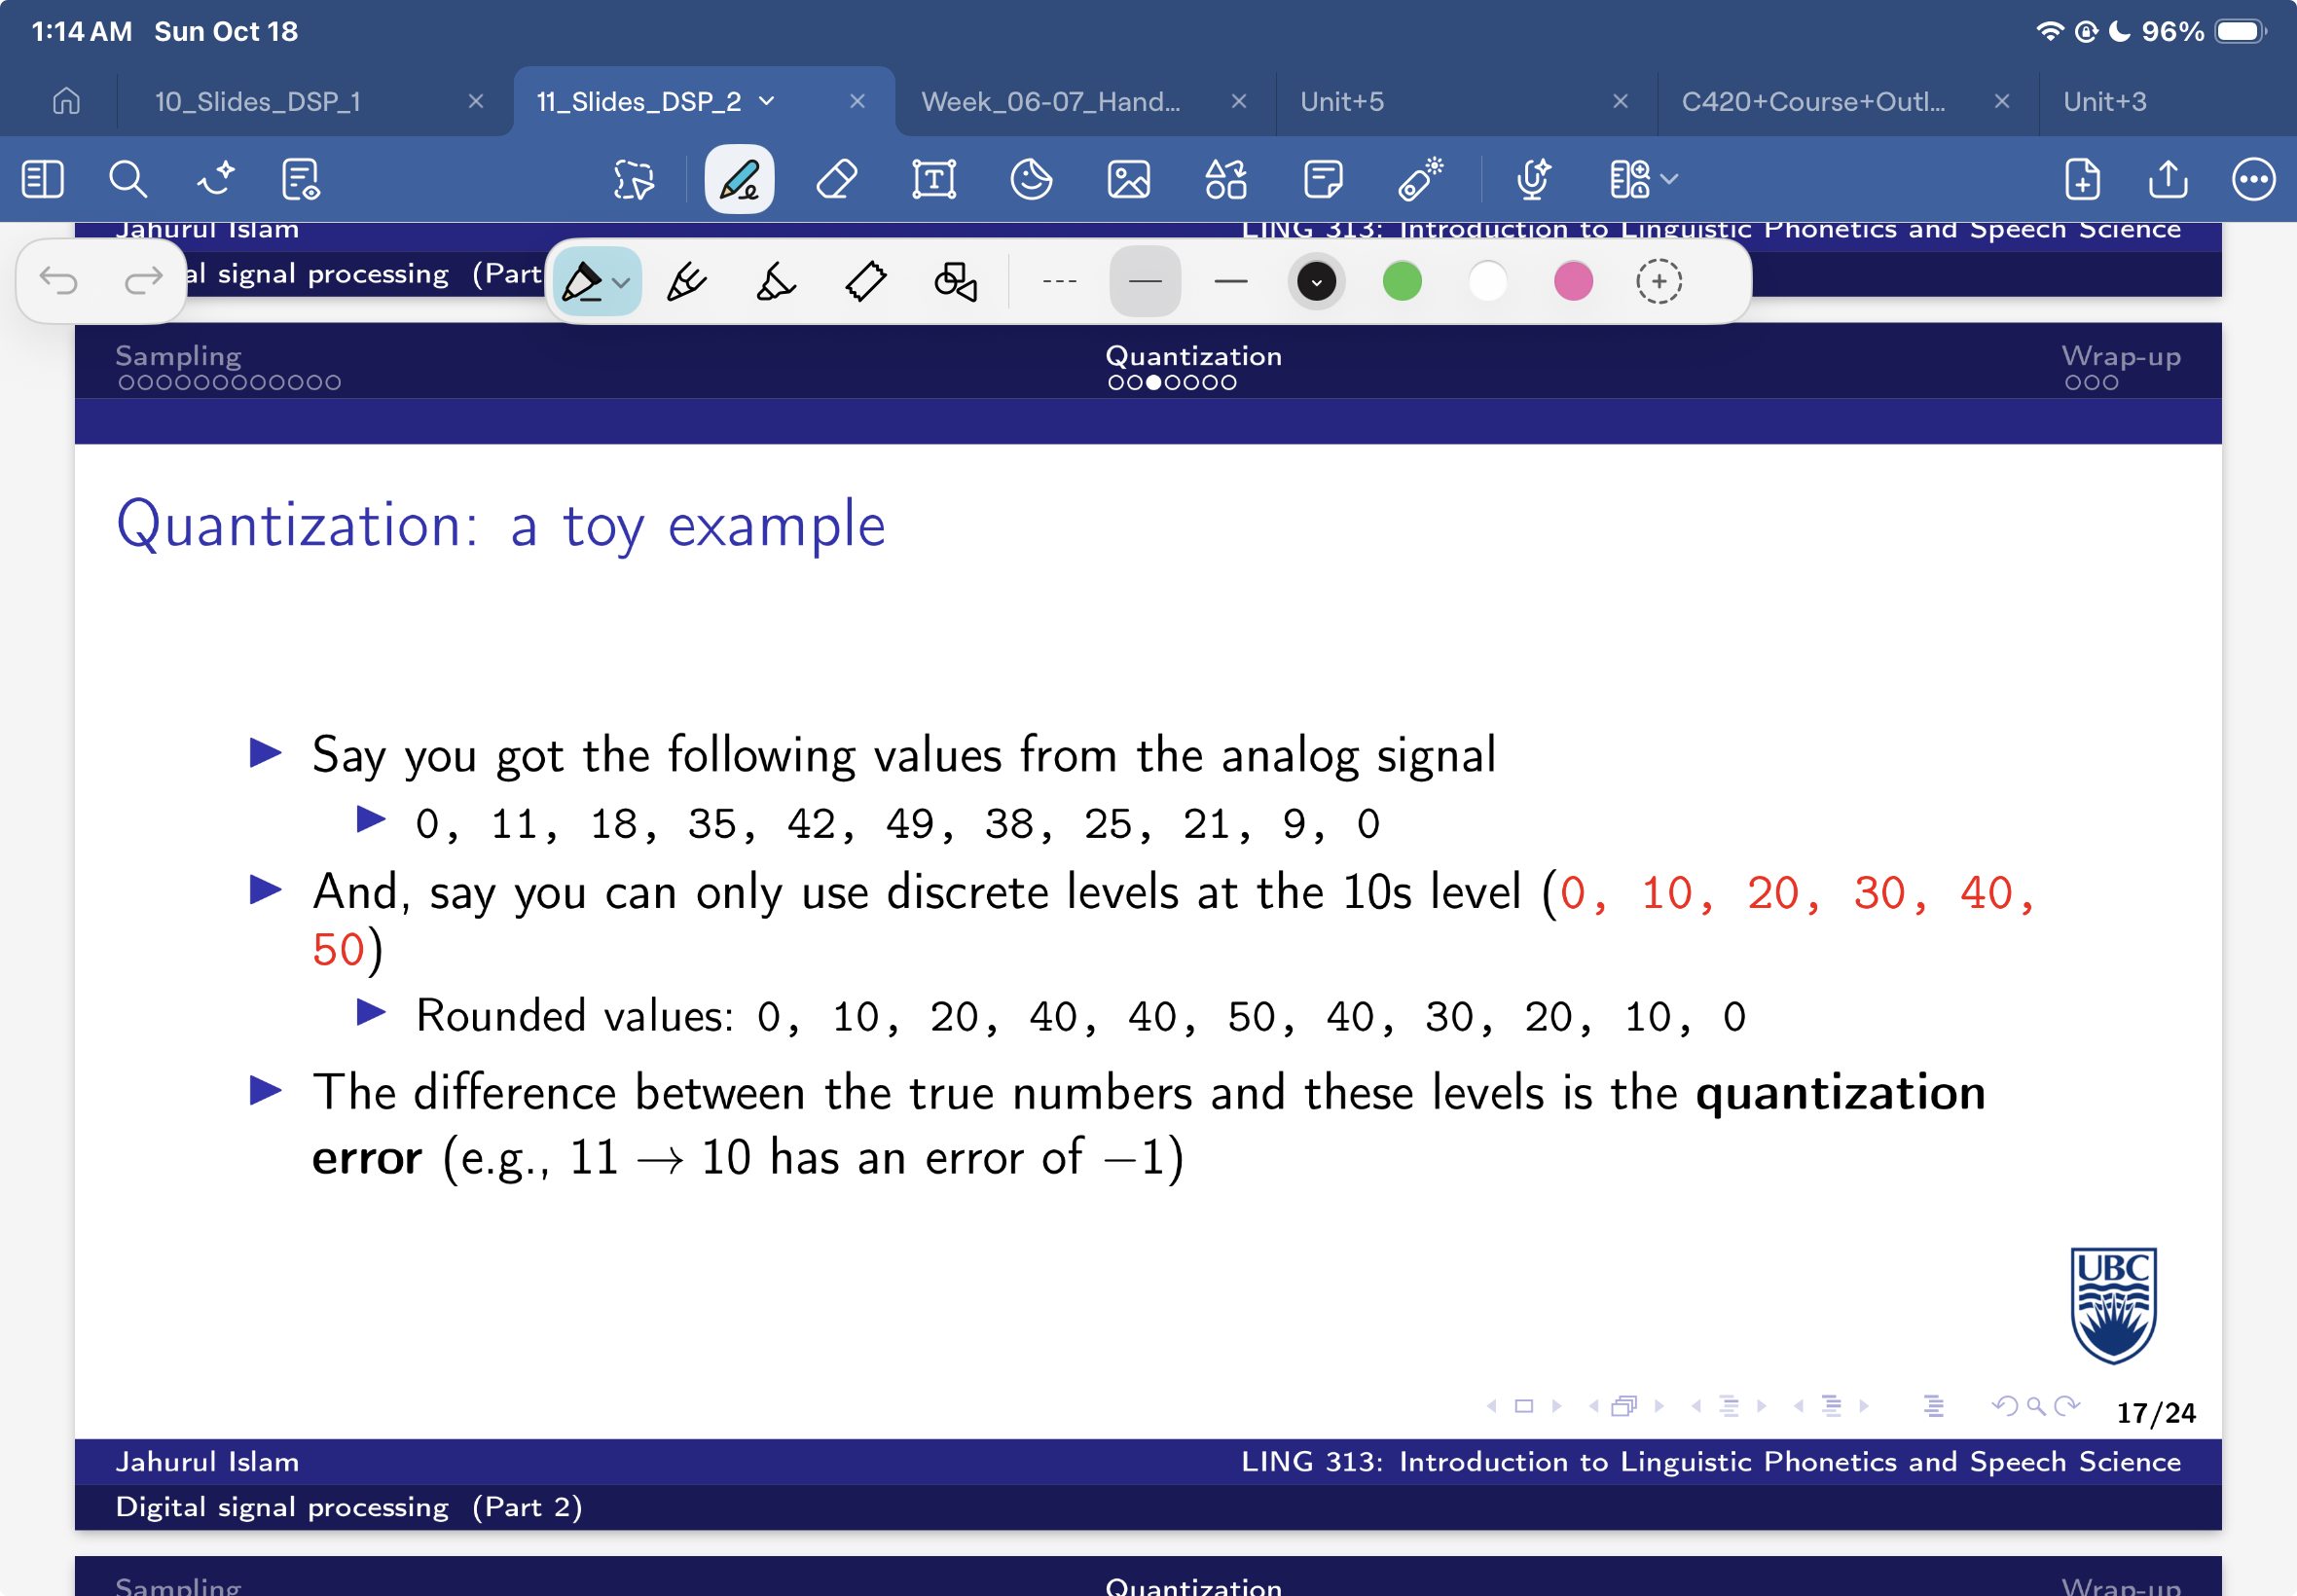
the second issue in digitization is quantization
how precise should our y axis be
analog signals have infinitely many possible values and we cannot allow infinite numbers
quantization example
why do we have more levels

levels to bits

quantization noise

file size

source filter theory
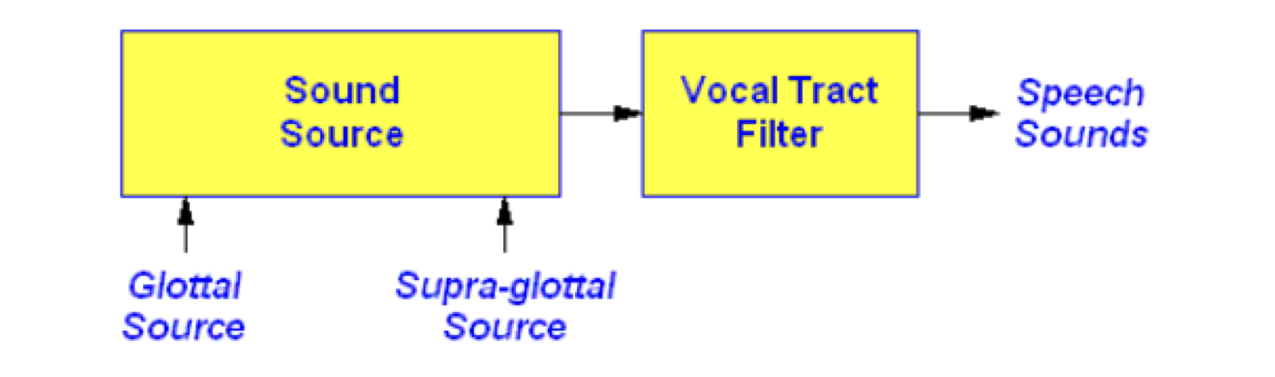
speech = sound produced at the larynx x shaping by the vocal tract
the product of the signal/sound that is produced @ the larynx then shaped @ the vocal tract
who formalized the source-filter theory
gunnar fant (1919-2009) in acoutic theory of speech production (1960)
two parts of the source filter theory
the source
the filter
define the source
what is generating the signals
glottal vibration (periodic) ex vowel
noise generated at a constriction (aperiodic) ex voiceless fricative

define the filter
the supra-laryngeal cavities (the vocal tract)
payoff
source x filter = output

what are harmonics mathamatically
integer mulitples of F0/H1
filters
a filter passes some frequncies and attenusates others
types of filters
low pass, high pass, band pass
low pas
only frequencies lower than this threshold
highpass
only frequencies above x threshold
band-pass
only frequencies between these thresholds

cut off theory
where output drops (conventionally -3dB)
roll-off
how steeply it drops (dB/octave)
bandwith
width of the band pass
narrow bandwidth

the vocal tract as a filter
the vocal tract acts as tube with a series of band-pass filters, it boosts harmonics near the center frquencies and attenuates others
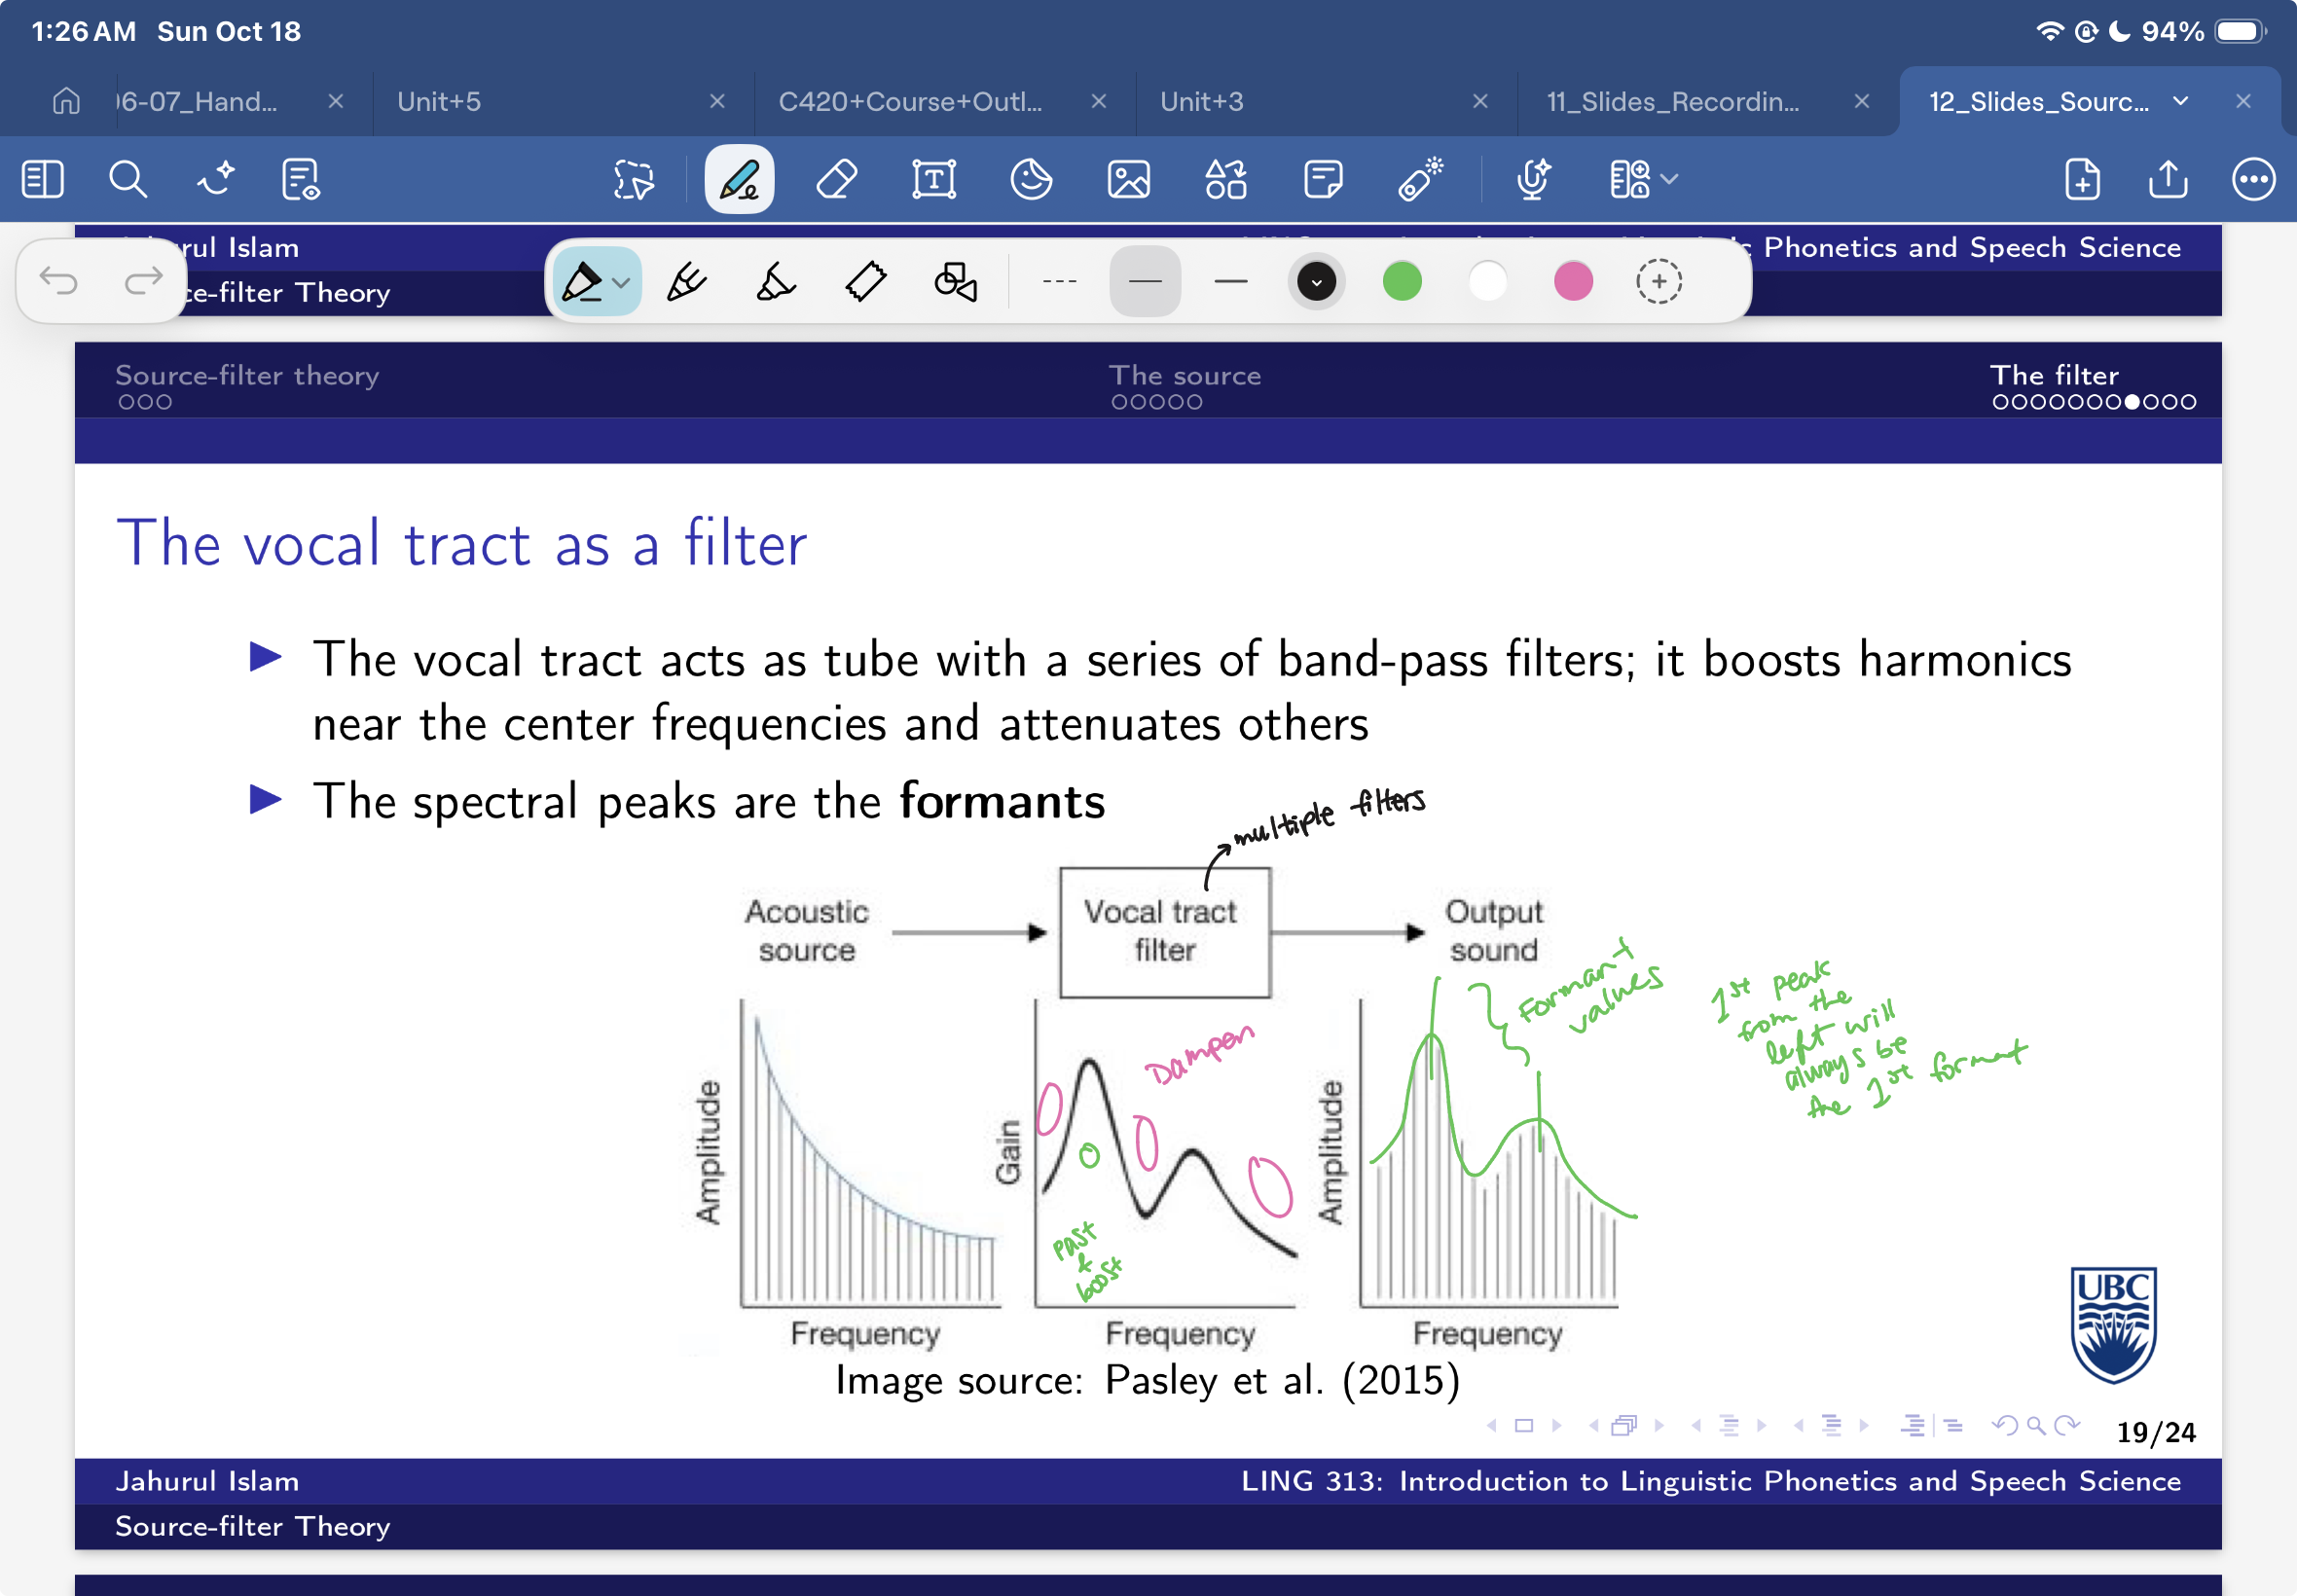
what are the spectral peaks
formats

super imposed
