ECON Development|Classical Theories
 Call Kai
 Learn
Learn Practice Test
 Spaced Repetition
 Match
Match Flashcards
 Knowt Play
1/20

Earn XP
Description and Tags
Harrod-Domar model, Solow Model
Name | Mastery | Learn | Test | Matching | Spaced | Call with Kai | Chat |
|---|
No analytics yet
Send a link to your students to track their progress
21 Terms
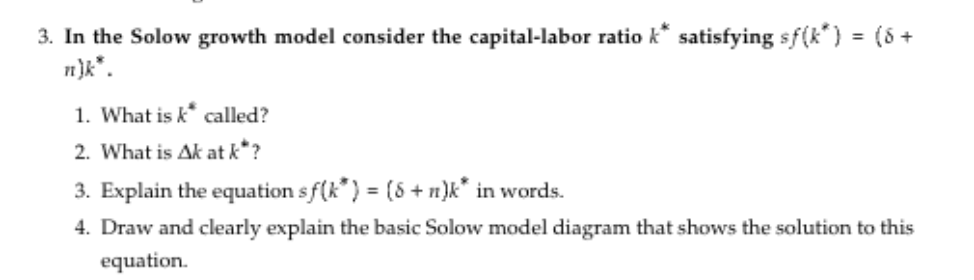
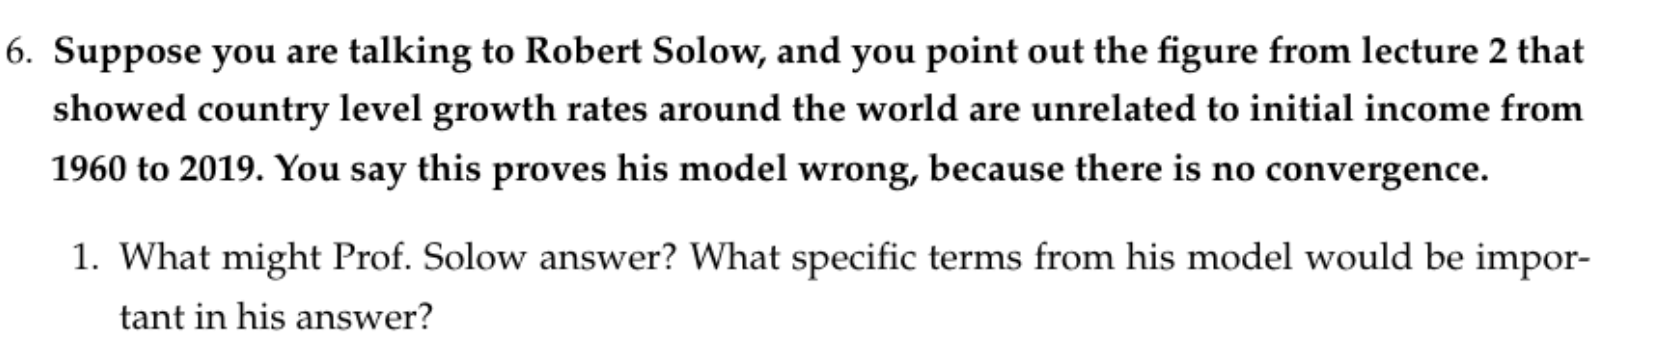
Differentiate between the Harrod-Domar model and the Solow Model

What are the assumptions of the Solow Model?

Why do we use capital per worker through in the function for y

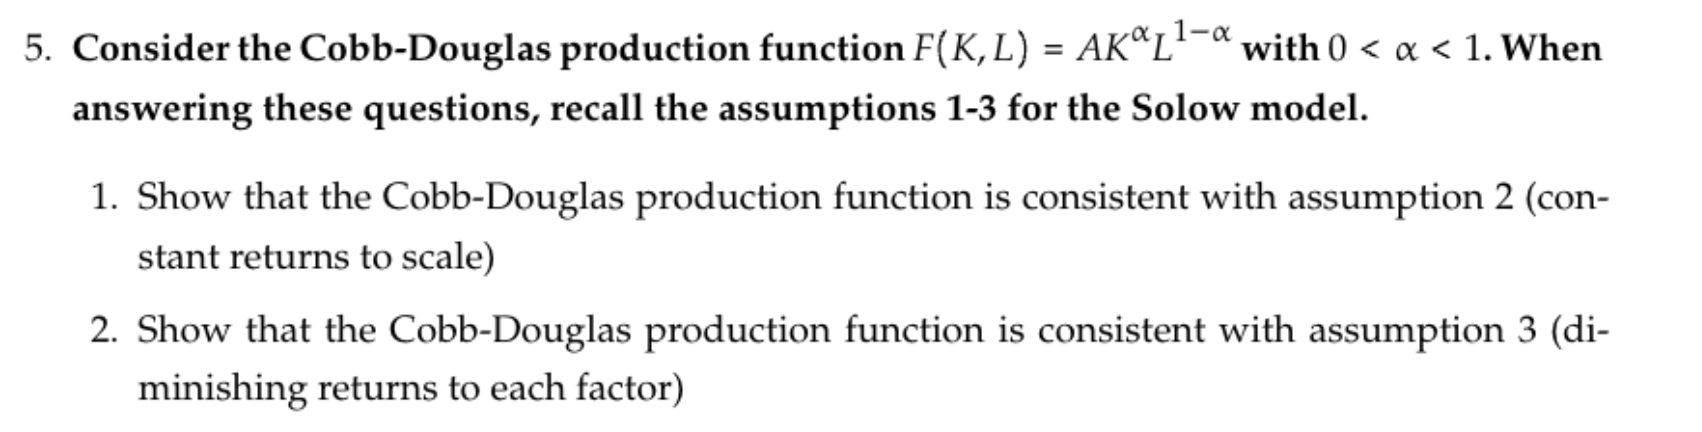
A classmate says: "The Solow production function has diminishing returns to capital and diminishing returns to labour. So if you double both K and L, output must rise by less than double."
(a) Is your classmate right? Explain in one or two sentences, using the two slides as reference.
(b) A firm doubles its capital and labour, and output rises by only 80%. Does it have increasing, decreasing, or constant returns to scale? Does it contradict the claim that each input has diminishing returns?
(a) My classmate would be wrong. The Solow model has diminishing returns to each function but constant returns to scale. Diminishing returns to each function means increasing the function while leaving the other inputs constant.
(b) Because each input was doubled, i.e. increased by 100%, but the output did not increase proportionally but only increased by 80%, this shows that it has diminishing returns to scale. We cannot say anything about returns to each input because we do not know what happens when one of the inputs is held constant and the other varied.
For the Solow Model, recall that Output (Y) is a function of both capital and labor (K and L).
With this in mind, draw the 3D surface plot
On your plot from (1), draw a ray at a constant capital (K). Make a graph depicting the cross sectional isoquant.
On your plot from (1), draw a ray at a constant Labor (L). Make a graph depicting the cross sectional isoquant.
On your plot from (1), draw a ray where both capital and labor are increasing by a constant scale, and call the scale factor gamma.
3D Surface plot of Y vs K and L

Ray at constant capital
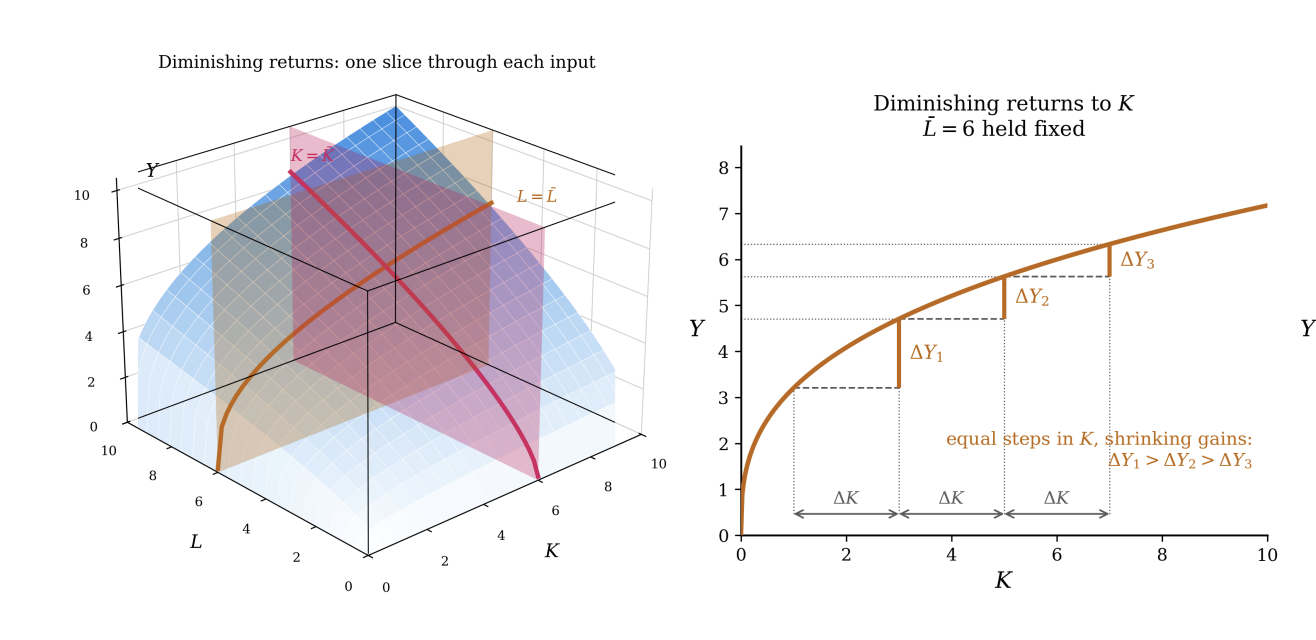
Ray at constant labor

(Same 3D Surface plot as before)
Ray increasing at constant scale factor

Discuss whether the following are true or false:
The Harrod-Domar model states that a country’s per capita growth rate depends on its saving rate, whereas the Solow model says it does not
According to the Harrod-Domar model, if the capital output ratio is high, then growth rate will be faster.
In the Solow model, a change in the long run population growth rate has no effect on the long-run rate of per capita growth.
True. In Harrod-Domar, the growth rate depends on the savings rate. In the Solow model the growth rate of output per capita is always 0 in steady state (unless there is exogenous technological progress). Also, notably, the Harrod-Domar model has no population
False. According to the Harrod-Domar model, Y = 1/c * K. So output is inversely proportional to the growth rate.
True. An increase in the population growth rate increases the growth rate of aggregate output but has no permanent effect on the growth rate of per capita output. An increase in the population growth rate lowers the steady-state level of per capita output.
In the Solow Model,
What is the equation for y (income per capita)
What happens to y over time as the population grows? Explain.
Which effect wins out?
What is the significance of delta k = 0?

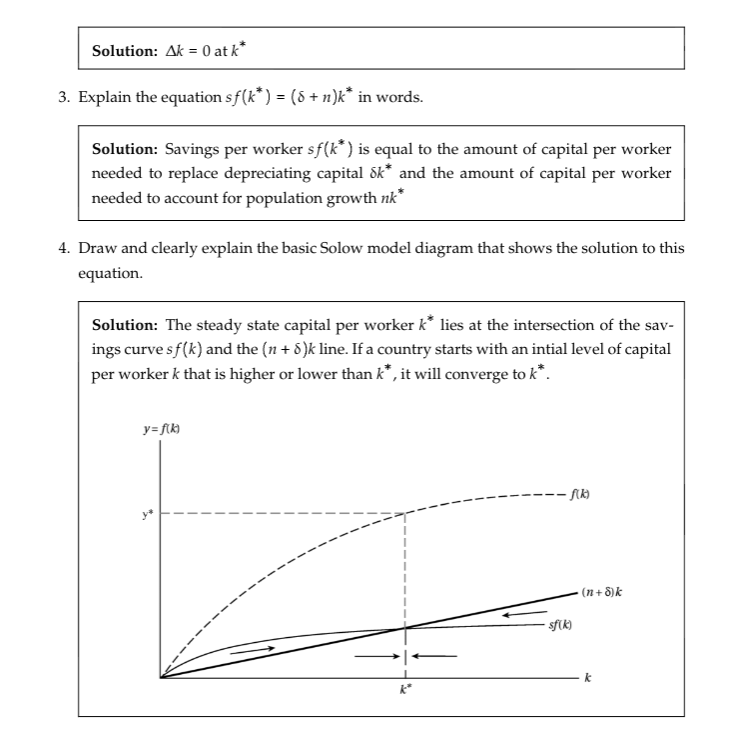
Draw a graph that shows the relationship between income per capita (income per person) and capital per person k.


Explain, in the Solow model, what happens to income per capita (y) through time and why?
Population L grows at constant rate n
Aggregate income Y rises since more workers means more output
But also increasing denominator L
Which effect wins out? Depends on what happens to K
If K stays fixed, then diminsihing returns Y will rise by less than rate n and hence y falls
K rises at exactly rate n, then by constant returns Y will also rise at rate n → y, holds steady. This is the steady state.
What is special about n
Which effect wins out? Depends on what happens to K
If K stays fixed, then diminsihing returns Y will rise by less than rate n and hence y falls
K rises at exactly rate n, then by constant returns Y will also rise at rate n → y, holds steady. This is the steady state.
What is the solow equation?

Derive the equation for delta k = 0

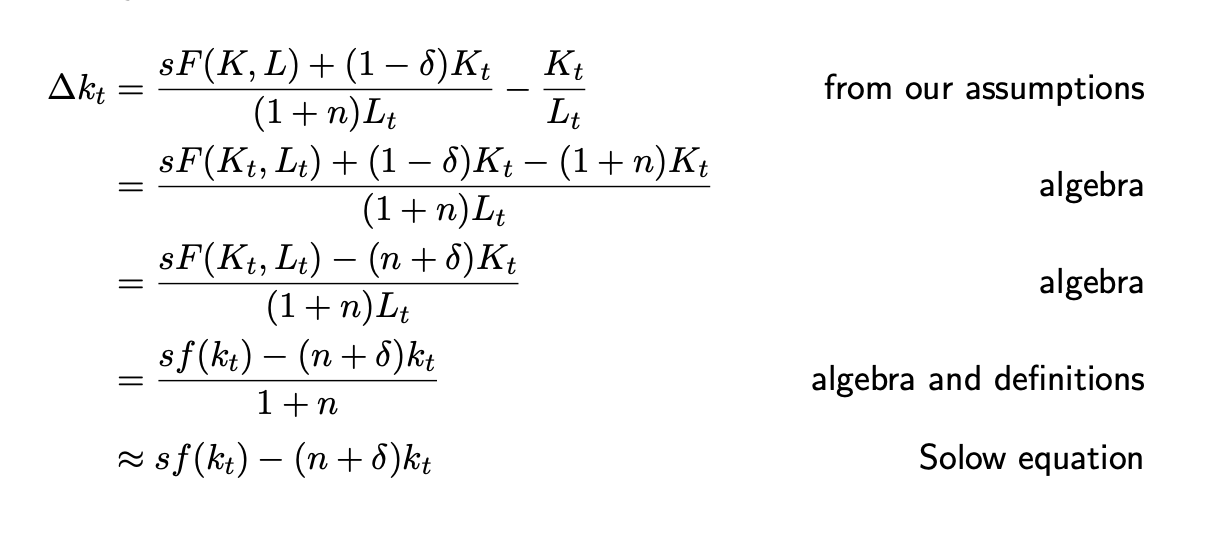
What is the significance of k* in the solow equation


Draw the graph for capital per person vs output and indicate the point of steady state

Draw the graph for capital per person vs output and indicate the point of steady state, and label the consumption per capita
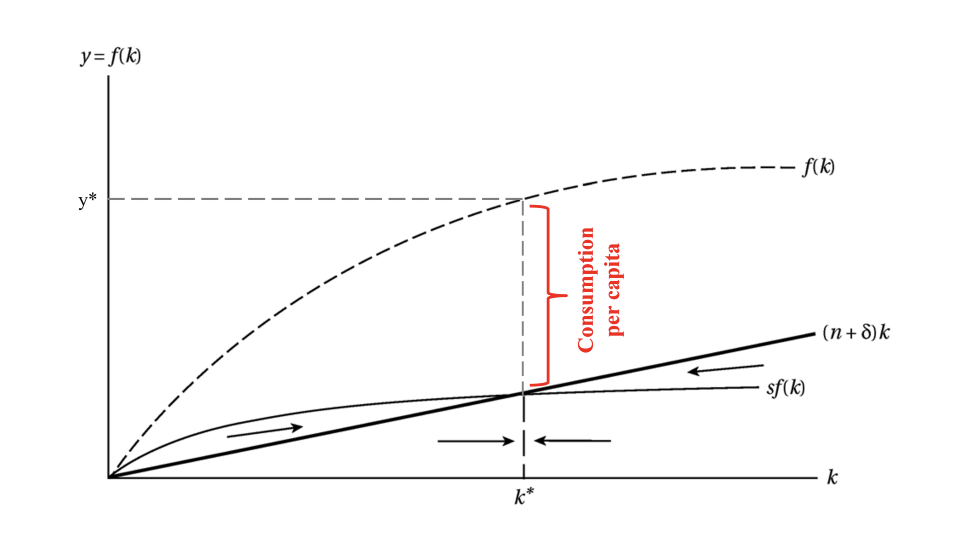
Draw the graph for capital per person vs output and indicate what happens when the capital statrts low, below steady state point

Draw the graph for capital per person vs output and indicate what happens when the capital statrts high, above steady state point